Nutrigenomics Bioinformatics Market Size and Share
Market Overview
| Study Period | 2020 - 2031 |
|---|---|
| Market Size (2026) | USD 0.67 Billion |
| Market Size (2031) | USD 1.05 Billion |
| Growth Rate (2026 - 2031) | 10.42 % CAGR |
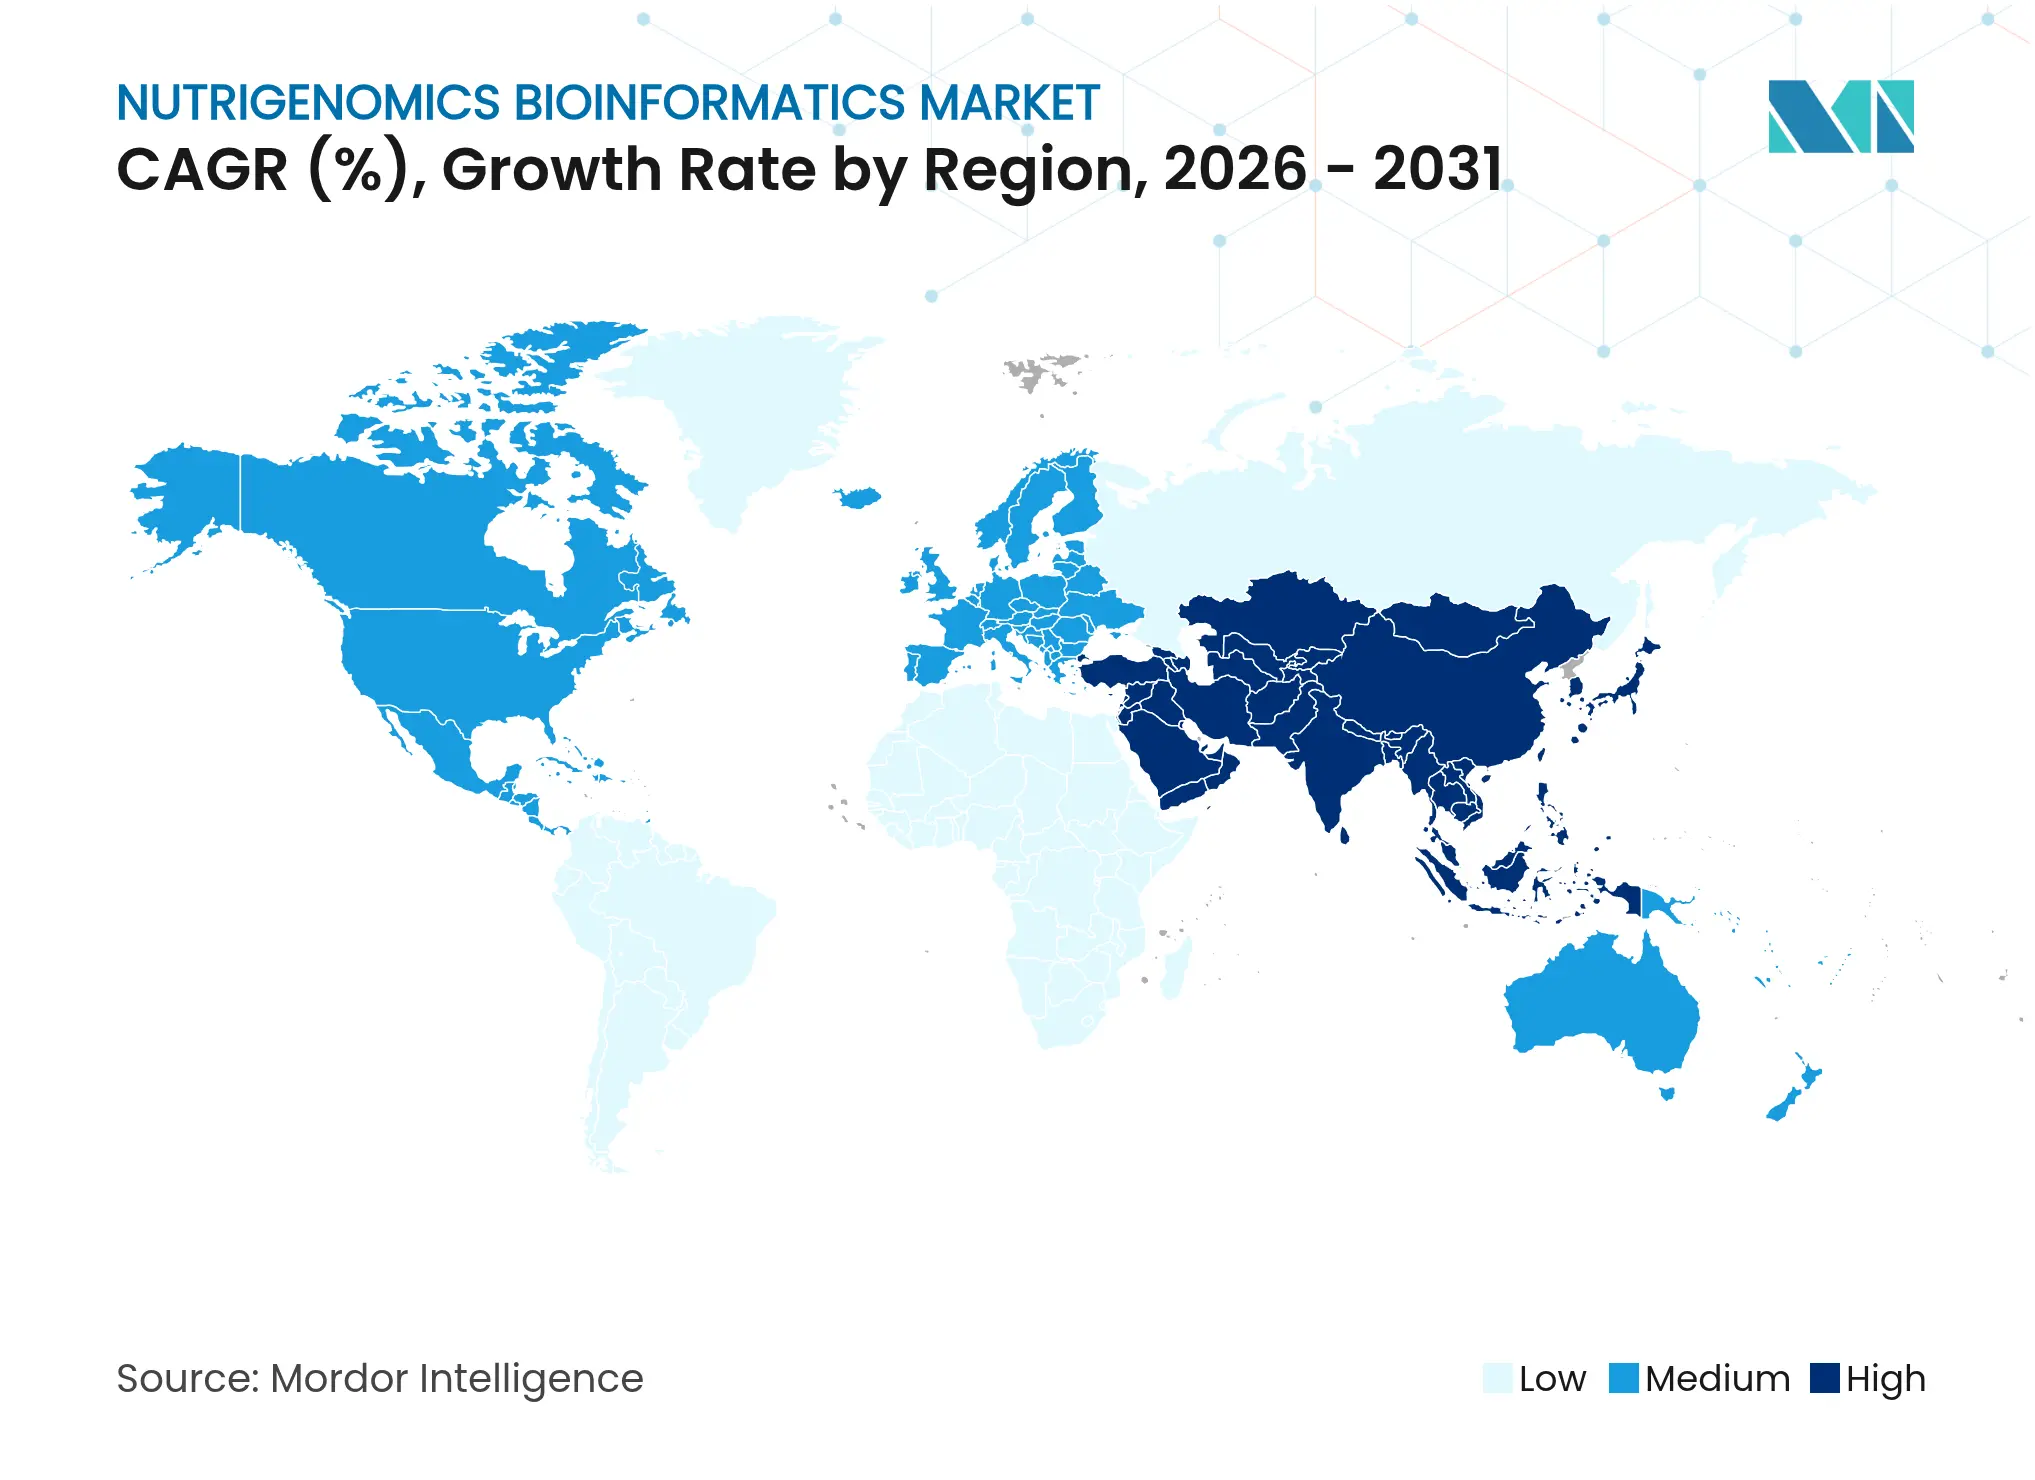
| Fastest Growing Market | Asia Pacific |
| Largest Market | North America |
| Market Concentration | Medium |
Major Players *Disclaimer: Major Players sorted in no particular order. Image © Mordor Intelligence. Reuse requires attribution under CC BY 4.0. |
Nutrigenomics Bioinformatics Market Analysis by Mordor Intelligence
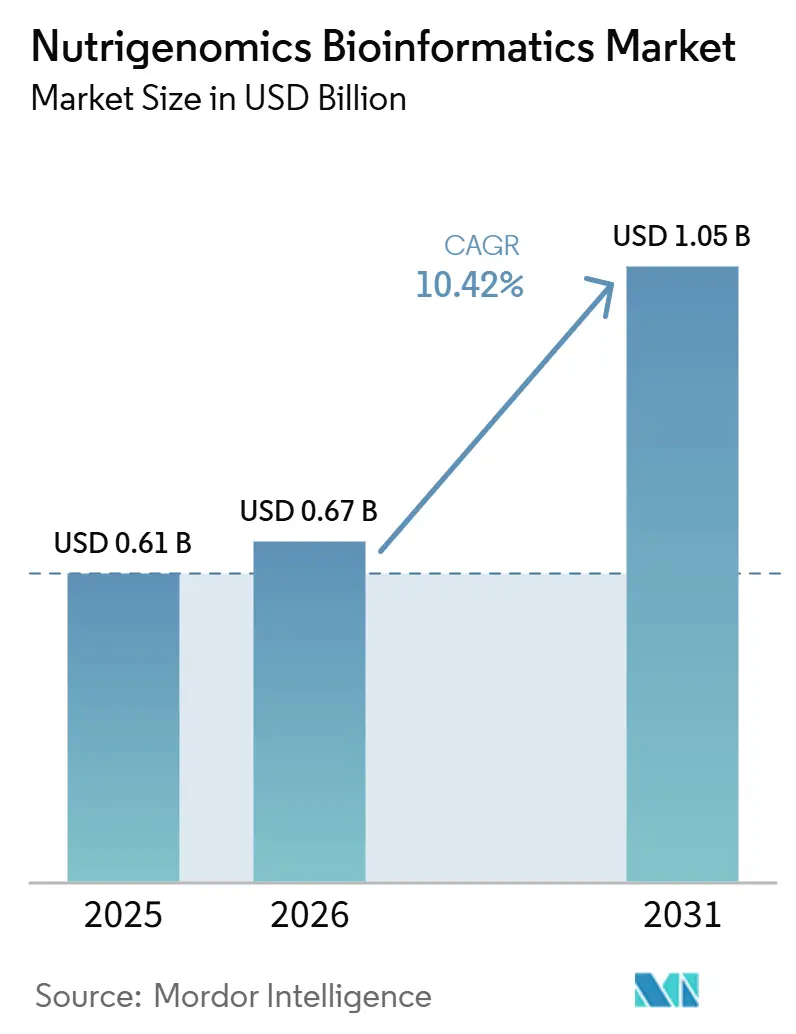
The nutrigenomics bioinformatics market size was valued at USD 0.61 billion in 2025 and estimated to grow from USD 0.67 billion in 2026 to reach USD 1.05 billion by 2031, at a CAGR of 10.42% during the forecast period (2026-2031). Rising demand for precision-based dietary interventions, expanding clinical validation of gene–diet interactions, and rapid advances in AI-enabled multi-omics analytics are expected to shape the next five years of growth. North America continues to capture the lion’s share of spending, yet Asia-Pacific’s double-digit expansion indicates that emerging economies will increasingly influence technology diffusion and price discovery. Competitive intensity is accelerating as platform players shift from hardware-centric testing models toward cloud-native software solutions that shorten bioinformatics workflows and lower data-processing costs. Clinical guidelines that endorse gene-based nutrition for obesity care are poised to catalyze payer acceptance, while government-funded precision-nutrition pilots in China and India broaden the addressable user base beyond high-income consumers.
Key Report Takeaways
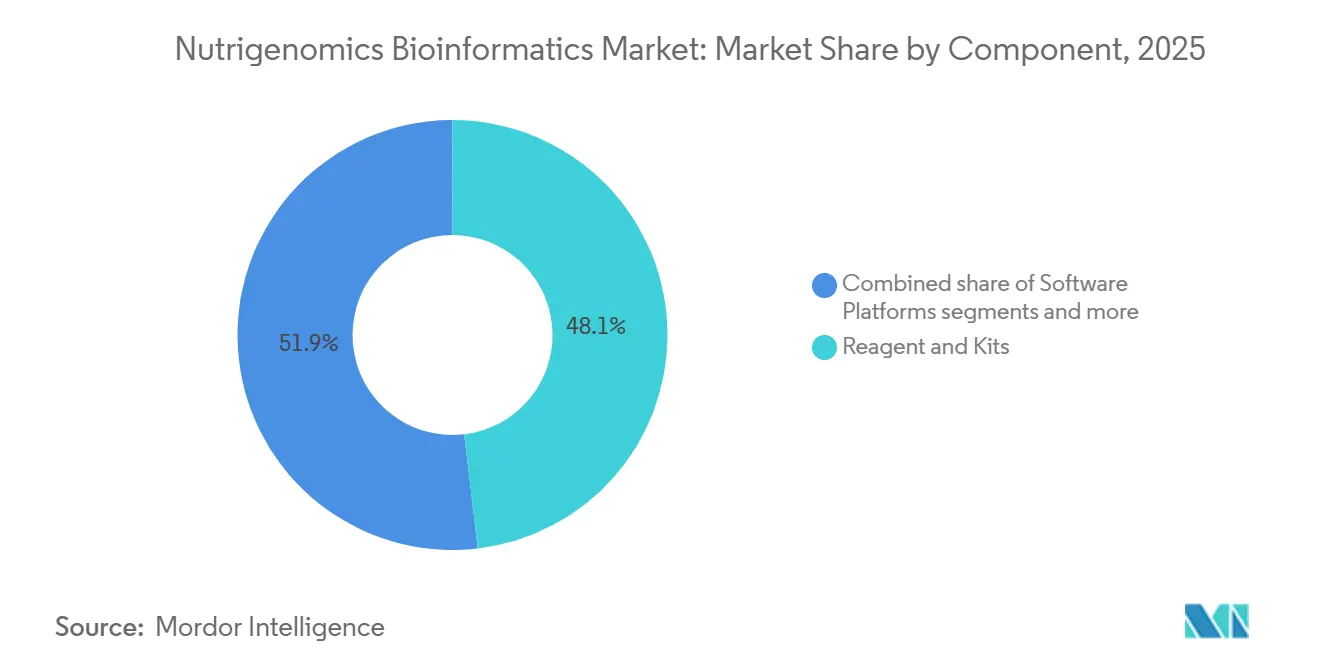
- By component, reagents and kits led with 48.12% of nutrigenomics bioinformatics market share in 2025, whereas software platforms are projected to advance at a 10.79% CAGR to 2031.
- By application, obesity accounted for 36.92% of the nutrigenomics bioinformatics market size in 2025, while diabetes & metabolic disorders represents the fastest-growing segment at an 10.98% CAGR through 2031.
- By end user, research & academic institutes held 43.25% revenue share in 2025; nutraceutical/functional-food companies record the highest projected CAGR at 11.12% over the same horizon.
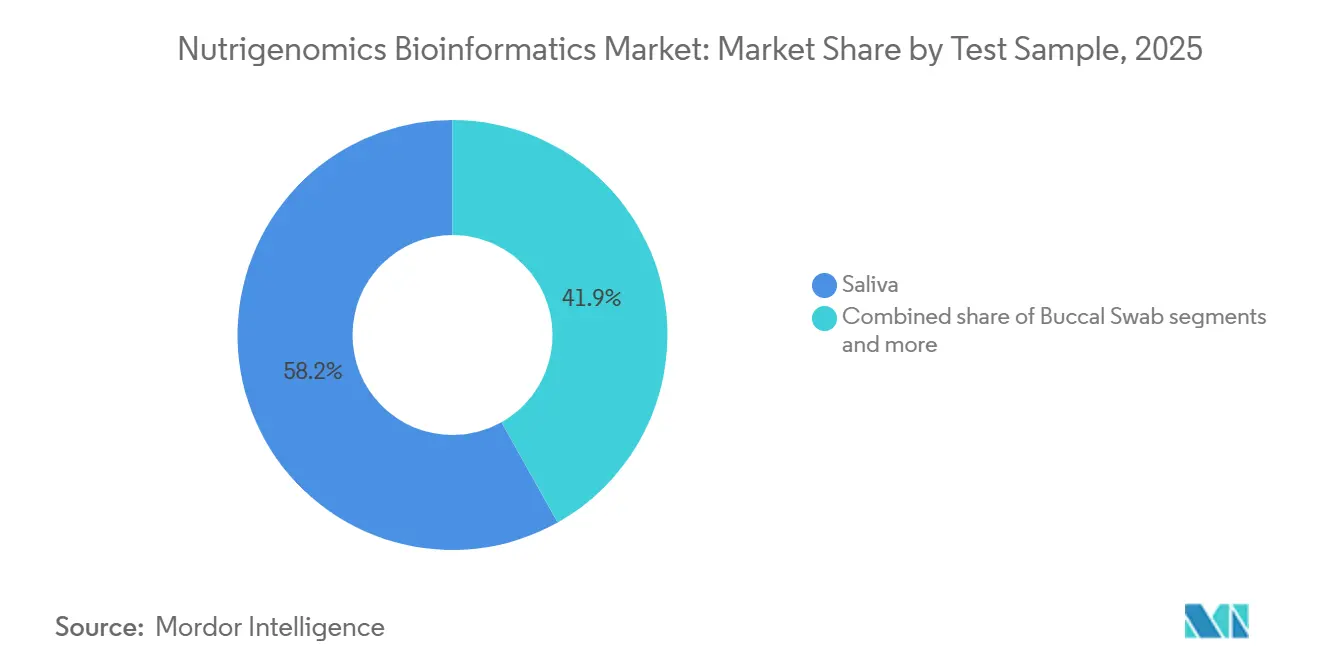
- By Test Sample, Salive held 58.15% revenue share in 2025; Buccal swab record the highest projected CAGR over the forecast period.
- By geography, North America commanded 44.75% of the nutrigenomics bioinformatics market in 2025, but Asia-Pacific is forecast to expand at an 11.34% CAGR to 2031.
Note: Market size and forecast figures in this report are generated using Mordor Intelligence's proprietary estimation framework, updated with the latest available data and insights as of 2026.
Global Nutrigenomics Bioinformatics Market Trends and Insights
Drivers Impact Analysis
| Driver | (~) % Impact on CAGR Forecast | Geographic Relevance | Impact Timeline | |||
|---|---|---|---|---|---|---|
Rising uptake of cloud-native bioinformatics platforms Rising uptake of cloud-native bioinformatics platforms | +2.1% | Global, concentrated in North America & Western Europe | Short term (≤ 2 years) | (~) % Impact on CAGR Forecast:+2.1% | Geographic Relevance:Global, concentrated in North America & Western Europe | Impact Timeline:Short term (≤ 2 years) |
Mainstream adoption of direct-to-consumer (DTC) nutrigenomic tests Mainstream adoption of direct-to-consumer (DTC) nutrigenomic tests | +2.4% | North America & Europe, with spill-over to APAC | Medium term (2–4 years) | |||
Integration of AI/ML for multi-omics data interpretation Integration of AI/ML for multi-omics data interpretation | +1.8% | Global, led by North America and East Asia R&D hubs | Medium term (2–4 years) | |||
Clinical guidelines endorsing gene-based nutrition for obesity care Clinical guidelines endorsing gene-based nutrition for obesity care | +1.5% | North America & EU, with early adoption in Australia & GCC | Medium term (2–4 years) | |||
Emergence of microbiome-nutrigenomic co-analysis services Emergence of microbiome-nutrigenomic co-analysis services | +1.3% | Global, early gains in North America, APAC, and Israel | Long term (≥ 4 years) | |||
Government precision-nutrition pilots in China & India Government precision-nutrition pilots in China & India | +1.2% | APAC core (China & India), spill-over to MEA | Medium term (2–4 years) | |||
| Source: Mordor Intelligence | ||||||
Rising Uptake of Cloud-Native Bioinformatics Platforms
Large-scale genomic analytics increasingly rely on cloud infrastructure that provides elastic compute and secure data storage. Solutions such as Almaden Genomics’ g.nome™ slash workflow development time from months to hours, making enterprise-grade pipelines accessible to mid-sized laboratories and start-ups alike. Lower entry barriers encourage new service providers to participate in the nutrigenomics bioinformatics market, intensifying competition and stimulating pricing innovation. Interoperability standards improve cross-institution collaboration, while real-time data sharing supports distributed clinical trials. The resulting ecosystem accelerates algorithm refinement because models can be retrained continuously on larger, more diverse datasets, ultimately enhancing prediction accuracy for individualized diet plans.
Mainstream Adoption of Direct-to-Consumer Nutrigenomic Tests
Retail-integrated genetic testing is moving beyond curiosity-driven ancestry reports toward actionable grocery recommendations delivered at point of purchase. GenoPalate’s partnership with Earth Fare links in-store QR codes to genotype-based meal plans, translating complex variant data into everyday food choices. The FDA’s 2024 laboratory-developed-test rule imposes stringent validation requirements that favor firms with deep regulatory capabilities. Higher compliance costs could consolidate market share among established players, but consumer trust may rise as accuracy improves, driving expanded volume. The trend broadens the nutrigenomics bioinformatics industry user base by engaging mainstream shoppers rather than health-enthusiast early adopters.
Integration of AI/ML for Multi-Omics Data Interpretation
Machine-learning models now integrate genomic, metabolomic, and microbiome datasets to generate dietary prescriptions that outperform physician-guided protocols. A randomized trial showed a 25.3% LDL-cholesterol reduction with AI-driven supplement advice versus 15.2% under traditional care. Publicly funded cohorts such as the NIH’s 10,000-participant precision nutrition study will supply unprecedented training data. Continuous learning algorithms refine nutrient–gene interaction maps, allowing the nutrigenomics bioinformatics market to deliver clinically validated recommendations at scale. Insurers may begin reimbursing algorithm-generated diet plans once outcome data demonstrate sustained reductions in cardiometabolic risk.
Clinical Guidelines Endorsing Gene-Based Nutrition for Obesity Care
The American Heart Association’s 2025 statement recognizes the clinical utility of genotype information in cardiovascular risk management, indirectly legitimizing nutrition-focused gene testing. Evidence from the ASPIRE-DNA trial indicates that DNA-tailored diets significantly lower fasting plasma glucose and HbA1c in pre-diabetic adults. Such results underpin emerging protocols that integrate genetic screening into routine obesity treatment, providing a pathway for payer coverage. Long term, gene-based nutrition may serve as a stepping-stone toward advanced gene-editing interventions, yet near-term revenue growth will stem from software platforms that translate validated SNP panels into patient-specific meal plans.
Restraints Impact Analysis
| Restraint | (~) % Impact on CAGR Forecast | Geographic Relevance | Impact Timeline | |||
|---|---|---|---|---|---|---|
High cost & low reimbursement for gene-based diet tests High cost & low reimbursement for gene-based diet tests | -1.9% | Global, particularly acute in emerging markets | Short term (≤ 2 years) | (~) % Impact on CAGR Forecast:-1.9% | Geographic Relevance:Global, particularly acute in emerging markets | Impact Timeline:Short term (≤ 2 years) |
Data-privacy concerns over nutrigenomic datasets Data-privacy concerns over nutrigenomic datasets | -1.1% | EU & North America primary, expanding globally | Medium term (2-4 years) | |||
Scarcity of validated gene-diet clinical trials Scarcity of validated gene-diet clinical trials | -1.3% | Global, with regulatory focus in developed markets | Long term (≥ 4 years) | |||
Fragmented regulatory oversight on DTC tests Fragmented regulatory oversight on DTC tests | -0.8% | Global, with varying regional intensity | Medium term (2-4 years) | |||
| Source: Mordor Intelligence | ||||||
High Cost & Low Reimbursement for Gene-Based Diet Tests
Consumer panels typically cost USD 200–500, well above out-of-pocket thresholds in middle-income populations. A 2025 review of US health-plan policies found broad MolDX coverage but limited adoption by major commercial insurers. Preventive nutrition is often excluded from existing reimbursement frameworks, forcing payers to weigh long-term savings against short-term expenditures. Price elasticity could slow uptake in the nutrigenomics bioinformatics industry until evidence demonstrates robust ROI for insurers. Market leaders are responding with subscription models and bundled coaching services that spread payment over time.
Data-Privacy Concerns Over Nutrigenomic Datasets
The 23andMe breach that exposed 7 million profiles underscores the reputational risk of genetic data mismanagement. Proposed European legislation introduces enhanced consent protocols but also increases compliance costs for cross-border data sharing. Consumer hesitancy may depress sample submissions in privacy-sensitive regions, dampening dataset growth that AI models rely on. Vendors are investing in zero-knowledge encryption and federated analytics to reassure users that raw genomes never leave secure enclaves. Transparent governance frameworks will be necessary to rebuild trust and sustain data-driven value creation in the nutrigenomics bioinformatics market.
Segment Analysis
By Component: Cloud-Native Software Redefines Value Creation
The nutrigenomics bioinformatics market size for reagents and kits represented USD 0.29 billion in 2025, translating into 48.12% of revenue, yet growth moderates as laboratories transition from wet-lab throughput to digital insight generation. Software platforms deliver the fastest expansion, recording a 10.79% CAGR that is projected to lift their share materially by 2031. Platform vendors monetize recurring licenses, AI-powered analytics subscriptions, and data-interoperability layers. Reagents retain importance for sample integrity, but declining per-unit costs and commoditization pressure erode margins. Service providers occupy the middle ground, converting raw reads into actionable nutrition advice, and increasingly bundle virtual coaching to differentiate.
Modular workflow builders allow bench scientists to design pipelines without coding, collapsing development timelines and democratizing experimentation. Multi-tenant architectures support secure collaboration among geographically dispersed clinics, shortening feedback loops between discovery and clinical translation. The resulting ecosystem encourages niche applications, such as microbiome-specific nutrient scoring algorithms, which drive incremental demand for high-quality metadata. As cloud capabilities expand, software’s contribution to the nutrigenomics bioinformatics market share will likely surpass physical consumables, completing the shift from product-led to platform-led value capture.
Note: Segment shares of all individual segments available upon report purchase
By Application: Metabolic Disorders Accelerate Toward Clinical Mainstream
Obesity continues to dominate revenue, yet its 36.92% hold on the nutrigenomics bioinformatics market share is gradually diluted by surging demand for diabetes & metabolic disorder solutions. The latter segment is forecast to post an 10.98% CAGR, indicating that clinicians increasingly deploy genotype-guided diets to complement pharmacologic glycemic control. Cardiovascular and oncology applications maintain steady adoption as companion diagnostics explore nutrient–drug interactions. Anti-aging & wellness remains a consumer-centric niche but serves as a pipeline for early-stage behavioral data that later inform therapeutic programs.
Outcome evidence strengthens payer confidence. The ASPIRE-DNA trial’s 26-week results showed clinically meaningful HbA1c improvements, reinforcing coverage arguments for metabolic panels. Hospital networks now pilot nutrigenomic protocols within endocrinology clinics, integrating dietitian consultations directly into electronic health records. Software vendors respond by embedding decision-support widgets that translate SNP results into recipe-level recommendations aligned with cultural food preferences, thereby increasing adherence. This virtuous cycle between validation and utilization expands the nutrigenomics bioinformatics market size across medical specialties.
By End User: Nutraceutical Innovators Outpace Traditional Stakeholders
Research & academic institutes account for 43.25% of 2025 spending, leveraging grant funding to validate gene–diet pathways. However, nutraceutical and functional-food companies register the highest forward momentum, advancing at an 11.12% CAGR as brand owners reposition formulations around genotype insights. Direct-to-consumer testing firms nurture consumer engagement, while pharmaceutical entities explore nutrigenomics as an adjunct to drug response optimization.
Food manufacturers integrate test-and-recommend services that upsell personalized ingredients at premium price points. Calbee’s Body Granola, for example, links microbiome data to proprietary prebiotic blends that promise sleep and stress benefits. Such initiatives blur the boundary between supplement and snack, transforming consumer packaged goods aisles into data-driven wellness platforms. The nutrigenomics bioinformatics industry thus gains a powerful commercial ally capable of funding large-scale marketing campaigns that raise public awareness.

Recognized by Experts. Trusted by Leaders.
A trusted intelligence partner to global decision-makers across 90+ countries.


By Test Sample: Saliva Collection Reinforces User Convenience
Saliva kits dominate retail channels due to painless home collection and stable DNA yield, preserving user acceptance for mass-market programs. Buccal swabs address scenarios requiring higher human-cell content, while blood draws remain the gold standard for rigorous clinical assays that include metabolic biomarkers. The nutrigenomics bioinformatics market size attributable to saliva-based workflows benefits from streamlined logistics, as ambient-temperature shipping eliminates cold-chain constraints.
Regulatory tightening may spur a bifurcation in sample strategies. Under the FDA’s revised LDT framework, hospital-grade panels could migrate to blood or tissue to satisfy analytical-validity thresholds. Consumer offerings will likely retain non-invasive formats, sustaining acquisition funnels. Vendors invest in microfluidic extraction components that raise saliva-DNA quality, narrowing the performance gap with venous specimens. Ultimately, multi-sample interoperability will enable longitudinal datasets where lifestyle factors are tracked alongside genetic baselines.
Note: Segment shares of all individual segments available upon report purchase
Geography Analysis
North America generated 44.75% of global revenue in 2025, equal to USD 0.27 billion, reflecting mature reimbursement pathways for companion diagnostics and a tech-savvy consumer base. Early adoption of AI-driven analytics within academic medical centers drives continuous algorithm refinement, reinforcing the region’s innovation lead. Federal grants such as the USD 156 million NIH precision nutrition program supply training data that underpin model accuracy. At the same time, the new laboratory-developed-test rule elevates compliance costs, tilting competitive advantage toward well-capitalized firms.
Asia-Pacific is forecast to capture the fastest growth, with an 11.34% CAGR. Government strategies in China and India integrate bio-manufacturing with AI, creating tax incentives for precision nutrition start-ups. High smartphone penetration supports mobile-first genotype reporting, while community-health initiatives translate dietary advice into culturally relevant meal plans. Cost sensitivity remains a hurdle, but local manufacturing of reagents helps narrow price gaps.
Europe occupies a middle position, balancing strict data-privacy mandates with strong public funding for translational nutrition science. The proposed European Health Data Space promises secure cross-border sharing, potentially unlocking multi-country cohort analyses that enhance statistical power. Vendor roadmaps therefore emphasize privacy-preserving analytics that satisfy General Data Protection Regulation requirements. South America and the Middle East & Africa trail in adoption but register double-digit growth as regional research consortia incorporate nutrigenomics modules into non-communicable-disease prevention programs.

Competitive Landscape
Market Concentration
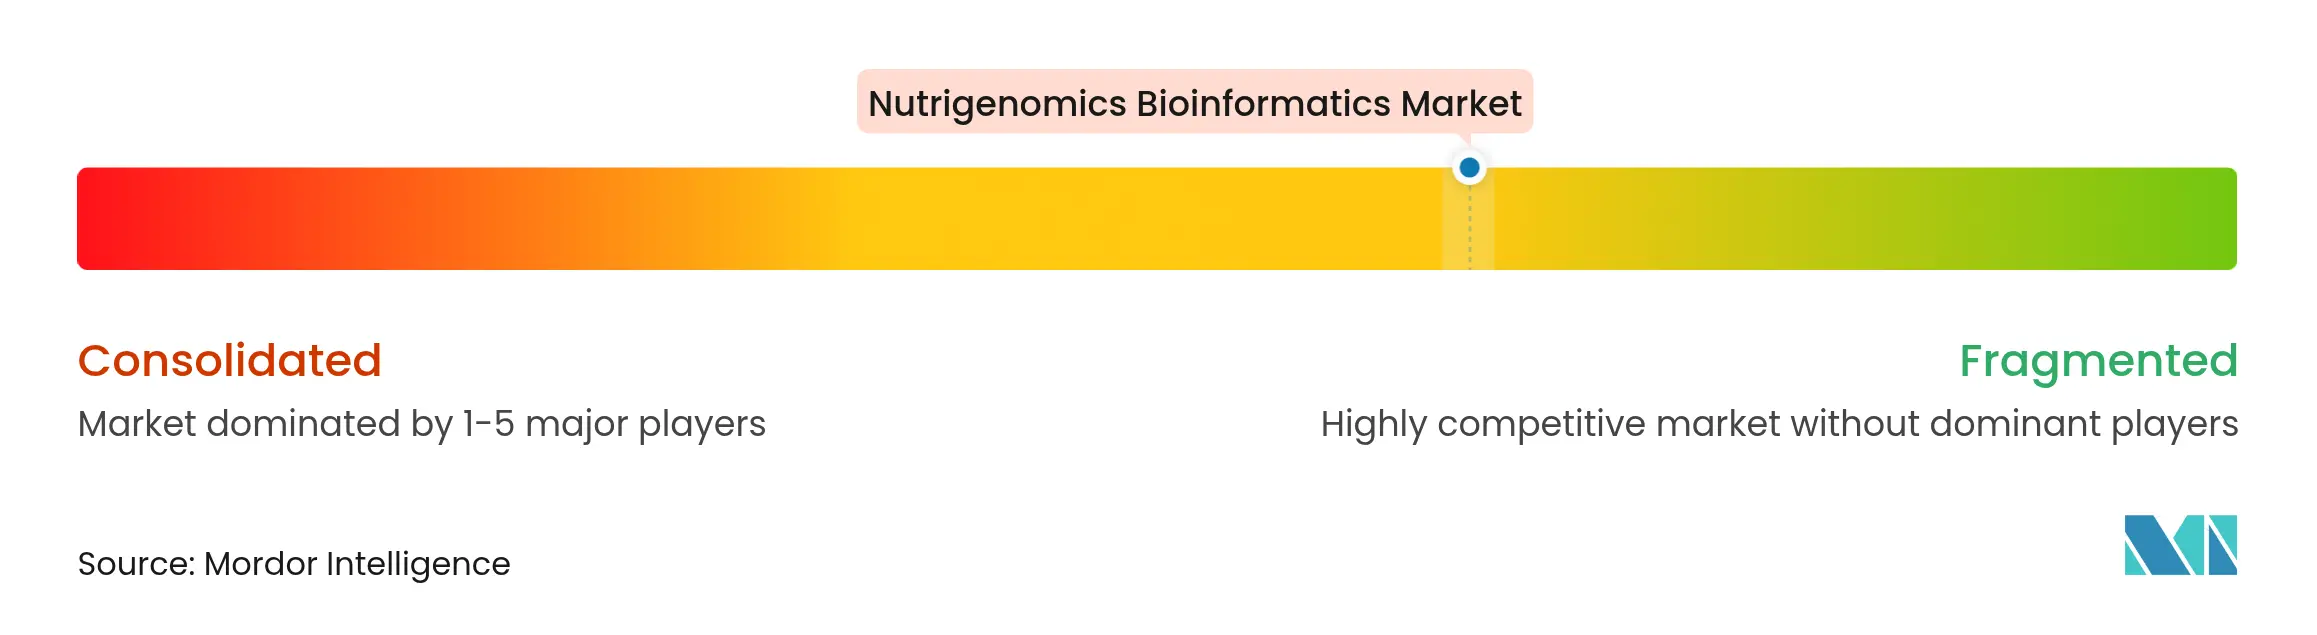
Market structure remains moderately fragmented, yet consolidation is accelerating as deep-pocketed pharmaceutical and instrumentation companies acquire specialized platforms to secure data assets. Regeneron’s USD 256 million purchase of 23andMe’s services exemplifies vertical integration, granting drug developers privileged access to 15 million genotypes for target discovery. Thermo Fisher’s pending USD 3 billion acquisition of Olink extends its multi-omics toolkit, positioning for bundled service offerings that cover proteomics and genomics in a single workflow.
Software-centric entrants challenge incumbents by abstracting laboratory complexity behind drag-and-drop interfaces. Almaden Genomics illustrates this shift, enabling life-science customers to design pipelines without bioinformatics specialists, thereby reducing development costs and speeding iteration cycles. Competitive advantage is migrating from throughput capacity to data-interpretation finesse. Intellectual-property filings reveal a surge in AI-powered nutrient-recommendation engines, suggesting future skirmishes will focus on algorithm transparency and clinical-decision support certification.
Partnership models proliferate as stakeholders recognize the value of ecosystem collaboration. Amway’s alliance with HEM Pharma leverages 95,000 microbiome samples to create probiotic SKUs customized to regional gut-flora profiles. Such cross-sector linkages expand distribution reach and diversify revenue streams. Despite consolidation trends, barrier-to-entry erosion from cloud computing invites nimble specialists to capture niches, sustaining a dynamic competitive environment within the nutrigenomics bioinformatics market.
Nutrigenomics Bioinformatics Industry Leaders

*Disclaimer: Major Players sorted in no particular order
Recent Industry Developments
- May 2025: Regeneron Pharmaceuticals acquired 23andMe’s assets for USD 256 million, securing a 15-million-profile genetic database for drug discovery
- January 2024: GenoPalate and Earth Fare launched in-store QR-code nutrition guides based on genetic profiles
Table of Contents for Nutrigenomics Bioinformatics Industry Report
1. Introduction
- 1.1Study Assumptions & Market Definition •
- 1.2Scope of the Study
2. Research Methodology
3. Executive Summary
4. Market Landscape
- 4.1Market Overview
- 4.2Market Drivers
- 4.2.1Rising uptake of cloud-native bioinformatics platforms
- 4.2.2Mainstream adoption of direct-to-consumer (DTC) nutrigenomic tests
- 4.2.3Integration of AI/ML for multi-omics data interpretation (under-the-radar)
- 4.2.4Clinical guidelines endorsing gene-based nutrition for obesity care
- 4.2.5Emergence of microbiome-nutrigenomic co-analysis services (under-the-radar)
- 4.2.6Government precision-nutrition pilots in China & India (under-the-radar)
- 4.3Market Restraints
- 4.3.1High cost & low reimbursement for gene-based diet tests
- 4.3.2Data-privacy concerns over nutrigenomic datasets
- 4.3.3Scarcity of validated gene-diet clinical trials (under-the-radar)
- 4.3.4Fragmented regulatory oversight on DTC tests (under-the-radar)
- 4.4Value / Supply-Chain Analysis
- 4.5Regulatory Landscape
- 4.6Technological Outlook
- 4.7Porter’s Five Forces
- 4.7.1Threat of New Entrants
- 4.7.2Bargaining Power of Suppliers
- 4.7.3Bargaining Power of Buyers
- 4.7.4Threat of Substitutes
- 4.7.5Competitive Rivalry
5. Market Size & Growth Forecasts (Value, 2022-2030)
- 5.1By Component
- 5.1.1Software Platforms
- 5.1.2Reagents and Kits
- 5.1.3Services
- 5.2By Application
- 5.2.1Obesity
- 5.2.2Cardiovascular Diseases
- 5.2.3Cancer Research
- 5.2.4Diabetes & Metabolic Disorders
- 5.2.5Anti-Aging & Wellness
- 5.3By End User
- 5.3.1Research & Academic Institutes
- 5.3.2Pharmaceutical & Biotech Companies
- 5.3.3Nutraceutical / Functional-Food Companies
- 5.3.4Direct-to-Consumer Testing Companies
- 5.4By Test Sample
- 5.4.1Saliva
- 5.4.2Buccal Swab
- 5.4.3Blood
- 5.5By Geography
- 5.5.1North America
- 5.5.1.1United States
- 5.5.1.2Canada
- 5.5.1.3Mexico
- 5.5.2Europe
- 5.5.2.1Germany
- 5.5.2.2United Kingdom
- 5.5.2.3France
- 5.5.2.4Italy
- 5.5.2.5Spain
- 5.5.2.6Rest of Europe
- 5.5.3Asia-Pacific
- 5.5.3.1China
- 5.5.3.2India
- 5.5.3.3Japan
- 5.5.3.4South Korea
- 5.5.3.5Australia
- 5.5.3.6Rest of Asia-Pacific
- 5.5.4South America
- 5.5.4.1Brazil
- 5.5.4.2Argentina
- 5.5.4.3Rest of South America
- 5.5.5Middle East and Africa
- 5.5.5.1GCC
- 5.5.5.2South Africa
- 5.5.5.3Rest of Middle East and Africa
6. Competitive Landscape
- 6.1Market Concentration
- 6.2Market Share Analysis
- 6.3Company Profiles (includes Global level Overview, Market level overview, Core Segments, Financials as available, Strategic Information, Market Rank/Share for key companies, Products & Services, and Recent Developments)
- 6.3.1Illumina Inc.
- 6.3.2Thermo Fisher Scientific Inc.
- 6.3.3Agilent Technologies Inc.
- 6.3.4Danaher Corp. (Integrated DNA Technologies & Cytiva)
- 6.3.5BASF SE
- 6.3.6Koninklijke DSM-Firmenich N.V.
- 6.3.7Qiagen N.V.
- 6.3.8DNAnexus Inc.
- 6.3.9Nutrigenomix Inc.
- 6.3.103X4 Genetics Ltd.
- 6.3.11WellGen Inc.
- 6.3.12Genova Diagnostics Inc.
- 6.3.1323andMe Holding Co.
- 6.3.14GeneSmart Pty Ltd.
- 6.3.15Microba Life Sciences Ltd.
- 6.3.16Centogene N.V.
- 6.3.17Helix OpCo LLC
- 6.3.18DayTwo Ltd.
7. Market Opportunities & Future Outlook
- 7.1White-space & unmet-need assessment
Global Nutrigenomics Bioinformatics Market Report Scope
As per the scope of the report, nutrigenomics bioinformatics is an interdisciplinary field that combines nutritional science, genomics, and bioinformatics to study how an individual’s genetic makeup influences their response to nutrients and how nutrients, in turn, affect gene expression. The goal is to develop personalized dietary recommendations that optimize health and prevent diseases based on genetic information. The nutrigenomic bioinformatics market is segmented into application, product, and geography. By application, the market is segmented into obesity, cardiovascular diseases, oncology, and others. By product, the market is segmented into reagents and kits, software, and services. By geography, the market is segmented into North America, Europe, Asia-Pacific, Rest of the World. The report offers values (in USD) for the above segments.