Market Overview
| Study Period | 2020 - 2031 |
|---|---|
| Forecast Data Period | 2026 - 2031 |
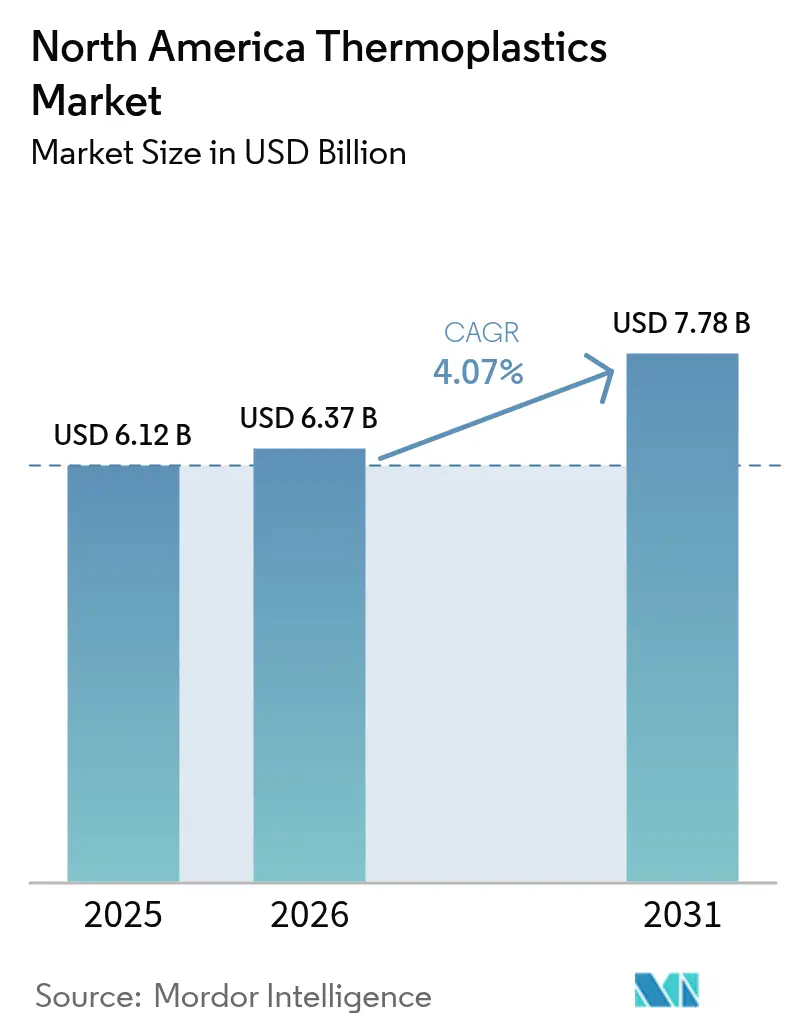
| Base Year Market Size (2025) | USD 6.12 Billion |
| Market Size (2026) | USD 6.37 Billion |
| Market Size (2031) | USD 7.78 Billion |
| Growth Rate (2026 - 2031) | 4.07% CAGR |
| Market Concentration | Medium |
Major Players *Disclaimer: Major Players sorted in no particular order Image © Mordor Intelligence. Reuse requires attribution under CC BY 4.0. | |
North America Thermoplastics Market Analysis by Mordor Intelligence
North America thermoplastics market size in 2026 is estimated at USD 6.37 billion, growing from 2025 value of USD 6.12 billion with 2031 projections showing USD 7.78 billion, growing at 4.07% CAGR over 2026-2031. Momentum is steady, yet structural forces are reshaping supply chains. Passenger-vehicle electrification is driving the use of engineered resins in under-hood parts, state laws are mandating higher recycled content in packaging, and processors are relocating molding assets to Mexico to capitalize on tariff relief and lower labor costs. Producers with Gulf Coast crackers continue to monetize cost-advantaged ethane streams, while brand owners pursue chemically recycled feedstocks to meet circularity pledges. Capacity additions in high-performance polymers outpace those in commodity polymers, as aerospace and semiconductor customers specify materials that can withstand harsher thermal and dielectric demands. Competitive dynamics now favor vertically integrated suppliers that can lock in long-term offtake agreements and insulate margins from feedstock swings.
Key Report Takeaways
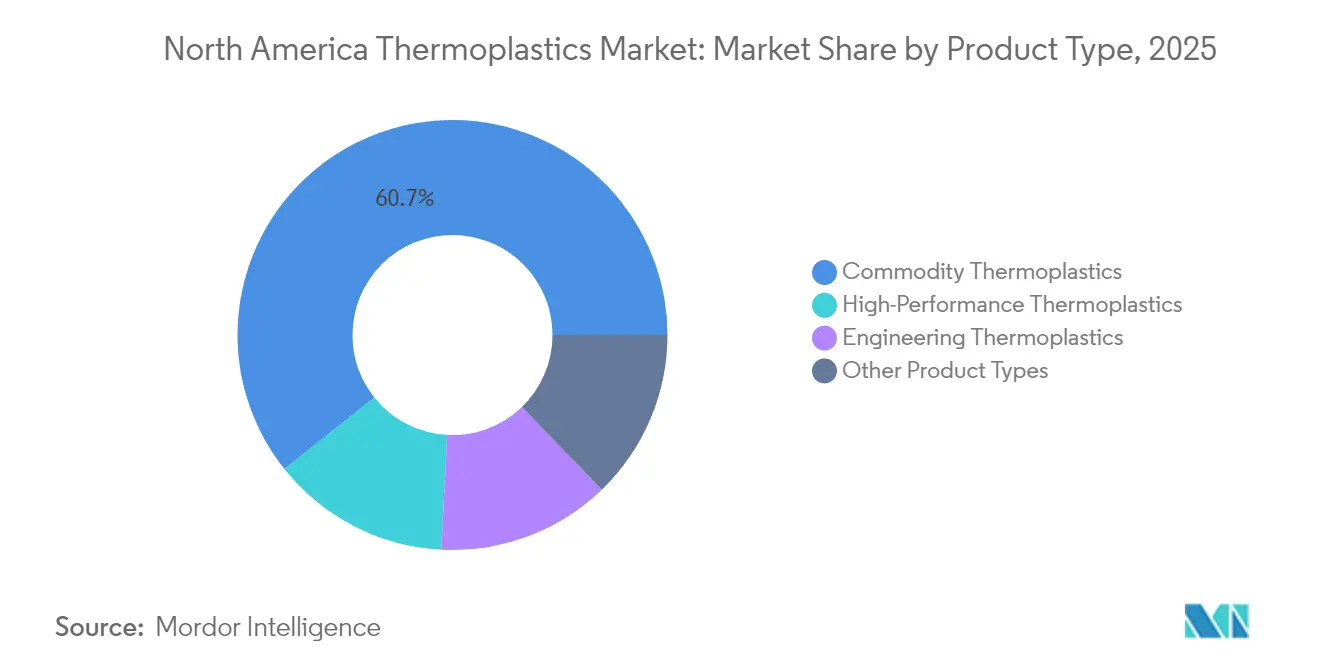
- By product type, commodity thermoplastics accounted for 60.72% of the North American thermoplastics market share in 2025. High-performance thermoplastics are advancing at a 5.96% CAGR through 2031.
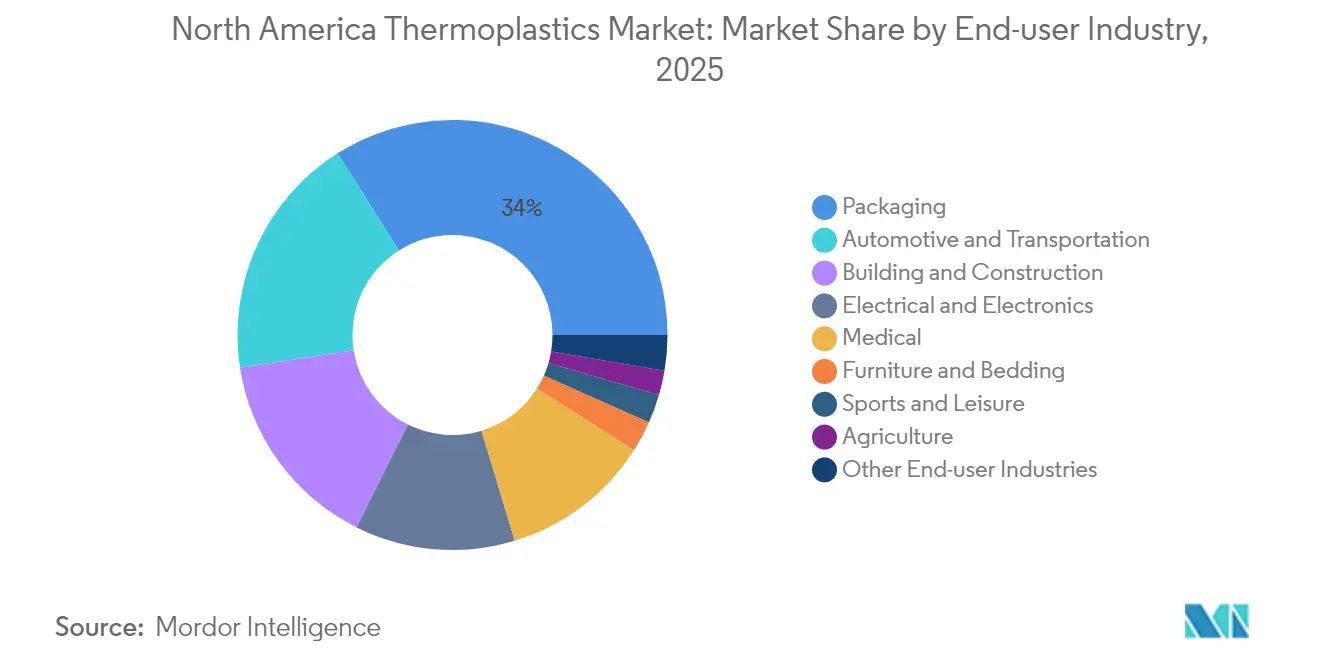
- By end-user industry, packaging captured 33.98% revenue in 2025; medical devices are set to expand at a 5.89% CAGR over the same horizon.
- By geography, the United States accounted for 71.86% of 2025 revenue and is expected to grow at a 5.57% CAGR through 2031.
Note: Market size and forecast figures in this report are generated using Mordor Intelligence’s proprietary estimation framework, updated with the latest available data and insights as of 2026.
North America Thermoplastics Market Trends and Insights
Drivers Impact Analysis*
| Drivers | (~) % Impact on CAGR Forecast | Geographic Relevance | Impact Timeline |
|---|---|---|---|
| Surging demand for lightweight electric-vehicle components | +1.2% | United States and Canada, with spillover into Mexican assembly corridors | Medium term (2–4 years) |
| Mandatory post-consumer-recycled-content mandates | +0.9% | United States, led by California, Oregon, Colorado, and Maine | Short term (≤ 2 years) |
| Re-shoring of plastics conversion capacity to Mexico | +0.7% | Mexico plants supplying regional automotive and consumer-goods chains | Medium term (2–4 years) |
| Chemical-recycling investments securing circular feedstock | +0.6% | U.S. Gulf Coast with early pilots in Canada | Long term (≥ 4 years) |
| AI-enabled process control cutting scrap rates | +0.4% | Major molding clusters across the United States, Canada, and Mexico | Short to medium term (≤ 4 years) |
| Source: Mordor Intelligence | |||
Surging Demand for Lightweight Electric Vehicle Components
Battery-electric platforms require 10–15% curb-weight reductions to extend the single-charge range beyond 300 miles. Polyamide 6.6 and polyphthalamide are now replacing aluminum in brackets, battery housings, and thermal management parts because these resins can endure continuous service at 150 °C while delivering a 40% mass savings[1]BASF, “High-Temperature Polyamides for E-Mobility,” basf.com. SABIC’s long-fiber polypropylene composite underpins General Motors’ Ultium battery tray, providing stiffness previously reserved for stamped steel. A 2024 SAE technical paper quantified that swapping 50 kg of metal for engineering plastics extends range by 8–12 km per charge. Automakers Ford and Stellantis now qualify resin grades during concept design, accelerating adoption and concentrating volume among suppliers with North American compounding lines.
Mandatory Post-Consumer-Recycled-Content Mandates Across U.S. States
California, Oregon, Colorado, and Maine enacted laws requiring all plastic packaging to meet specific recycling rates, effectively creating a nationwide floor because brand owners avoid SKU complexity. Berry Global budgeted USD 65 million in 2024 for optical-sorting upgrades that isolate multilayer films into food-grade polyethylene streams. Amcor pledged to reach 30% recycled content across its North American flexible packaging by 2025, requiring annual intake of 120,000 t of certified PCR resin. PCR polyethylene still commands USD 200–400 per-ton premiums over virgin resin, a delta that narrows only when Brent crude exceeds USD 90 bbl.
Re-shoring of Plastics Conversion Capacity to Mexico
The USMCA grants tariff-free status to molded parts that meet 75% regional-content rules, and hourly wages near USD 4.50 in Guanajuato and Nuevo León entice Tier 1 suppliers to relocate their injection-molding cells. Flex-N-Gate, Magna, and Lear now place presses within 50 km of final-assembly plants, slashing delivery lead times to 48 hours. Mexican output already accounts for a growing share of U.S. automotive components as OEMs electrify their pickup and SUV lines, driving demand for engineering thermoplastics over commodity resins.
Chemical-Recycling Investments Securing Circular Feedstock
Eastman doubled its Longview, Texas, polyester-from-waste capacity to 200,000 tons per year with a USD 375 million investment in 2024. Brightmark is constructing a USD 950 million renewable plant in Thomaston, Georgia, to process 400,000 tons per year of PE and PP into synthetic crude for monomer recovery. Cyclyx opened a USD 135 million feedstock aggregation hub in Fort Worth, Texas, partnering with ExxonMobil to channel contaminated plastics into advanced recyclers. Brand owners Procter & Gamble and Unilever signed multi-year take-or-pay contracts for chemically recycled polyethylene, insulating sustainability budgets from the volatility of virgin resin.
Restraints Impact Analysis*
| Restraints | (~) % Impact on CAGR Forecast | Geographic Relevance | Impact Timeline |
|---|---|---|---|
| Volatile ethane and naphtha feedstock prices | -0.8% | United States Gulf Coast and Alberta crackers | Short term (≤ 2 years) |
| Escalating extended-producer-responsibility fees | -0.5% | U.S. states with active EPR statutes | Medium term (2–4 years) |
| Skilled-labor shortages in high-precision molding | -0.6% | High-precision molding clusters in the United States and Mexico | Medium term (2–4 years) |
| Source: Mordor Intelligence | |||
Volatile Ethane and Naphtha Feedstock Prices
Ethane at Mont Belvieu fluctuated between USD 0.18 and USD 0.32 per gallon in 2024 due to shifts in associated-gas supply[2]U.S. Energy Information Administration, “Natural Gas Liquids Pricing,” eia.gov. Naphtha-tracked crude prices rose, squeezing margins for merchant crackers in Canada that rely on external feedstocks. Integrated giants Dow, Chevron Phillips, and ExxonMobil sheltered spreads with captive ethane. Volatility drives converters to quarterly rather than annual resin contracts, transferring risk downstream and deterring greenfield cracker commitments that need 15-year paybacks.
Escalating Extended-Producer-Responsibility Fees
Oregon’s Recycling Modernization Act adds an estimated USD 80 million in annual compliance costs that are funnel into producer-responsibility organizations. Some converters absorb these levies to maintain shelf pricing, while others shift to mono-material structures that raise recyclability scores but compromise barrier performance. Scale players such as Amcor and Berry Global amortize fees across national networks, widening the cost gap with mid-tier processors.
*Our forecasts treat driver/restraint impacts as directional, not additive. The impact forecasts reflect baseline growth, mix effects, and variable interactions.
Segment Analysis
By Product Type: High-Performance Polymers Outpace Commodity Volume
Commodity-grade thermoplastics held 60.72 % of the North America thermoplastics market share in 2025. Polyethylene dominates due to its broad film and pipe applications, while polypropylene grows in automotive interiors and hygiene non-wovens because of a 10% density edge that reduces weight. Polyvinyl chloride remains entrenched in building pipe, though scrutiny over chlorine chemistries prompts some municipalities to favor polyethylene. Polystyrene faces bans on single-use packaging, dampening demand.
Engineering polymers fill the middle tier, serving under-hood parts, connectors, and appliance housings. They fetch 30–50% premiums over commodity grades thanks to improved heat and impact resistance. High-performance thermoplastics are the fastest risers, with a 5.96% CAGR, driven by the aerospace, semiconductor, and medical segments. Polyether ether ketone, liquid-crystal polymer, and polyimide withstand continuous service temperatures of≥200 °C and maintain dimensional precision under cycling loads. Producers with regional compounding lines secure faster adoption because OEMs insist on local supply continuity.


By End-User Industry: Medical Devices Accelerate as Packaging Matures
Packaging accounted for 33.98% of the 2025 demand. Flexible snack-film and stand-up pouches represent the bulk, while rigid bottles and e-commerce cushioning round out the category. Legislative PCR targets are prompting converters to retrofit their lines for higher recycled content, marginally tempering the growth of virgin resin.
Medical devices are projected to expand at a rate of 5.89% annually through 2031. Single-use surgical tools, drug-delivery systems, and implantable polyamides that meet ISO 10993 biocompatibility standards underpin the rise. Specialized molders with FDA-registered cleanrooms capture disproportionate value, sustaining double-digit operating margins. The automotive industry accounts for a sizable volume, as battery enclosures, body panels, and interior trim trade metal for plastics to meet corporate average fuel economy targets. Electrical and electronics remain a steady buyer of UL 94-rated resins, with the rollout of 5G driving demand for liquid-crystal polymer in high-frequency connectors. Sports, furniture, agriculture, and niche industrial uses collectively contribute 9% of consumption, serving items ranging from synthetic turf to drip irrigation tubing.
Geography Analysis
The United States led with 71.86% of regional revenue in 2025 and is expected to post a 5.57% CAGR through 2031, driven by its Gulf Coast feedstock advantage and USD 1.2 billion of announced chemical-recycling projects. Dow’s Freeport cracker recently added 600,000 t yr of polyethylene capacity aimed at converters chasing PCR mandates. The EPA proposal to list certain PFAS-containing fluoropolymers under CERCLA introduces regulatory headwinds for PTFE suppliers, prompting some aerospace OEMs to pre-qualify non-fluorinated alternatives. Packaging remains the largest domestic outlet, but medical devices are capturing incremental share as single-use instruments gain hospital acceptance.
Mexico is evolving into a molding hub, absorbing conversion work for the automotive, electronics, and consumer goods industries. USMCA guarantees duty-free status for compliant parts, and labor costs roughly one-third of U.S. levels, drawing investment to Guanajuato and Nuevo León. Flex-N-Gate and Magna co-locate presses adjacent to EV assembly lines, enabling just-in-sequence delivery and compressing inventory buffers. Engineering thermoplastics benefit the most as OEMs chase lightweighting gains across new electric platforms. Canada contributes a smaller portion yet retains strategic importance through integrated ethane-fed crackers in Alberta and an automotive corridor in Ontario. NOVA Chemicals supplies polyethylene to regional film and pipe extruders through two Alberta crackers. Ontario’s auto cluster integrates polypropylene-glass composites into electric-truck chassis; Magna trialed a tailgate that meets crash ratings while trimming 35% weight. A 2024 federal ban on certain single-use plastics redirects polyethylene and polystyrene toward industrial applications.
Competitive Landscape
The North America thermoplastics market is moderately fragmented. The top five producers, including LyondellBasell and Dow, command significant polyolefin capacity, while the engineering and high-performance segments remain fractured across 15–20 specialty suppliers. Integrated majors exploit captive ethane and propylene streams to undercut merchant crackers during price spikes, as evidenced by ethane surpassing USD 0.30/gal in Q2 2024. Specialty players embed design-engineering teams inside OEM centers, locking in resin grades before tooling and securing margin insulation. Smaller innovators enter joint ventures with brand owners to secure feedstock and bypass commodity sales. Their closed-loop agreements sidestep traditional distributors and may pressure spot-resin liquidity over time.
North America Thermoplastics Industry Leaders
Dow
LyondellBasell
Exxon Mobil Corporation
BASF
INEOS
- *Disclaimer: Major Players sorted in no particular order

Recent Industry Developments
- February 2025: Dow committed USD 500 million to expand its Freeport, Texas, polyethylene complex by 300,000 t yr and added an on-site line that will recycle 50,000 t yr of post-use film into food-contact resin.
- January 2025: SABIC and ExxonMobil agreed to co-develop certified circular polyethylene sourced from plastic waste processed at ExxonMobil’s Baytown advanced recycling unit.


North America Thermoplastics Market Report Scope
By Product Type
| Commodity Thermoplastics | Polyethylene (PE) |
| Polypropylene (PP) | |
| Polyvinyl Chloride (PVC) | |
| Polystyrene (PS) | |
| Engineering Thermoplastics | Polyamide (PA) |
| Polycarbonate (PC) | |
| Polymethyl Methacrylate (PMMA) | |
| Polyoxymethylene (POM) | |
| Polyethylene Terephthalate (PET) | |
| Polybutylene Terephthalate (PBT) | |
| Acrylonitrile-Butadiene-Styrene (ABS) / SAN | |
| High-Performance Thermoplastics | Polyether Ether Ketone (PEEK) |
| Liquid Crystal Polymer (LCP) | |
| Polytetrafluoroethylene (PTFE) | |
| Polyimide (PI) | |
| Other Product Types (PPE, PSU, PEI, PPS, ETFE, PFA, FEP, PBI) |
By End-user Industry
| Packaging |
| Building and Construction |
| Automotive and Transportation |
| Electrical and Electronics |
| Sports and Leisure |
| Furniture and Bedding |
| Agriculture |
| Medical |
| Other End-user Industries |
Geography
| United States |
| Canada |
| Mexico |
| By Product Type | Commodity Thermoplastics | Polyethylene (PE) |
| Polypropylene (PP) | ||
| Polyvinyl Chloride (PVC) | ||
| Polystyrene (PS) | ||
| Engineering Thermoplastics | Polyamide (PA) | |
| Polycarbonate (PC) | ||
| Polymethyl Methacrylate (PMMA) | ||
| Polyoxymethylene (POM) | ||
| Polyethylene Terephthalate (PET) | ||
| Polybutylene Terephthalate (PBT) | ||
| Acrylonitrile-Butadiene-Styrene (ABS) / SAN | ||
| High-Performance Thermoplastics | Polyether Ether Ketone (PEEK) | |
| Liquid Crystal Polymer (LCP) | ||
| Polytetrafluoroethylene (PTFE) | ||
| Polyimide (PI) | ||
| Other Product Types (PPE, PSU, PEI, PPS, ETFE, PFA, FEP, PBI) | ||
| By End-user Industry | Packaging | |
| Building and Construction | ||
| Automotive and Transportation | ||
| Electrical and Electronics | ||
| Sports and Leisure | ||
| Furniture and Bedding | ||
| Agriculture | ||
| Medical | ||
| Other End-user Industries | ||
| Geography | United States | |
| Canada | ||
| Mexico | ||


Key Questions Answered in the Report
What is the current revenue value for the North America thermoplastics market?
The North America thermoplastics market is estimated at USD 6.37 billion in 2026, a path to reach USD 7.78 billion by 2031.
Which product category is growing fastest?
High-performance thermoplastics are projected to lead with a 5.96% CAGR to 2031, driven by demand from aerospace, semiconductor, and medical customers.
How significant is the United States in regional consumption?
The country accounts for 71.86% of the revenue and is projected to grow at a rate of 5.57% through 2031.
What regulatory trend drives demand for recycled resin?
State laws, such as California’s SB 54, mandate a 30% PCR in plastic packaging by 2030, prompting converters to secure chemically or mechanically recycled feedstocks.
Which end-user industry shows the highest growth rate?
Medical devices are projected to post a 5.89% CAGR through 2031, driven by the adoption of single-use surgical tools and implantable thermoplastic components.
How are major producers responding to circularity goals?
Firms like Eastman, Dow, and ExxonMobil are adding molecular- and pyrolysis-recycling capacity and signing long-term offtake agreements with brand owners.
Page last updated on:


