North America Sports Teams And Clubs Market Size and Share
Market Overview
| Study Period | 2020 - 2031 |
|---|---|
| Forecast Data Period | 2026 - 2031 |
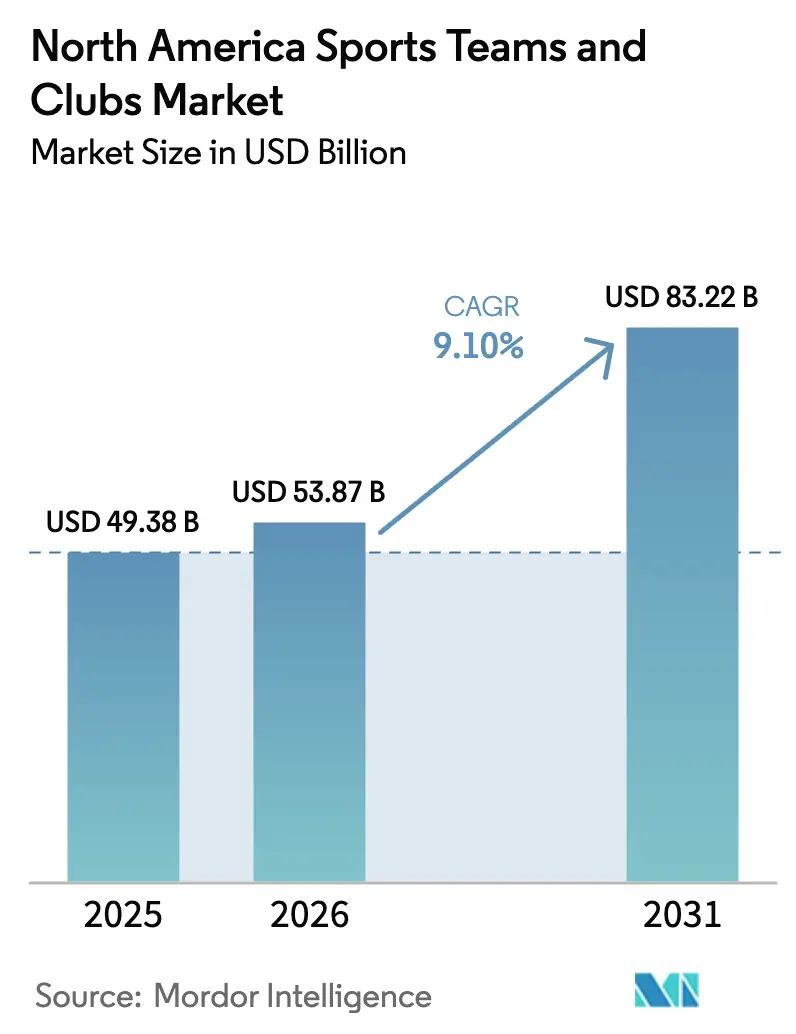
| Base Year Market Size (2025) | USD 49.38 Billion |
| Market Size (2026) | USD 53.87 Billion |
| Market Size (2031) | USD 83.22 Billion |
| Growth Rate (2026 - 2031) | 9.10% CAGR |
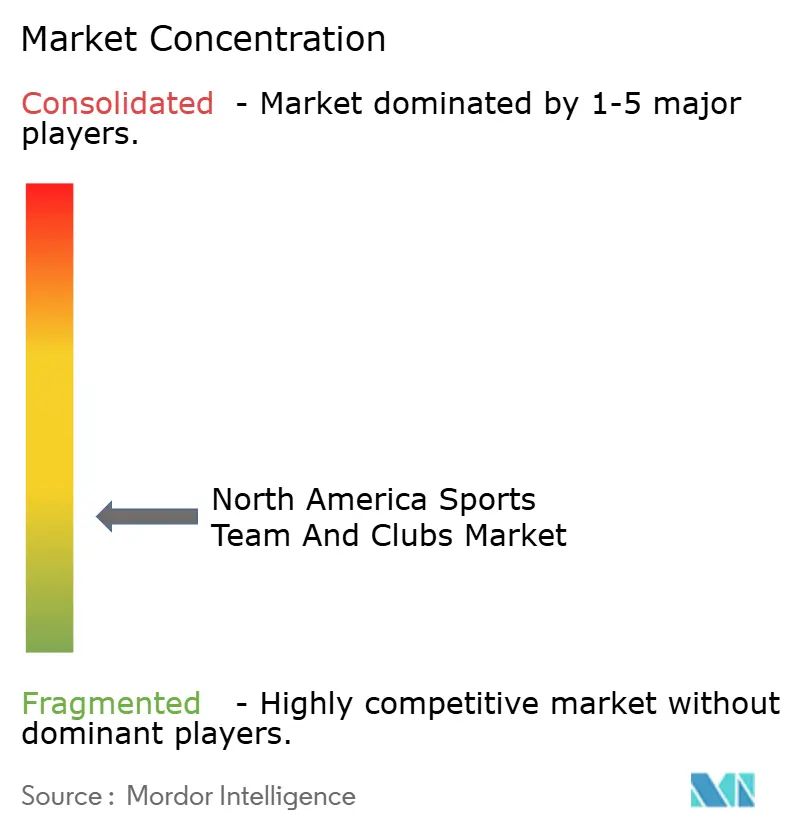
| Market Concentration | Low |
Major Players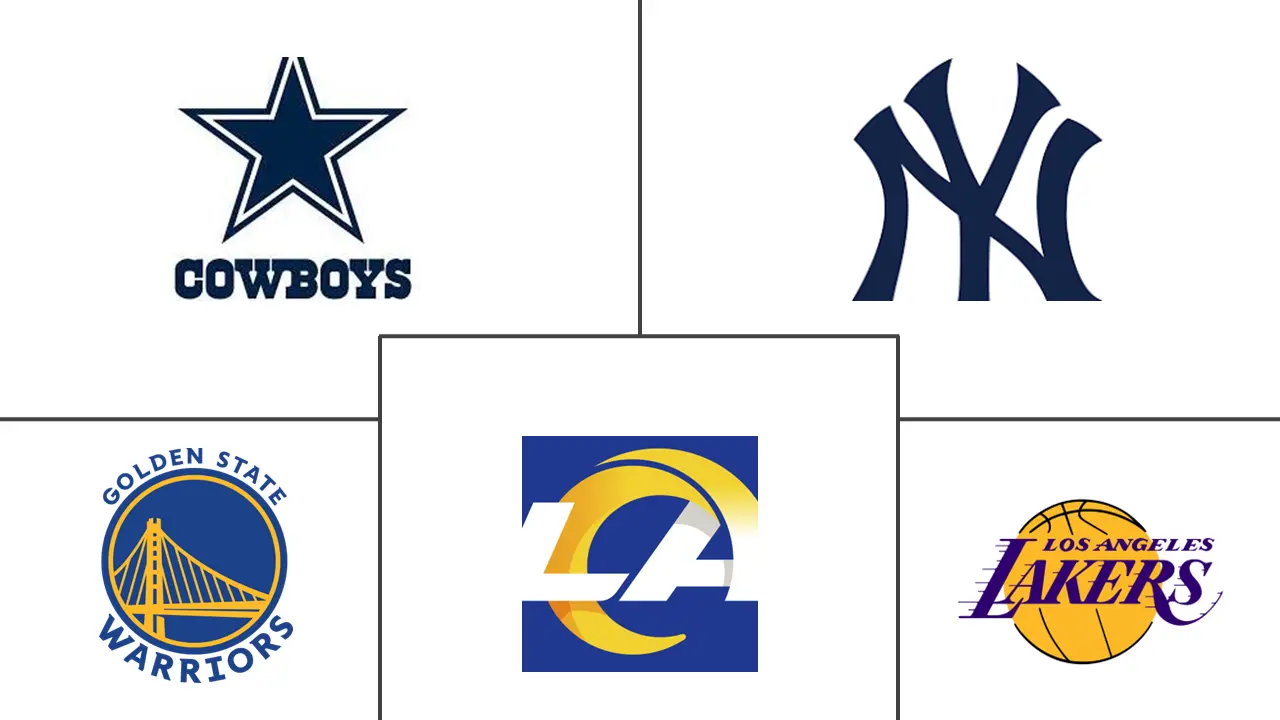 *Disclaimer: Major Players sorted in no particular order Image © Mordor Intelligence. Reuse requires attribution under CC BY 4.0. | |
North America Sports Teams And Clubs Market Analysis by Mordor Intelligence
The North America Sports Teams And Clubs Market size was valued at USD 49.38 billion in 2025 and estimated to grow from USD 53.87 billion in 2026 to reach USD 83.22 billion by 2031, at a CAGR of 9.10% during the forecast period (2026-2031).
Strong pricing power in media-rights renewals, rapid legalization of sports betting, and rising private-equity inflows add momentum to franchise valuations. Digital transformation is opening fresh ancillary revenue streams while professional women’s leagues broaden the total addressable fan base. These fundamentals make the North America sports teams and clubs market a resilient, cash-flow-generating asset class that attracts institutional investors during economic turbulence. The market is also benefiting from tax-advantaged stadium financing that underpins long-term lease security and keeps operating risk comparatively low.
Key Report Takeaways
- By sport type, American football held 42.15% of the North America sports teams and clubs market share in 2025, whereas emerging sports such as esports, lacrosse, and rugby are forecast to expand at an 11.05% CAGR through 2031.
- By revenue source, media rights commanded 46.55% of the North America sports teams and clubs market size in 2025; ancillary digital streams are growing fastest at a 11.65% CAGR to 2031.
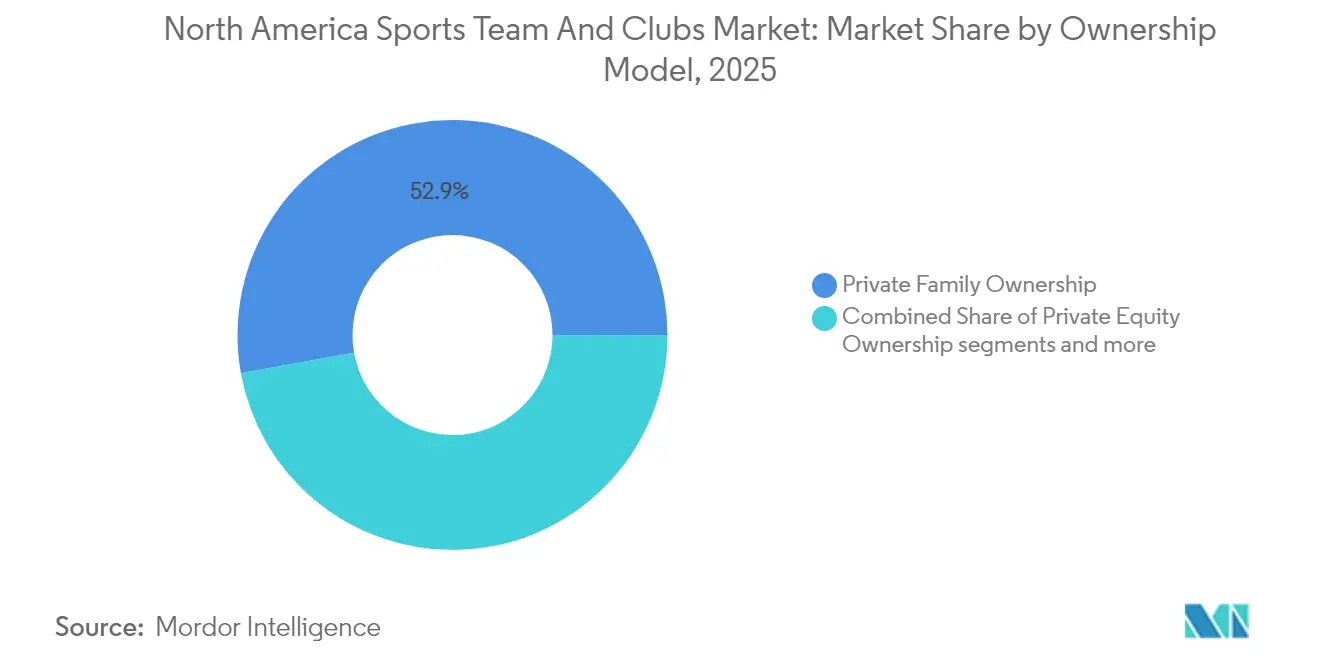
- By ownership model, private family structures still controlled 52.85% of the franchise value of the North America sports teams and clubs market in 2025, while private-equity stakes are increasing at a 12.85% CAGR.
- By country, the United States contributed 88.70% of the 2025 revenue of the North America sports teams and clubs market; Canada is the quickest grower at a 10.05% CAGR thanks to WNBA and NHL expansion.
Note: Market size and forecast figures in this report are generated using Mordor Intelligence’s proprietary estimation framework, updated with the latest available data and insights as of 2026.
Proportional positioning is established by comparing regional contributions against the global total, including that of North america. The sports team and clubs market share in our global report expresses these relative weights.
North America Sports Teams And Clubs Market Trends and Insights
Drivers Impact Analysis*
| Driver | (~) % Impact on CAGR Forecast | Geographic Relevance | Impact Timeline |
|---|---|---|---|
| Surging media-rights valuations | +2.8% | North America, with spillover to Mexico | Medium term (2-4 years) |
| Accelerated legalization of sports betting | +1.9% | United States primarily, expanding to Canada | Short term (≤ 2 years) |
| Sponsorship & partnership revenue expansion | +1.6% | Global, concentrated in major metropolitan areas | Medium term (2-4 years) |
| Digital fan-engagement & DTC streaming uptake | +1.4% | North America, with early adoption in urban centers | Long term (≥ 4 years) |
| Emergence of women's professional leagues | +1.2% | United States and Canada, expanding internationally | Long term (≥ 4 years) |
| Private-equity ownership inflating club valuations | +0.9% | North America, with focus on major market franchises | Medium term (2-4 years) |
| Source: Mordor Intelligence | |||
Surging Media-Rights Valuations
Media-rights packages remain the primary economic engine for the North America sports teams and clubs market. The NBA’s USD 76 billion deal with Disney, NBCUniversal, and Amazon represents a significant step-up over the prior cycle and shows digital streamers’ willingness to pay a premium for live sports [1]Kevin Draper, “N.B.A. Strikes $76 Billion Media Deal With Disney, NBCUniversal and Amazon,” The New York Times, nytimes.com . The NFL’s USD 111 billion contract running to 2033 embeds opt-out clauses that allow the league to renegotiate as streaming penetration rises. Teams reclaiming local rights from distressed regional sports networks are partnering directly with platforms such as YouTube TV, capturing larger economics per subscriber. Rights fragmentation across linear and digital outlets expands ad inventory but forces fans to juggle multiple subscriptions. Leagues are therefore experimenting with flexible packaging to maintain reach while maximizing rights fees.
Accelerated Legalization of Sports Betting
Thirty-eight states and Washington, DC generated USD 13.71 billion in legal sports-betting revenue in 2025, a 25.40% rise from 2024 [2]Mike McCarthy, “Sports Betting Revenue Jumps 25% Year-on-Year,” Front Office Sports, frontofficesports.com . Official data deals, on-site sportsbooks, and branded betting content allow clubs to monetize this upside without assuming direct gambling risk. Increased state tax revenues enhance the economic rationale for sustained regulatory growth. Leagues integrate betting graphics into live broadcasts to deepen engagement, though they must police integrity and responsible-gaming standards. Analysts project the annual betting handle could reach USD 45 billion as mobile adoption matures. Early-mover teams that embed betting touchpoints in mobile apps gain an analytics edge for targeted marketing.
Sponsorship & Partnership Revenue Expansion
Brands view live sports as a hedge against fragmented consumer attention. NFL sponsorship revenue climbed 6% to USD 2.49 billion in 2024 [3]Adam Nelson, “XFL and USFL Complete Merger to Form UFL,” SportsPro Media, sportspro.com . Capital inflows were primarily directed toward the cryptocurrency, construction, and technology sectors, reflecting strategic efforts to enhance global brand positioning. While average franchises secured standard sponsorship revenues, elite clubs leveraged exclusivity tiers to achieve significantly higher financial outcomes. Women's sports properties, including WNBA franchises, have secured seven-figure inaugural jersey deals, validating commercial demand. Rising sponsor appetite reduces dependence on ticket sales and cushions economic swings.
Digital Fan-Engagement & DTC Streaming Uptake
More than 90 million American viewers will stream sports monthly in 2025, up 58% from 2021. Teams like the Dallas Stars that abandon fixed regional-network payments for direct-to-consumer models expect higher lifetime value per fan and richer data on viewing habits. ESPN’s 2025 launch of a USD 25-30 monthly flagship service illustrates the premium fans are willing to pay for consolidated access. Younger cohorts favor interactive overlays, chat, and real-time stats, driving investment in AI personalization. Short-term revenue risk exists as clubs shift from guaranteed rights fees to ad-supported streaming, yet early adopters target higher margins over time.
Restraints Impact Analysis*
| Restraint | (~)% Impact on CAGR Forecast | Geographic Relevance | Impact Timeline |
|---|---|---|---|
| Escalating player-salary inflation | -1.8% | North America, concentrated in major leagues | Short term (≤ 2 years) |
| Saturation of the domestic broadcast landscape | -1.2% | The United States primarily, affecting traditional media | Medium term (2-4 years) |
| Gen-Z attention fragmentation | -0.9% | North America, urban markets are most affected | Long term (≥ 4 years) |
| ESG scrutiny on stadium financing models | -0.7% | United States and Canada, municipal markets | Medium term (2-4 years) |
| Source: Mordor Intelligence | |||
Escalating Player-Salary Inflation
The NBA salary cap is projected to increase to USD 140.6 million for the 2024-25 season, with league executives anticipating a corresponding rise in player contract values aligned with the current media rights cycle. MLB set a new benchmark when Juan Soto signed a USD 765 million deal, signaling accelerating labour costs across sports. Because salaries typically consume 50-60% of team revenue, margin compression is a growing concern, especially for small-market clubs with limited local-media upside. Deferred compensation and guaranteed-deal structures create long-term liabilities that complicate balance-sheet flexibility. Unless revenue growth outpaces cap inflation, franchise EBITDA could narrow, tempering valuation multiples.
Gen-Z Attention Fragmentation
Gen Z viewers are less likely to watch full games on linear TV and instead prefer highlights and creator-led content. The NFL’s TikTok and Snapchat collaborations aim to meet fans on native platforms with short-form storytelling. Younger consumers demonstrate a 1.4 times higher likelihood than older demographics to attend live events on a monthly basis, coupled with higher per-ticket spending. This behavior highlights how experiential revenue is partially mitigating the decline in TV viewership minutes. Yet price sensitivity limits tolerance for multiple streaming subscriptions. Teams must balance innovation with core broadcast audiences that still drive the bulk of media income.
*Our forecasts treat driver/restraint impacts as directional, not additive. The impact forecasts reflect baseline growth, mix effects, and variable interactions.
Segment Analysis
By Sport Type: NFL Dominance Faces Emerging Competition
American football generated 42.15% of 2025 revenue, underscoring its outsized role in the North America sports teams and clubs market. The NFL’s USD 110 billion national-rights haul through 2033 ensures a predictable cash baseline for all 32 franchises. Scarcity—17 regular-season games—creates premium CPMs and season-ticket demand that other sports rarely match. Baseball continues to hold strong regional appeal due to its structured game schedule; however, it faces challenges with declining national viewership. This trend is further exacerbated by the financial instability of regional sports networks, which threatens the sport's revenue streams. Basketball capitalizes on global popularity and year-round content through summer tours and Olympics qualifiers, while hockey leverages cultural affinity in the northern United States region and Canada. Emerging sports such as esports, lacrosse, and rugby are accelerating at an 11.05% CAGR, capturing Gen Z mindshare and offering lower-cost franchise entry for investors.A wave of women’s leagues adds new growth vectors. Soccer’s MLS continues to benefit from rising Hispanic demographics and high-profile signings of international stars. The consolidated United Football League (merging XFL and USFL) exemplifies efficiency plays in upstart properties battling for media windows. Innovative broadcast formats—alt-casts, betting overlays, and shoulder content—help niche sports punch above traditional exposure weight.


By Revenue Source: Media Rights Supremacy Under Digital Pressure
Media rights comprised 46.55% of the North America sports teams and clubs market size in 2025, confirming live sports as the last appointment-viewing genre on television. The NBA’s landmark multilateral streaming-inclusive deal exemplifies the new hybrid rights era. Sponsorship and advertising grew at double-digit rates as brands sought guaranteed reach in a fragmented media landscape. Match-day revenue remains resilient due to dynamic pricing, premium hospitality upgrades, and experiential add-ons such as augmented-reality replays inside venues. Ancillary digital categories—data licensing, DTC subscriptions, and virtual goods are expanding at a 11.65% CAGR, outpacing legacy buckets and reducing reliance on linear television.Direct-to-consumer experimentation is thinning the line between media and merchandising; subscription bundles now include jersey discounts and NFT collectibles, raising average revenue per user. The pivot to fan-data monetization sharpens personalized sponsorship offers and boosts renewal rates. However, replacing cord-cut rights fees with DTC revenue introduces volatility, pushing clubs to hedge with multi-year enterprise technology partnerships. Teams that blend free ad-supported streaming with premium tiers widen the funnel while preserving upside. As streaming CPMs converge with linear rates, the overall media-income share may stabilize around half, even as absolute dollars grow.
By Ownership Model: Private Equity Reshapes Traditional Structures
Private family groups retained 52.85% control in 2025, but institutional capital is narrowing the gap as leagues liberalize ownership rules. The North America sports teams and clubs market saw the NBA approve minority private-equity stakes in 2023, prompting funds like Arctos and Sixth Street to build multiclub portfolios. Private-equity stakes are scaling at a 12.85% CAGR, introducing sophisticated analytics, operating-partner networks, and performance-based management incentives. Corporate conglomerates such as Comcast (Flyers) and Rogers (Blue Jays) use cross-media synergies to amplify content monetization while mitigating rights-cost risk. Publicly traded franchises remain rare given league restrictions, although success stories in Europe could re-ignite North American debates over IPO pathways.Private-equity ownership accelerates stadium real-estate plays, turning venues into year-round entertainment districts that compound revenue per square foot. Exit horizons align neatly with upcoming rights renegotiations, creating valuation step-ups. Critics warn that high leverage and dividend-recap tactics could strain club liquidity in downturns, though most funds deploy moderate debt given league debt-cap limits. Family owners respond by professionalizing governance, appointing external CEOs, and co-investing alongside institutional partners. Over time, mixed-capital cap tables may become standard as leagues court growth without diluting competitive balance.
Geography Analysis
The United States produced 88.70% of 2025 revenue, solidifying its anchor role in the North America sports teams and clubs market. America’s mature league infrastructure, lucrative media ecosystem, and USD 13.71 billion legal-betting handle underpin this weight. Stadium subsidies and tax-exempt municipal bonds cut capital costs, reinforcing franchise profitability despite escalating payrolls. Nevertheless, climate-risk modelling warns that USD 11 billion in NFL stadium asset value could be at stake by 2050, adding insurance and retrofit costs. Continued population migration to the Sun Belt grants growth to franchises in Texas and Florida that can monetize year-round tourism and corporate relocations.
Canada is the fastest grower at a 10.05% CAGR through 2031. The WNBA’s 2026 Toronto entry, backed by a USD 115 million investment, validates the cross-border potential of women’s sports. NHL valuations in Toronto and Montreal remain among the league’s highest despite currency drag, proving pricing power in culturally embedded hockey markets. Revenue upside also stems from government-supported sports-tourism initiatives. Mexico’s inclusion highlights soccer-driven fan-migration dynamics and Spanish-language media demand, giving MLS and Liga MX collaborations a springboard for regional sponsorships. Cross-border media deals enhance reach and diversify currency exposure for the United States leagues.
Mordor Intelligence examines the sports team and clubs market across diverse other regional markets as well, including Europe and Asia, while also offering granular country-level perspectives for United States, United Kingdom, India, Germany, and France and more.
Competitive Landscape
The North American sports teams market demonstrates moderate fragmentation, with the top five clubs accounting for only a limited share of the total market value, resulting in a low concentration score. Leading entities such as the Dallas Cowboys, Golden State Warriors, and New York Yankees exemplify the highest valuation tier, driven by robust global brand equity and diversified revenue streams extending beyond game-day operations. Private equity accelerates consolidation by purchasing minority stakes across multiple leagues, enabling portfolio synergies in ticketing software, merchandising, and sponsorship sales. Technology adoption differentiates leaders: AI-driven dynamic pricing, blockchain ticket authentication, and predictive injury analytics improve both fan experience and on-field performance.
Strategic emphasis has shifted toward year-round monetization. Mixed-use real-estate projects surrounding venues generate retail, hospitality, and event-booking income that cushions off-season cash troughs. Ownership groups increasingly launch venture funds to invest in sports-tech startups, capturing upside from innovations that can later be deployed within their operations. Vertical integration deals—such as TKO Group’s acquisition of IMG and On Location—bundle talent representation, event production, and premium hospitality under one umbrella, boosting margin capture.
Women’s sports offer white-space acquisition paths. Early investors obtain entry valuations at sizable discounts relative to the men’s equivalents, with room for media-rights growth. Clubs in niche leagues leverage social-media storytelling to compensate for limited broadcast windows, often outperforming incumbents on engagement per follower. Smaller franchises adopt asset-light models, outsourcing back-office functions to shared-services providers to keep overhead low. The combination of fragmentation and institutional capital appetite suggests sustained deal flow through 2030.
North America Sports Teams And Clubs Industry Leaders
Dallas Cowboys
New York Yankees
Golden State Warriors
Los Angeles Rams
Los Angeles Lakers
- *Disclaimer: Major Players sorted in no particular order

Recent Industry Developments
- April 2025: The Professional Women’s Hockey League confirmed Vancouver as its first expansion market, with a second Canadian team under evaluation.
- May 2025: Dick’s Sporting Goods announced a USD 2.4 billion takeover of Foot Locker to expand global sneaker retail reach.
- March 2025: Sportradar agreed to acquire IMG ARENA, adding 30,000 official data events annually to its portfolio.
- February 2025: TKO Group completed the purchase of IMG, On Location, and PBR assets from Endeavor, deepening vertical integration.


North America Sports Teams And Clubs Market Report Scope
Sports teams and Clubs consist of groups of players playing for different organizations and countries. Teams and Clubs of different sports participate in different leagues and matches. Over the period, sports teams and clubs have emerged as major segments in the sports entertainment segment, with revenue generation channels ranging from corporates to different media channels in the Market. The North American sports Team and clubs Market is segmented by Type (Football, Basketball, Baseball, Hockey, and Other Types), by Revenue Source (Media rights, Merchandising, Tickets, and Sponsorship), and by Country (United States, Canada, and Rest of North America). The report offers Market size and forecasts for the North American sports Team and clubs Market in value (USD) for all the above segments.
| American Football |
| Baseball |
| Basketball |
| Ice Hockey |
| Soccer |
| Emerging Sports (Lacrosse, Rugby, Esports Franchises) |
| Media Rights |
| Sponsorship & Advertising |
| Match-day (Ticketing & Hospitality) |
| Merchandising & Licensing |
| Ancillary (Digital, Data,etc) |
| Private Family Ownership |
| Corporate Conglomerate Ownership |
| Private-Equity Ownership |
| Publicly Traded Clubs |
| United States |
| Canada |
| Mexico |
| By Sport Type | American Football |
| Baseball | |
| Basketball | |
| Ice Hockey | |
| Soccer | |
| Emerging Sports (Lacrosse, Rugby, Esports Franchises) | |
| By Revenue Source | Media Rights |
| Sponsorship & Advertising | |
| Match-day (Ticketing & Hospitality) | |
| Merchandising & Licensing | |
| Ancillary (Digital, Data,etc) | |
| By Ownership Model | Private Family Ownership |
| Corporate Conglomerate Ownership | |
| Private-Equity Ownership | |
| Publicly Traded Clubs | |
| By Country | United States |
| Canada | |
| Mexico |


Key Questions Answered in the Report
What is the current size of the North America sports teams market?
The market is valued at USD 53.87 billion in 2026 and is forecast to reach USD 83.22 billion by 2031.
Which sport type generates the most revenue?
American football leads with a 42.15% share owing to the NFL’s national media-rights structure and premium sponsorship demand.
How fast is legal sports betting revenue growing?
Legal sports betting revenue rose 25.40% year-on-year to USD 13.71 billion across 38 U.S. jurisdictions.
Why are private-equity firms investing in franchises?
Stable cash flows, inflation hedging, and rising media-rights valuations align well with long-duration investment mandates, driving a 12.85% CAGR in PE ownership stakes.
Which geography is growing quickest?
Canada records the fastest CAGR at 10.05%, supported by WNBA and NHL expansions and favourable government backing for women’s sports.
What risks could slow market growth?
Escalating player-salary inflation and fragmented Gen Z viewing habits compress margins and threaten traditional broadcast revenues if not addressed through new monetization models.
Page last updated on:


