
Market Overview
| Study Period | 2021 - 2031 |
|---|---|
| Forecast Data Period | 2026 - 2031 |
| Historical Data Period | 2021 - 2024 |
| Growth Rate | 6.01 % |
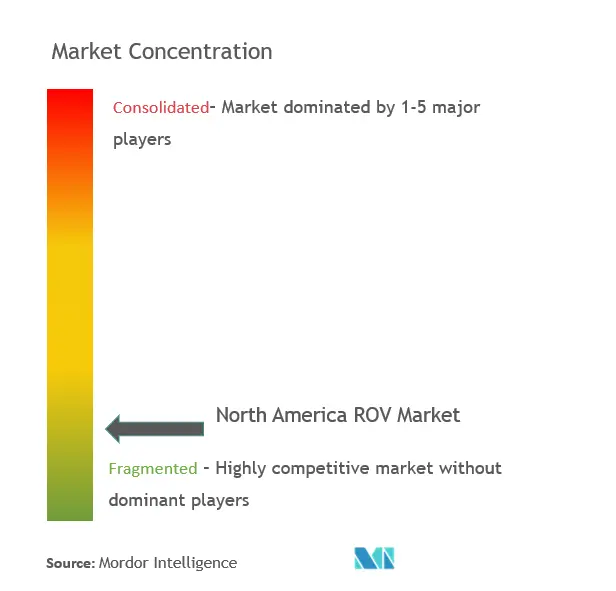
| Market Concentration | Low |
Major Players *Disclaimer: Major Players sorted in no particular order Image © Mordor Intelligence. Reuse requires attribution under CC BY 4.0. | |
North America ROV Market Analysis by Mordor Intelligence
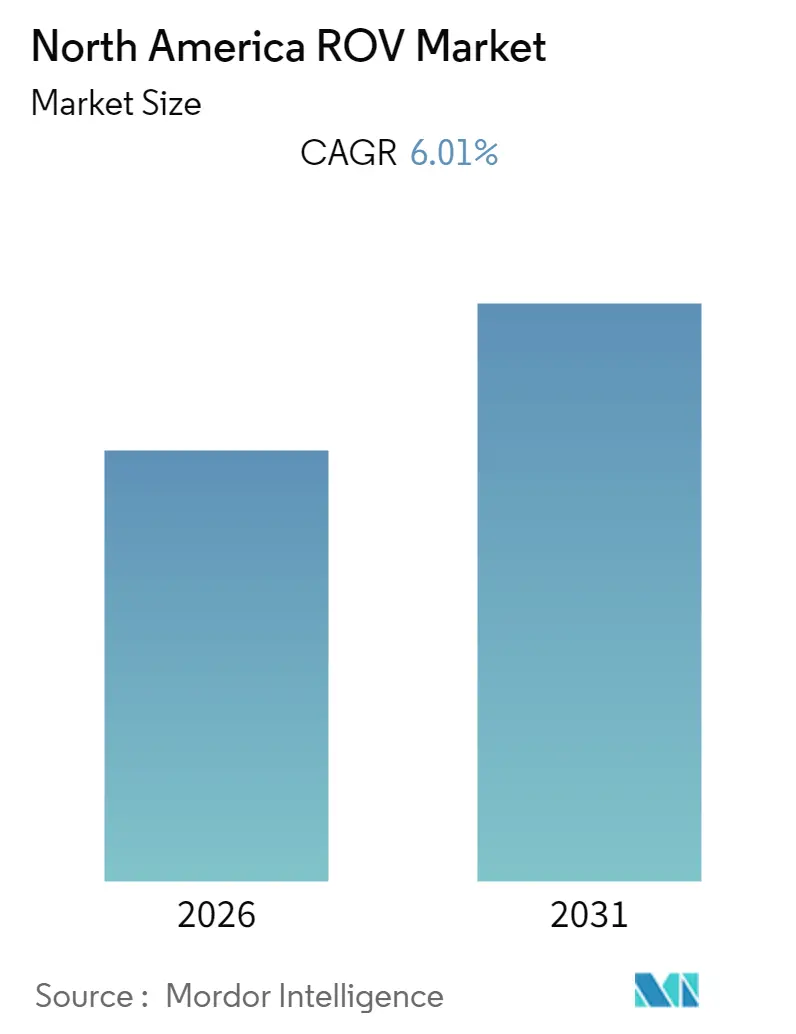
The North America ROV Market size is expected to register a CAGR of greater than 6.01% during the forecast period.
- Oil and gas application is expected to dominate the market due to the rising offshore oil and gas production and increasing oil and gas decommissioning activities across the region.
- Technological advancements in the ROV market are expected to create huge opportunities for North American ROV deployment over the forecast period.
- The United States is expected to dominate the market, with most of the demand coming from the oil and gas industry, offshore wind energy, etc.
Note: Market size and forecast figures in this report are generated using Mordor Intelligence’s proprietary estimation framework, updated with the latest available data and insights as of 2026.
Market Trends and Insights
Oil & Gas Application to Dominate the Market
- Exploring, drilling, and developing these oil and gas fields from underwater locations is crucial to meet the ever-growing demand for these resources. Remotely Operated Vehicles (ROVs) are helpful in the oil and gas industry. They are robotic machines that can travel underwater to help with various subsea exploration and development activities.
- ROVs have become almost indispensable in the oil and gas industry. With a rise in the installation of underwater infrastructure for oil and gas field development, ROVs have become integral to operations.
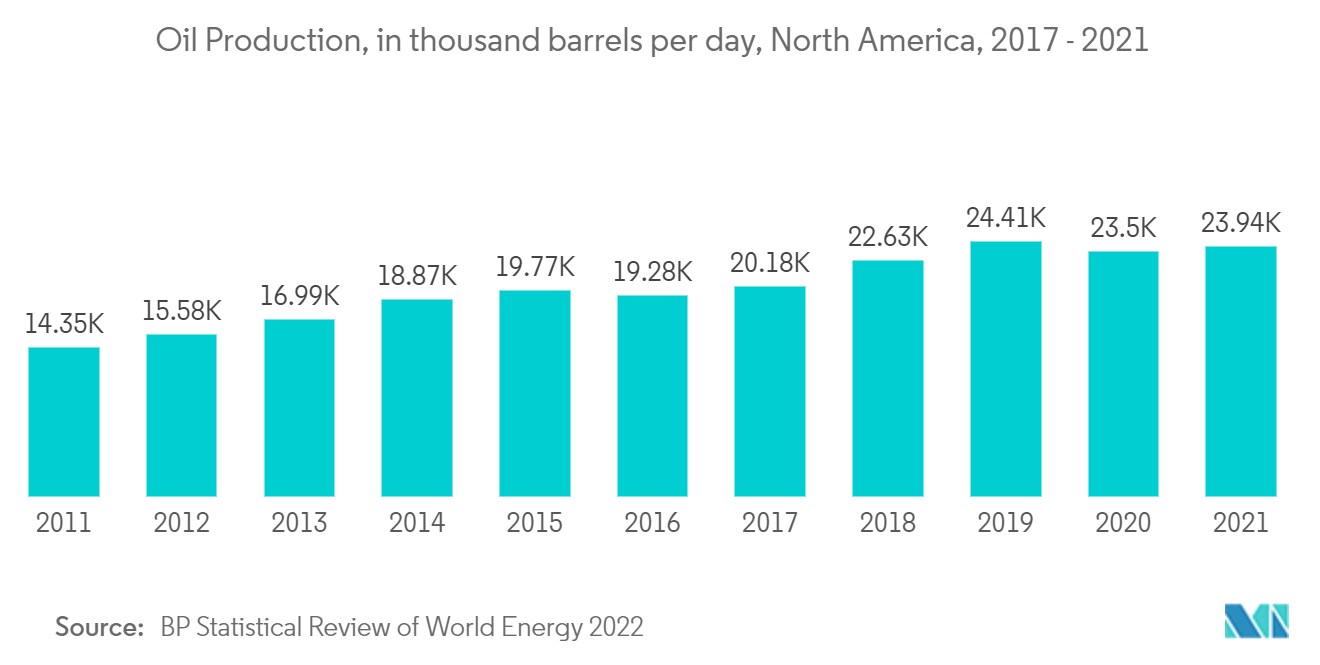
- North America's oil production grew from 14,345 thousandbarrels per day in 2011 to 23,942 thousand barrels per day in 2021. The increasing oil production is expected to drive the North America ROV market during the forecast period.
- Further, with the increasing production of hydrocarbons delivered through subsea wells, the demand for introducing new technologies that can ensure the safe development and intervention of these wells, located under thousands of meters of water, is increasing. In addition, rising deepwater offshore development activities and improved viability of offshore oil and gas projects in countries such as the United States are expected to increase the number of subsea wells in the coming years. This increase may drive the demand for North America ROV systems in the oil and gas application during the forecast period.
- The ROV market is also likely to grow because of offshore decommissioning activities worldwide. After 1947, only in the Gulf of Mexico (GOM), over 4,750 structures were removed from the federal waters. Additionally, there were around 2,189 existing platforms in the GOM's OCS region, of which approximately 30% of platforms were non-producing or otherwise considered 'idle-iron' and had to be decommissioned.
- In March 2021, Oceaneering International, Inc. announces that Subsea Robotics (SSR) and Offshore Projects Group (OPG) awarded an integrated rig services contract for covering the Khaleesi/Mormont and Samurai fields in the United States Gulf of Mexico. The scope of work includes providing remotely operated vehicles (ROVs) with collocated ROV tooling and technicians, remote positioning and metrology survey resources, installation and workover control system (IWOCS) equipment, and technicians.
- The Canadian offshore oil and gas sector is relatively younger when compared to the United States and Mexican counterparts. Due to this, demand for ROVs is expected to be low in the Canadian offshore oil and gas sector. However, as most of Canada's offshore reserves are situated in higher latitudes, these places are prone to ice cover and floating ice blocks and sheets, which makes diving a dangerous job.
- Therefore, based on the factors mentioned above, the oil and gas application segment is expected to dominate the North America ROV market during the forecast period.
The United States to Dominate the Market
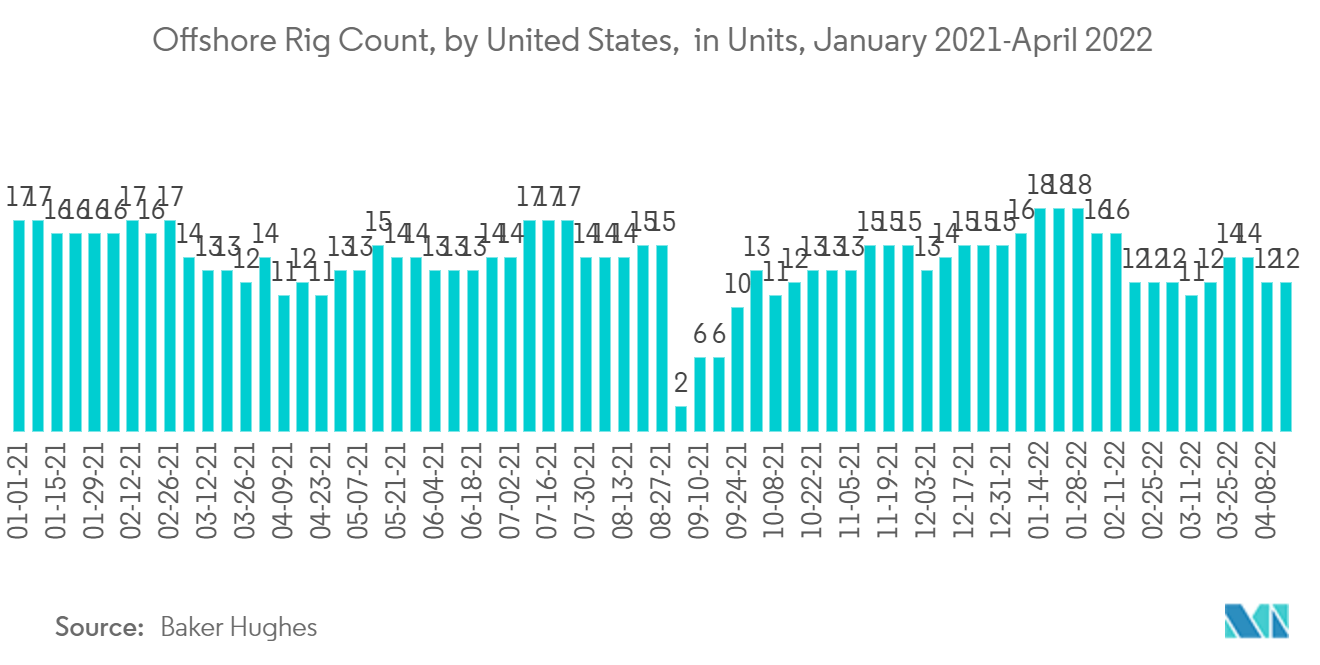
- The United States has invested heavily in expanding its oil and gas production capacity, and the Gulf of Mexico has become a global hotspot for ROV demand. As of 2021, the Gulf of Mexico region is responsible for 97% and 15% of the United States' offshore and total hydrocarbon production, respectively. The region has one of the highest global densities of offshore rig deployment and consists of other oil and gas infrastructures such as production and drilling platforms, marine vessels and pipeline networks.
- ROVs are incredibly complex and serve a wide variety of sectors such as search and rescue, military, aquaculture, recreation, discovery, oil, and gas industry, offshore energy, submerged infrastructure, shipping, and more. Some of the major factors driving the market studied include rising offshore oil and gas production activities, growing offshore wind power industry, and increasing offshore oil and gas decommissioning activities.
- As ROV technology has become increasingly affordable oil and gas producers in the United States have been inclined toward investing in ROV services for obtaining data and carrying out routine maintenance work on subsea assets and surfaces. Despite the higher upfront cost when compared to diving crews, ROVs need lesser amount of time to complete the same amount of work, which reduces overall project OPEX.
- Due to this, multiple contracts are routinely dealt out by major oil and gas companies for ROV services in the Gulf of Mexico. In January 2021, Oceaneering announced that its subsea segment had won multiple contracts totalling USD 225 million. The contracts were issued by iinternational oil and gas operators and marine construction companies, and the contracted services include remotely operated vehicle (ROV) services delivered from floating drilling rigs and multi-service, subsea intervention, and construction vessels, ROV tooling, survey, positioning, and autonomous underwater vehicle services.
- According to the Bureau of Safety and Environmental Enforcement (BSEE) and Bureau of Ocean Energy Management (BOEM), the GOM Shallow Water Province, generally of water depth less than 200 meters, has been a prolific area accounting for 33% of the Gulf's gas production and over 10% of its oil production. However, in the past 10 years, the number of wells drilled in the shallow water province decreased by 89%, and approximately 100 platforms a year are being removed with no new platforms being installed. Therefore, if this trend continues, the lack of development will potentially strand 179 million barrels of oil and 4,567 billion cubic feet of natural gas. According to BSEE and BOEM, they have an estimated worth of USD 20 billion.
- Hence, due to such factors, the United States is likely to dominate the North America ROV market during the forecast period.
Regulatory Landscape
ROV deployment for offshore oil and gas work in North America is shaped by United States federal offshore oversight and environmental review requirements, with the Bureau of Ocean Energy Management (BOEM) and the Bureau of Safety and Environmental Enforcement (BSEE) playing central roles in permitting and operational compliance in the Gulf of Mexico (GOM). In February 2026, BOEM issued a Record of Decision for Gulf of America OCS Lease Sales 259 and 261, a permitting signal linked to continued offshore activity that sustains demand for subsea inspection, intervention, and construction support where ROVs are standard tools.
Environmental assessment and project approval processes also affect subsea project timelines and documentation burdens. The Department of the Interior updated the National Environmental Policy Act (NEPA) implementing regulations effective July 3, 2025, which influences how offshore projects are assessed and, in turn, how subsea contractors plan surveys, inspection scopes, and installation methods. Industry practice for safe offshore marine operations is further shaped by bodies such as the International Marine Contractors Association (IMCA) and the Marine Technology Society (MTS) ROV Committee, whose guidance is frequently referenced in contractor pre-qualification and client requirements.
Value Chain Analysis
The North America ROV value chain covers ROV system design and manufacturing (vehicle frame, power and propulsion, sensors, tooling interfaces, and tether/umbilical systems), integration and testing, and then field delivery through service providers that supply pilots, technicians, tooling packages, and supporting survey and positioning capabilities. For offshore oil and gas, ROVs are typically mobilized as part of integrated subsea project execution alongside construction or intervention vessels and marine logistics, with offshore contractors and marine service providers (including those represented by the Offshore Marine Service Association, OMSA) enabling mobilization, deck support, and subsea worksite operations.
On the demand side, operators and EPC/EPCI contractors procure ROV services for survey, inspection, repair and maintenance, and intervention-related tasks, with contracting structures commonly bundling ROVs, tooling, and survey into broader installation or well-intervention scopes. TechnipFMCs integrated iEPCI delivery model illustrates how engineering, procurement, construction, and installation are packaged for subsea developments, bringing ROV operations into execution-critical workpacks such as subsea installation support, tie-in assistance, and verification activities. Standards, competency frameworks, and safety practices are reinforced through industry platforms such as IMCA and the MTS ROV Committee, which influence training, procedures, and client acceptance across the service chain.
Competitive Landscape
The North America ROV market is moderately fragmented. The key players in the market include DeepOcean AS, DOF Subsea AS, Oceaneering International Inc., Helix Energy Solutions Group Inc, and TechnipFMC PLC. among others.
North America ROV Industry Leaders
-
DeepOcean AS
-
DOF Subsea AS
-
Helix Energy Solutions Group Inc
-
Oceaneering International Inc.
-
TechnipFMC PLC
- *Disclaimer: Major Players sorted in no particular order
North America ROV Market Companies Covered in this Report
- DeepOcean AS
- DOF Subsea AS
- Helix Energy Solutions Group Inc
- TechnipFMC PLC
- Bourbon Corporation SA
- Fugro NV
- Oceaneering International Inc.
- Saab Seaeye Limited
- Forum Energy Technologies Inc.
- Saipem SpA
- Delta SubSea LLC
- ROVOP
Market Opportunities and Future Outlook
A key opportunity for ROV suppliers and service providers comes from inspection, repair and maintenance (IRM) and life-extension work on existing offshore infrastructure in the United States Gulf of Mexico, where mature subsea assets and decommissioning workloads require repeatable subsea intervention support. This demand is tied to ongoing platform removals and the scale of idle infrastructure previously highlighted for the GOM, which supports work-class ROV spreads, specialized tooling, and survey and metrology support during maintenance and abandonment campaigns.
Another opportunity is tied to integrated subsea project delivery models and tie-back intensive development strategies that compress schedules and bundle execution scopes. This increases the value of contractors that can provide vessels, ROV spreads, tooling, and survey as a coordinated package. TechnipFMCs reporting of approximately USD 30 billion of identified subsea opportunities for potential award over the 24 months ending mid-2028 indicates the breadth of global subsea work where North America-based fleets, engineering teams, and ROV operations capability can be allocated. Contracting activity that explicitly includes ROV and survey services within offshore installation scopes, such as Oceaneerings 2026 integrated offshore installation award at the West Delta Deep Marine (WDDM) field, shows ROV capability being procured as part of larger, execution-critical offshore work packages rather than as standalone support.
Recent Industry Developments in North America ROV Market
- June 2026: DOF Group ASA was awarded a very large three-year subsea contract for the Skandi Involver vessel in North America, commencing in early Q3 2026, including subsea construction, inspection, maintenance, and well intervention support. The award tightens DOF's North America subsea capabilities and contract footprint.
- April 2026: DOF Group ASA commenced offshore execution for a substantial (25-50 million) hydraulic subsea well intervention contract with Shell Offshore Inc. in the US Gulf. This reinforces the DOF Shell collaboration and IMR integration in North America.
- August 2025: Helix Energy Solutions Group Inc was awarded a multi-year contract with a major operator for production enhancement and well abandonment services in the US Gulf of Mexico, utilizing Q5000 or Q4000 vessels and ROVs. The deal points to continued Gulf of Mexico intervention activity.
North America ROV Market Report Scope and Research Methodology
Market Definition and Coverage
For this study, the North America ROV market is defined as revenues generated from remotely operated vehicles and related systems used for underwater survey, inspection, repair, maintenance, and similar subsea activities across North American waters and customers.
Scope exclusions: This sizing excludes autonomous underwater vehicles, diver services, and onshore-only robotics that do not perform subsea work.
Segments Covered in This Report
- Type
- Work Class ROV
- Observatory Class ROV
- Application
- Oil and Gas
- Defense
- Other Applications
- Activity
- Survey
- Inspection, Repair, and Maintenance
- Burial and Trenching
- Other Activities
- Geography
- United States
- Canada
- Rest of North America
Data Sources, Market Sizing, and Validation
Desk Research
Desk research was used to map the demand pool and to ground our assumptions in public activity indicators that can be independently checked. We relied on official, non-paywalled sources such as BOEM offshore lease sales and Gulf of Mexico updates, BSEE offshore production and safety statistics, the US Energy Information Administration for offshore supply context, NOAA ocean and coastal data releases, and Statistics Canada tables that help with marine and energy context.
To translate activity into value ranges, we also reviewed company annual reports, 10-K style filings, and investor presentations, then compared them with reputable press coverage of offshore campaigns and regulatory updates. Where we needed quick cross-checks on company financials, revenue mix timing, and major contract wins, paid subscriptions for company financials and news were used selectively, and a patent database was referenced for technology signals tied to sensors, manipulators, and tether systems. The sources named here are not exhaustive, and many other references were used for data collection, validation, and research clarification.
Primary Interviews and Surveys
Primary work focused on validating how often ROVs are deployed, what activities drive utilization, and how pricing moves with depth, vessel day rates, and project complexity. We spoke with a mix of manufacturers, service providers, offshore operators, and end users across the United States and Canada, then used follow-up checks to close gaps that desk research could not answer cleanly.
Distribution of primary research fieldwork respondents
| Company type | Respondent position |
|---|---|
| Top tier: 37% | CXOs: 14% |
| Mid tier: 47% | Functional/Unit leaders: 31% |
| Smaller Players: 16% | Managers: 55% |
Market-Sizing & Forecasting
Market sizing was built by first reconstructing the demand pool from North America subsea activity signals, and then converting that demand into revenue using realistic utilization and pricing ranges. We state the top-down approach as a subsea activity led build, where drilling and intervention programs, inspection and maintenance workloads, and the project mix by depth are translated into expected ROV days and equipment needs.
To corroborate totals, we added selective bottom-up checks using sampled supplier and service-provider revenue splits, feedback on fleet additions from industry channels, and typical day-rate and system price bands by ROV class. Key inputs used in the model included deepwater project cadence in the Gulf of Mexico, inspection and maintenance intensity on subsea infrastructure, defense related underwater mission demand, the mix shift between work class and observatory class units, and the direction of vessel and labor costs that influence delivered service pricing.
Forecasting used scenario analysis supported by expert consensus, since offshore capex cycles and permitting can change the near-term run rate quickly. Where disclosures or public activity data did not allow clean splits between activities, ranges were applied and then narrowed through interview feedback before finalizing the market value.
Data Validation & Update Cycle
Validation was completed through stepwise cross-checks so the final number stays tied to observable market signals. Model outputs were compared against independent indicators such as offshore project announcements, federal offshore activity releases, and reported subsea service momentum, and then outliers were reworked or revisited through follow-up calls.
Before sign-off, the estimates go through multi-step analyst review, where assumptions, unit economics, and year-over-year movements are checked for internal consistency and for unexpected swings. Reports are refreshed annually, with interim updates triggered by material events such as large offshore project sanctions, policy changes affecting drilling, or sudden cost inflation. Right before delivery, a fresh analyst pass is completed so clients receive the most current view available.
Mordor Intelligence's North America Rov Market Size Compared With Other Published Estimates
Published market sizes for North America ROVs can look far apart because each publisher counts a slightly different revenue pool, time window, and price basis. Differences often come from whether the estimate emphasizes equipment sales, service work, or both, and whether defense and non-oil applications are treated as meaningful parts of the market.
AUV revenue often gets blended into broader underwater-robotics totals, and some studies also fold in adjacent marine services like diver-based inspection or general vessel work that is not ROV-led. Another driver is how pricing is handled, since day rates can move with vessel availability and depth, and currency timing can shift totals if an average rate is used across the year. AUVs sit outside Mordor Intelligence's scope, which is one reason our number can differ from estimates that report combined AUV plus ROV totals.
Benchmark comparison
| Source | Market Size | Gaps in Research Methodology |
|---|---|---|
| Mordor Intelligence | USD 1.38 B (2026) | |
| Trade Journal A | USD 1.14 B (2030) | The value is given for a different end year and the scope is not clearly split between equipment and services, which can reduce the total when service utilization and day rates are a major part of revenue. |
| Regional Consultancy B | USD 1.47 B (2025) | The scope appears to be broader and may be influenced by an offshore-heavy narrative that can overstate the ROV-only total if adjacent underwater-robotics categories are included or if growth assumptions are applied uniformly. |
Across these sources, the biggest gaps come from what is counted in the revenue pool, how services are priced, and which year is used as the headline. By keeping the steps traceable to subsea activity, class mix, and pricing checks that can be re-tested, we aim to provide a stable number that stakeholders can reconcile to observed offshore work.
Key Questions Answered in the Report
What is the current North America ROV Market size?
The North America ROV Market is projected to register a CAGR of greater than 6.01% during the forecast period (2026-2031)
Who are the key players in North America ROV Market?
DeepOcean AS, DOF Subsea AS, Helix Energy Solutions Group Inc, Oceaneering International Inc. and TechnipFMC PLC are the major companies operating in the North America ROV Market.
What years does this North America ROV Market cover?
The report covers the North America ROV Market historical market size for years: 2020, 2021, 2022, 2023, 2024 and 2025. The report also forecasts the North America ROV Market size for years: 2026, 2027, 2028, 2029, 2030 and 2031.