
North America OTT Market Size and Share
Market Overview
| Study Period | 2020 - 2031 |
|---|---|
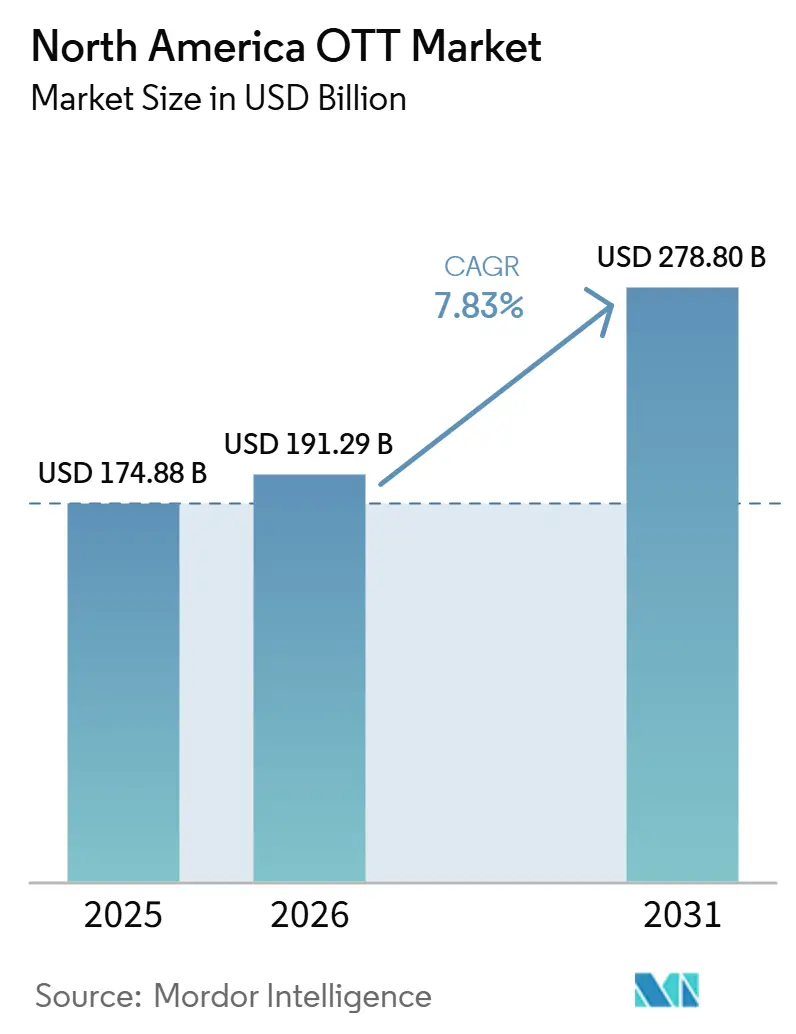
| Market Size (2026) | USD 191.29 Billion |
| Market Size (2031) | USD 278.80 Billion |
| Growth Rate (2026 - 2031) | 7.83 % |
| Fastest Growing Market | Asia-Pacific |
| Largest Market | North America |
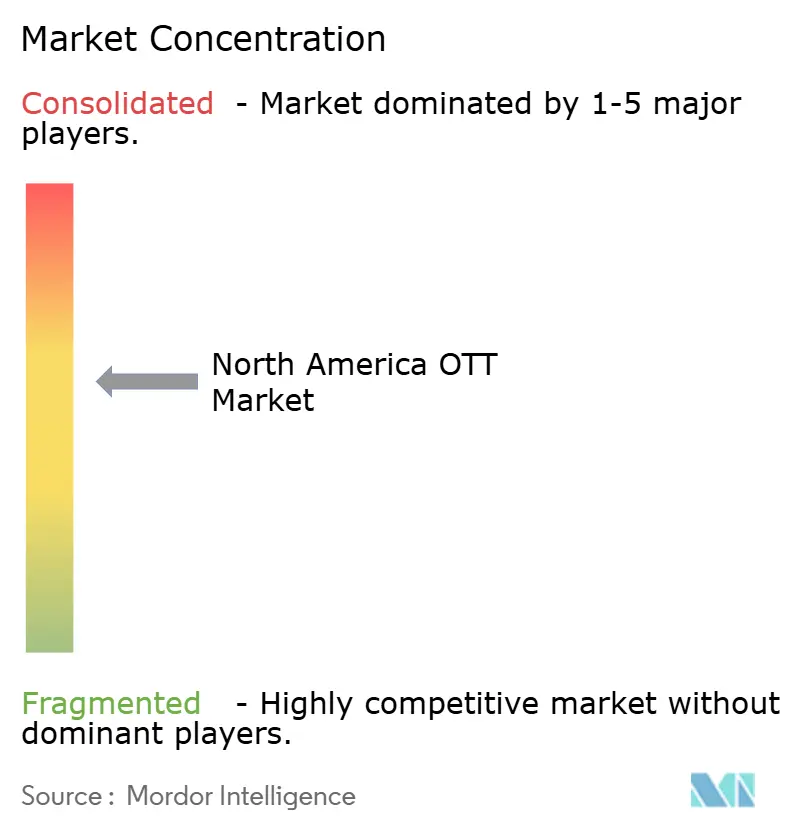
| Market Concentration | Medium |
Major Players *Disclaimer: Major Players sorted in no particular order Image © Mordor Intelligence. Reuse requires attribution under CC BY 4.0. | |
North America OTT Market Analysis by Mordor Intelligence
The North America OTT market size is projected to expand from USD 174.88 billion in 2025 and USD 191.29 billion in 2026 to USD 278.80 billion by 2031, registering a CAGR of 7.83% between 2026 to 2031. The North America OTT market is moving further from linear pay television as households use streaming services across subscription, advertising, and transaction-based offers. Advertising is becoming a more important source of incremental revenue as subscription additions mature in the United States and Canada. Broadband access, content investment, and the shift of television budgets toward connected TV support this change. Telecom bundles are also changing the competition because providers can retain the billing relationship while offering several services together. Content spending, sports rights costs, and subscriber cancellations remain important limits on the pace of revenue growth.
Key Report Takeaways
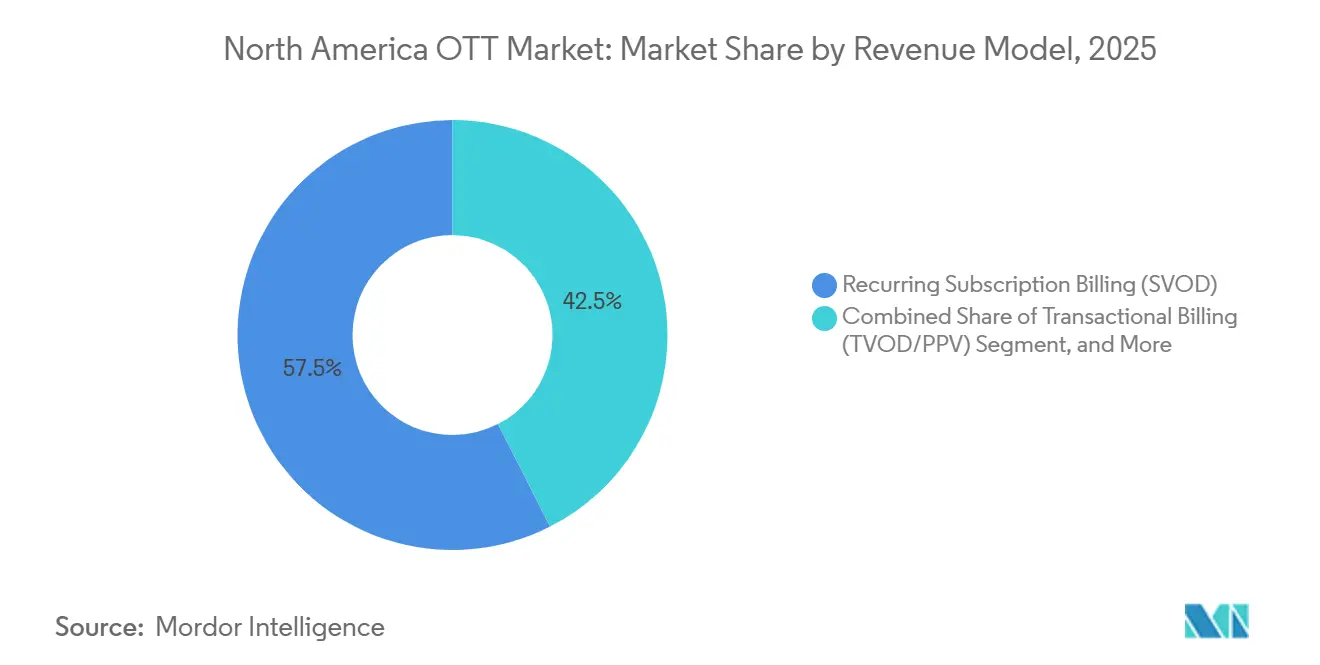
- By revenue model, recurring subscription billing held 57.50% of the North America OTT market share in 2025, while hybrid monetization billing is projected to expand at an 8.55% CAGR through 2031.
- By device type, smart TVs accounted for 50.50% of the North America OTT market size in 2025 and are projected to expand at an 8.73% CAGR through 2031.
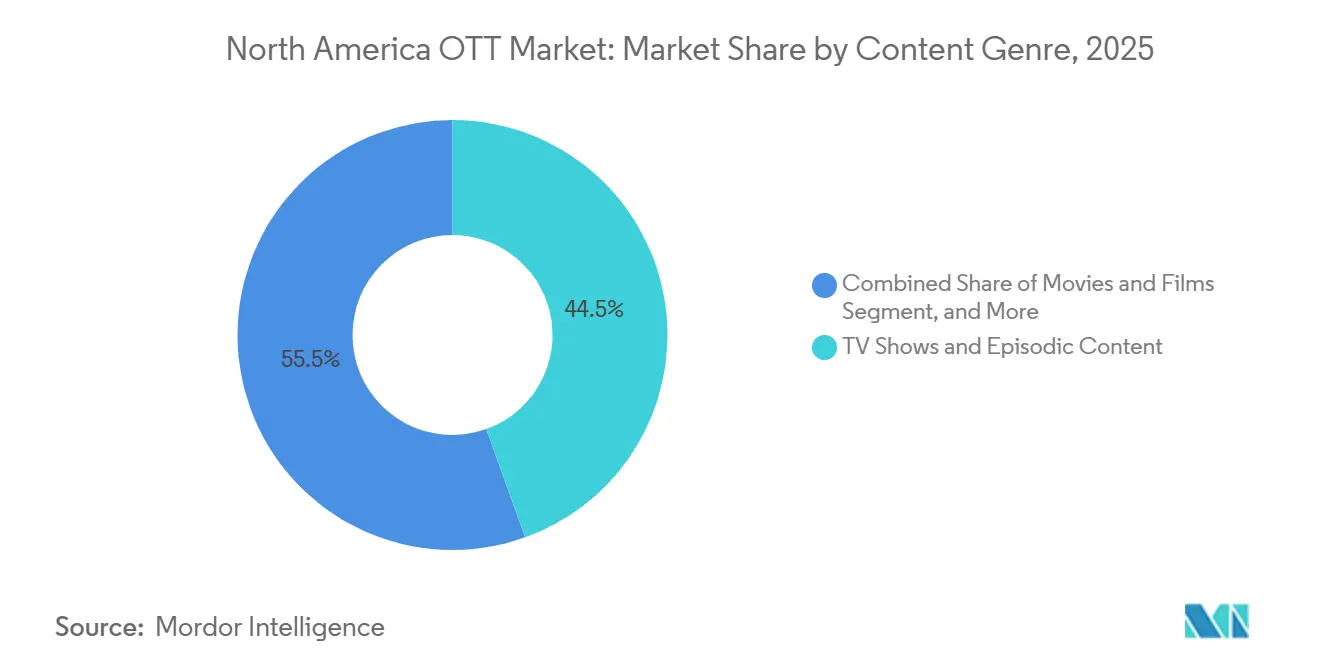
- By content genre, TV shows and episodic content held 44.50% of revenue in 2025, while documentaries are expected to expand at an 8.21% CAGR through 2031.
- By geography, the United States held 72.50% of regional revenue in 2025, while Mexico is projected to record a 9.21% CAGR through 2031.
Note: Market size and forecast figures in this report are generated using Mordor Intelligence’s proprietary estimation framework, updated with the latest available data and insights as of January 2026.
Global North America OTT Market Trends and Insights
Drivers Impact Analysis*
| Driver | (~) % Impact on CAGR Forecast | Geographic Relevance | Impact Timeline |
|---|---|---|---|
| Rising Adoption of Ad-Supported Streaming Bundles | +1.8% | United States, Canada, Mexico | Short term (≤ 2 years) |
| Escalating Live Sports Rights Monetization | +1.5% | United States, Canada | Medium term (2-4 years) |
| Connected-TV Ad Inventory Expansion | +1.2% | United States, Canada | Short term (≤ 2 years) |
| AI-Driven Personalization and Churn Reduction | +1% | United States, Canada, Mexico | Medium term (2-4 years) |
| Rising Password Sharing Enforcement and Household Conversion | +0.8% | United States, Canada | Short term (≤ 2 years) |
| Telecom and Pay-TV Aggregation Partnerships | +0.6% | United States, Canada | Medium term (2-4 years) |
| Source: Mordor Intelligence | |||
Rising Adoption of Ad-Supported Streaming Bundles
Ad-supported plans are becoming a central route to subscriber growth in the North America OTT market. These plans give price-sensitive households a lower entry point while allowing platforms to earn from both monthly billing and advertising. The model gives advertisers access to audiences that have moved away from scheduled television, particularly viewers who prefer free ad-supported channels. Bundled offers can reduce the need for consumers to choose between several separate services, which can make monthly entertainment spending easier to manage. This changes service selection because value, price, and convenience can matter as much as a single catalog or a temporary exclusive title. It also gives platforms a way to serve households that may not accept repeated subscription price increases.
Escalating Live Sports Rights Monetization
Live sports remain important because audiences often watch events when they happen rather than at a later time. Rights can help a service attract new subscribers, give current subscribers a reason to remain, and offer advertisers access to large live audiences. The 2025-26 NBA rights structure placed packages with Disney, Amazon, and NBCUniversal, increasing the importance of streaming distribution for major leagues. Amazon integrated Luna cloud gaming into Prime Video on Fire TVs in July 2026, extending its video environment beyond passive viewing.[1]Amazon Game Studios, “Prime Video Is Getting Games Via Amazon Luna,” Amazon Game Studios, amazongamestudios.com. Sports rights also create large commitments that continue for several years and can shape how platforms plan content spending. This can support engagement and advertising demand, but it increases the need for careful pricing, audience growth, and advertising returns.
Connected-TV Ad Inventory Expansion
Connected television gives streaming companies and device platforms more places to sell advertising to viewers who use television screens regularly. The television home screen has become valuable because it can guide viewers toward apps, free channels, and paid content before a program starts. Samsung Ads enabled programmatic buying for home screen inventory through The Trade Desk and Google Display and Video 360 in June 2026. Netflix also widened access to its advertising inventory through The Trade Desk in May 2026. These changes can make premium television placements easier for advertisers to buy through established advertising systems. They also increase the importance of device operating systems, data, and home-screen placement in the North America OTT market.
AI-Driven Personalization and Churn Reduction
Recommendation systems can help viewers find content that matches their interests more quickly within large and changing catalogs. This can strengthen the perceived value of a service without requiring every platform to add the same volume of programming. Netflix said it had used generative AI workflows across titles in its Q2 2026 earnings discussion. Amazon also directed work on the Lighthouse project to redesign Prime Video recommendations in July 2026. Better discovery can make a large catalog easier to use for households that already maintain several subscriptions. It can also help services connect viewing behavior with programming decisions, promotional activity, and efforts to reduce cancellations.
Restraints Impact Analysis*
| Restraint | (~) % Impact on CAGR Forecast | Geographic Relevance | Impact Timeline |
|---|---|---|---|
| High Content Acquisition and Production Costs | -1.3% | United States, Canada | Long term (≥ 4 years) |
| Subscription Fatigue and Churn Intensity | -1.1% | United States, Canada, Mexico | Short term (≤ 2 years) |
| Advertising Load Resistance in Premium Tiers | -0.7% | United States, Canada | Medium term (2-4 years) |
| Fragmented Device and App Discovery Across Ecosystems | -0.5% | United States, Canada, Mexico | Medium term (2-4 years) |
| Source: Mordor Intelligence | |||
High Content Acquisition and Production Costs
Content production and acquisition costs remain a persistent challenge for the North America OTT market, as viewers expect a steady supply of recognizable programming. Platforms require series, films, sports, and local content to sustain subscriber engagement and support advertising sales. Netflix expected its content spending to remain substantial, while Disney projected significant spending across entertainment and sports. Sports rights can create additional pressure, as agreements often span multiple seasons and do not adjust based on quarterly subscriber performance. Companies find it difficult to scale back large commitments if subscriber growth slows or advertising revenue takes longer to mature. Therefore, companies need advertising, pricing strategies, bundles, and disciplined programming decisions to support the cost of premium content.
Subscription Fatigue and Churn Intensity
Subscription fatigue affects households that pay for several services at the same time and regularly assess which bills to keep. Consumers can cancel after watching a specific program and return later for another title, creating a pattern of rotational viewing. Price increases can make that pattern more common, especially when household budgets are under pressure and services offer similar content choices. The North America OTT market therefore depends on ongoing programming, flexible tiers, clearer bundles, and useful recommendations that make a service easier to justify. Advertising-supported plans can reduce the monthly cost, but they can also test viewer tolerance for commercial breaks within premium programming. Platforms must balance price, advertising load, content availability, and simple cancellation policies to limit avoidable churn.
*Our forecasts treat driver/restraint impacts as directional, not additive. The impact forecasts reflect baseline growth, mix effects, and variable interactions.
Segment Analysis
By Revenue Model: Hybrid Billing Broadens Platform Monetization
Recurring subscription billing held 57.50% of revenue in 2025, making it the largest revenue model and the core paid offer for major platforms. Subscription plans remain important because they provide predictable billing, direct customer relationships, and a way to support investment in broad entertainment libraries. Netflix reported 13-15% annual revenue growth in its Q2 2026 filing, supported by membership growth and price increases. This shows that paid plans still retain value in mature parts of the region, even as households review their recurring bills. At the same time, subscription growth is increasingly tied to plans that include advertising and give customers a lower monthly price.
Hybrid monetization billing is projected to grow at an 8.55% CAGR between 2026 and 2031, making it the fastest-growing revenue model. These offers combine subscription access with advertising income in one product structure and let platforms respond to different levels of household willingness to pay. Advertising-supported billing expanded during 2025, and Tubi passed USD 1 billion in revenue, showing the growing commercial importance of free viewing. Transactional billing remains useful for premium films, major events, and pay-per-view purchases because households may still spend on selected titles after pausing subscriptions. The North America OTT industry is using subscription, advertising, and transaction options together, rather than treating one model as a replacement for all others.



By Device Types: Smart TVs Lead Viewing and Advertising Access
Smart TVs accounted for 50.50% of device-level revenue in 2025 and are projected to grow at an 8.73% CAGR through 2031. Their position reflects the continued importance of television screens for long-form viewing, shared household viewing, live sports, and premium video advertising. Device makers can shape discovery through operating systems and home screens, which determine how easily a viewer finds an app or a free channel. This gives manufacturers a role in advertising that extends beyond hardware sales and adds a platform function to the television set. Samsung's programmatic home screen inventory is one example of this expanded role.
Smartphones and tablets remain relevant for discovery, short-form engagement, and viewing outside the home, even though they do not lead to long-form revenue. Netflix launched its Clips feature, while Disney+ launched Verts during July 2026, showing increased attention to mobile discovery and re-engagement. Laptops and desktops continue to serve shared homes, workplaces, and younger viewers, while gaming consoles and external streaming players support access to several services. Amazon's Fire TV environment also connects video with gaming through the Luna integration. The North America OTT market size for smart TVs is supported by subscriptions, advertising, home-screen discovery, and access to several services from one device.
By Content Genre: Episodic Programming Anchors Revenue While Documentaries Expand
TV shows and episodic content held 44.50% of content revenue in 2025, giving the category the leading position among genres. Multi-season programs, reality formats, and serialized dramas can give viewers reasons to return regularly because a story or competition continues across several episodes. Episodic libraries can support renewal because audiences often follow programs over several weeks instead of consuming a single title once. Nearly 41 million U.S. households held Netflix and at least one of Hulu, Paramount+, or Peacock during 2025. This pattern showed that households use several services for different programming libraries, release schedules, and franchise preferences.
Documentaries are projected to grow at an 8.21% CAGR through 2031, the fastest pace among content genres. True crime represented 25.72% of OTT documentary revenue in 2025. Documentary programming can have different cost needs from scripted series and can work across subscription, advertising-supported, and free ad-supported channels. Netflix planned to fund 300 documentaries annually by 2025, compared with 50 in 2020, which expanded the supply of programming in this genre. Movies and films remain important for premium release windows and catalog depth, while live events, sports highlights, interactive formats, and gaming-related experiences widen the content mix.
Geography Analysis
The United States held 72.50% of regional revenue in 2025. It has a mature connected TV advertising environment and a large base of paid streaming households. The North America OTT market share held by the United States reflects its scale in advertising, subscriptions, and content spending. Netflix is expected to achieve higher annual revenue in 2026, supported by expected growth in advertising revenue. The country remains the primary testing ground for advertising tiers, bundle pricing, sports distribution, and home-screen advertising. Its large subscription base allows platforms to adjust pricing, although content and sports costs may limit operating leverage.
Canada's OTT subscription revenue is projected to grow steadily. The country is also expected to see OTT subscription revenue exceed traditional television subscription revenue for the first time. The Online Streaming Act has introduced a regulatory factor into platform planning. The Canadian Radio-television and Telecommunications Commission has established a revenue contribution requirement for international streaming services to support Canadian content funds.[2]Canadian Radio-television and Telecommunications Commission, “Contributions to Canadian Content,” Canadian Radio-television and Telecommunications Commission, crtc.gc.ca. This requirement can influence content investment decisions and make local content funding part of the competitive setting.
Mexico is projected to record a 9.21% CAGR from 2026 to 2031, the fastest national rate in the region. Its growth is linked to mobile-first viewing, broader broadband access, and Spanish-language catalog expansion. Mexico is expected to see continued SVOD adoption. Netflix is projected to remain the leading platform, followed by Disney+ and HBO Max. A significant share of Mexico's internet users with SVOD access is expected to remain in the lower-to-mid pricing tiers. ViX FAST channels are projected to generate substantial revenue in Mexico. These conditions make flexible pricing and advertising-supported access important for the North America OTT market. They also show why retention and monetization are becoming as important as subscriber additions.
Competitive Landscape
The North America OTT market combines a concentrated premium subscription tier with a wider group of free advertising-supported operators. Netflix, The Walt Disney Company, and Amazon hold important positions in paid streaming. Tubi, Pluto TV, The Roku Channel, and other operators compete for free streaming audiences. Their performance depends on programming, distribution agreements, advertising sales, and placement on connected TV interfaces. The range of business models means competition differs between paid and free services. Device platforms have an advantage when they control discovery, advertising inventory, and the billing route. That advantage can shape which services a viewer sees first when a television turns on.
Paramount and Warner Bros. Discovery announced a definitive all-cash merger agreement in February 2026. The transaction had an enterprise value of USD 110 billion and was expected to close in Q3 2026.[3]Paramount, “Paramount to Acquire Warner Bros. Discovery to Form Next-Generation Global Media and Entertainment Company,” Paramount, paramount.com. It would bring Paramount+, HBO Max, Warner Bros. studios, and CNN into one company. Fox Corporation also announced its acquisition of Roku in June 2026 for USD 22 billion. The deal would combine Tubi with Roku's connected TV platform.[4]Roku, Inc. and Fox Corporation, “Fox Corporation to Acquire Roku, Inc.,” Roku, Inc., newsroom.roku.com. These moves seek scale across content, advertising, and device access. They also reduce the number of standalone positions in the middle tier.
Comcast expanded Xfinity StreamSaver to eight bundle combinations in April 2026. The offers included advertising-supported plans from Disney+, Hulu, HBO Max, Peacock, Netflix, and Apple TV+. The structure gives Comcast a larger role in subscription distribution and lets it offer discounts of up to 45% against standalone pricing. Amazon is investing in recommendations and broader Prime Video experiences, including gaming integration. Netflix is strengthening advertising access and discovery tools. DAZN Group and TelevisaUnivision's ViX hold focused positions in sports and Hispanic streaming. Cineverse Corp. and Plex, Inc. remain part of the independent FAST operator tier. These operators can remain relevant through distribution agreements even as larger platform ecosystems expand.
North America OTT Industry Leaders
Netflix Inc.
The Walt Disney Company
Amazon.com, Inc
Alphabet Inc.
Apple Inc.
- *Disclaimer: Major Players sorted in no particular order

Recent Industry Developments
- July 2026: Amazon integrated its Luna cloud gaming service directly into Prime Video on Fire TVs in the United States and the United Kingdom, making titles including Hogwarts Legacy and EA Sports FC 26 accessible within the streaming interface.
- June 2026: Fox Corporation announced the acquisition of Roku, Inc. for USD 22 billion at USD 160 per share in a combination of cash and Fox Class A common stock, combining Fox's Tubi AVOD service, news, and sports content with Roku's 100-million-household global CTV platform.
- April 2026: Comcast's Xfinity expanded its StreamSaver bundle platform to eight combinations, incorporating ad-supported tiers of Disney+, Hulu, and HBO Max alongside Peacock, Netflix, and Apple TV+, offering subscribers discounts of up to 45% versus standalone pricing.
- February 2026: Paramount, a Skydance Corporation, and Warner Bros. Discovery, Inc. announced a definitive all-cash merger agreement under which Paramount will acquire WBD for USD 31.00 per share, with a total enterprise value of USD 110 billion and equity value of USD 81 billion.


Global North America OTT Market Report Scope
North America OTT market refers to the revenue and ecosystem generated by internet-delivered video services such as subscription, ad-supported, transactional, and hybrid streaming across the United States, Canada, and Mexico. It covers OTT video platforms, connected-TV apps, and streaming services that bypass traditional cable and satellite distribution.
The North America OTT Market Report is Segmented by Revenue Model (Recurring Subscription Billing (SVOD), Transactional Billing (TVOD/PPV), Advertising-Supported Billing (AVOD/FAST), and Hybrid Monetization Billing), Device Types (Smartphones and Tablets, Smart TVs, and Laptops and Desktops), Content Genre (Movies and Films, TV Shows and Episodic Content, and Documentaries), and Country (United States, Canada, Mexico). The Market Forecasts are Provided in Terms of Value (USD).
| Recurring Subscription Billing (SVOD) |
| Transactional Billing (TVOD/PPV) |
| Advertising-Supported Billing (AVOD/FAST) |
| Hybrid Monetization Billing |
| Smartphones and Tablets |
| Smart TVs |
| Laptops and Desktops |
| Other Device Types |
| Movies and Films |
| TV Shows and Episodic Content |
| Documentaries |
| Other Content Genres |
| United States |
| Canada |
| Mexico |
| By Revenue Model | Recurring Subscription Billing (SVOD) |
| Transactional Billing (TVOD/PPV) | |
| Advertising-Supported Billing (AVOD/FAST) | |
| Hybrid Monetization Billing | |
| By Device Types | Smartphones and Tablets |
| Smart TVs | |
| Laptops and Desktops | |
| Other Device Types | |
| By Content Genre | Movies and Films |
| TV Shows and Episodic Content | |
| Documentaries | |
| Other Content Genres | |
| By Country | United States |
| Canada | |
| Mexico |


Key Questions Answered in the Report
What is the North America OTT market size?
The North America OTT market size is projected to reach USD 278.80 billion by 2031 from USD 191.29 billion in 2026.
What is driving North America OTT revenue growth?
Advertising-supported plans, connected TV advertising, bundles, and content demand are supporting revenue growth.
Which revenue model leads streaming services in North America?
Recurring subscription billing led with 57.50% of revenue in 2025, while hybrid monetization is projected to grow fastest.
Why are smart TVs important for streaming providers?
Smart TVs held 50.50% of device-level revenue in 2025 and support viewing, discovery, and advertising access.
Which country is growing fastest in regional streaming?
Mexico is projected to grow at a 9.21% CAGR from 2026 to 2031, supported by flexible tiers and Spanish-language content.
How are major streaming companies changing their strategies?
Companies are pursuing bundles, advertising tools, recommendation systems, sports content, and acquisitions across content and connected TV platforms.
Page last updated on:





