
North America Industrial Filtration Market Size and Share
Market Overview
| Study Period | 2022 - 2032 |
|---|---|
| Forecast Data Period | 2027 - 2032 |
| Base Year Market Size (2026) | USD 17.25 Billion |
| Market Size (2027) | USD 20.24 Billion |
| Market Size (2032) | USD 25.67 Billion |
| Growth Rate (2027 - 2032) | 4.87 % |
| Market Concentration | Medium |
Major Players *Disclaimer: Major Players sorted in no particular order Image © Mordor Intelligence. Reuse requires attribution under CC BY 4.0. | |
North America Industrial Filtration Market Analysis by Mordor Intelligence
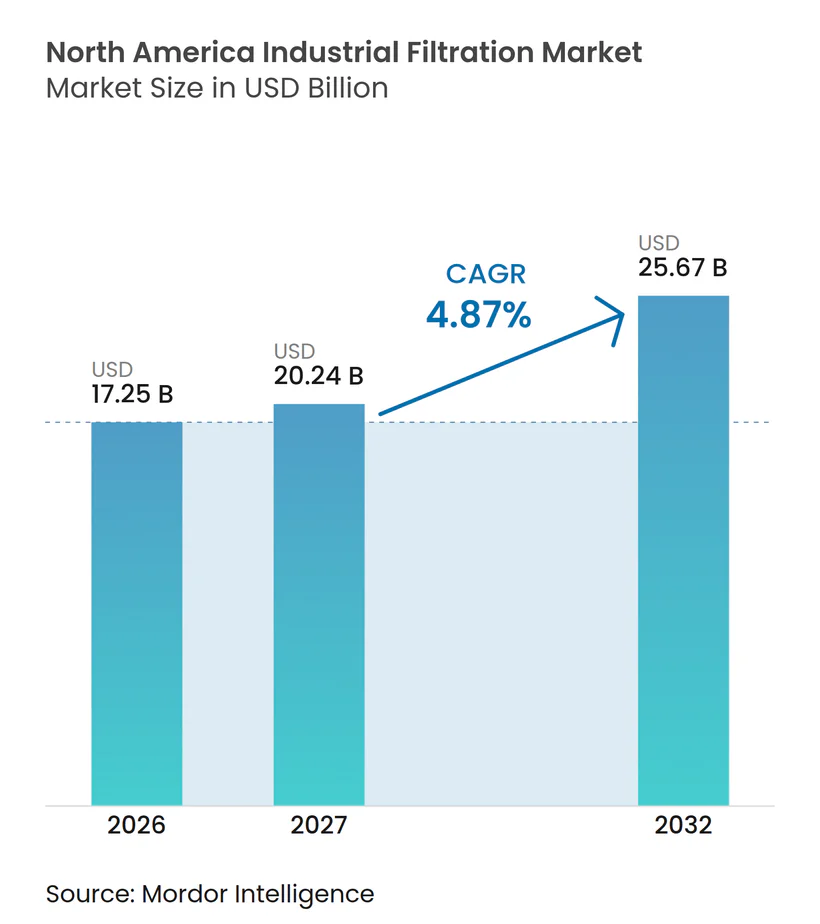
The north america industrial filtration market size is projected to expand from USD 17.25 billion in 2026 and USD 20.24 billion in 2027 to USD 25.67 billion by 2032, registering a CAGR of 4.87% between 2027 and 2032. Regulatory requirements for drinking water, industrial discharges, and air emissions are supporting replacement and new-system purchases across the region. Semiconductor capacity additions are raising demand for ultra-pure water systems and high-specification process filtration. Water reuse is becoming more important where industrial water availability is limited or discharge rules are stricter. Suppliers are also combining equipment, consumables, remote monitoring, and service contracts to make operating performance more visible to customers. Acquisitions in 2025 and 2026 show that recurring revenue from replacement filters and related services is an important competitive priority.[1]
Key Report Takeaways
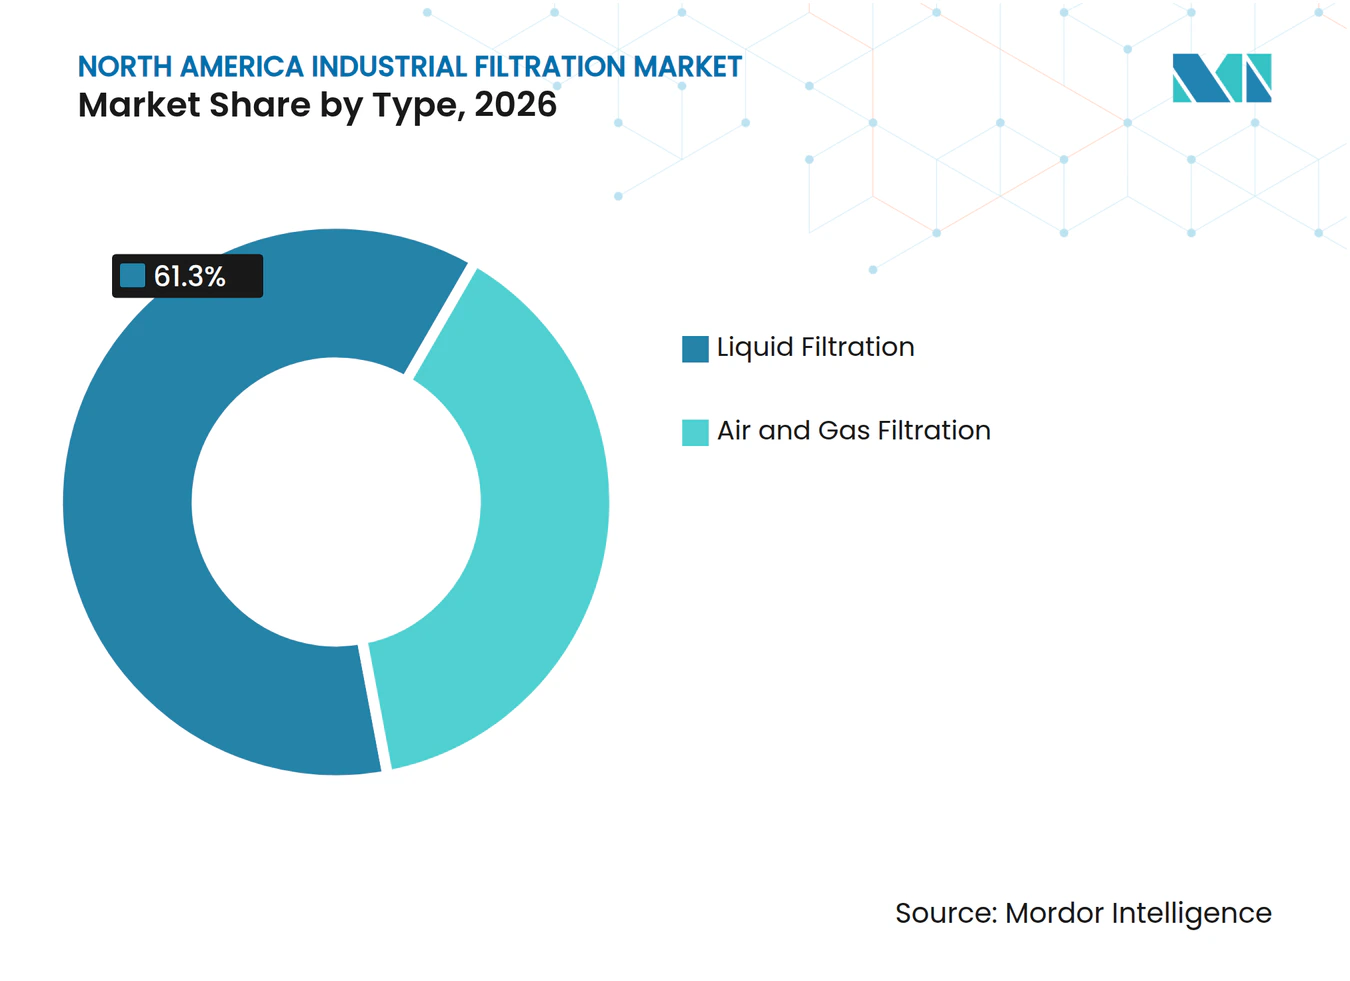
- By type, liquid filtration held a 61.3% revenue share in 2026, while air and gas filtration is projected to register the highest CAGR of 5.4% through 2032.
- By technology, mechanical filtration held a 37.4% revenue share in 2026, while membrane filtration is projected to register the highest CAGR of 6.2% through 2032.
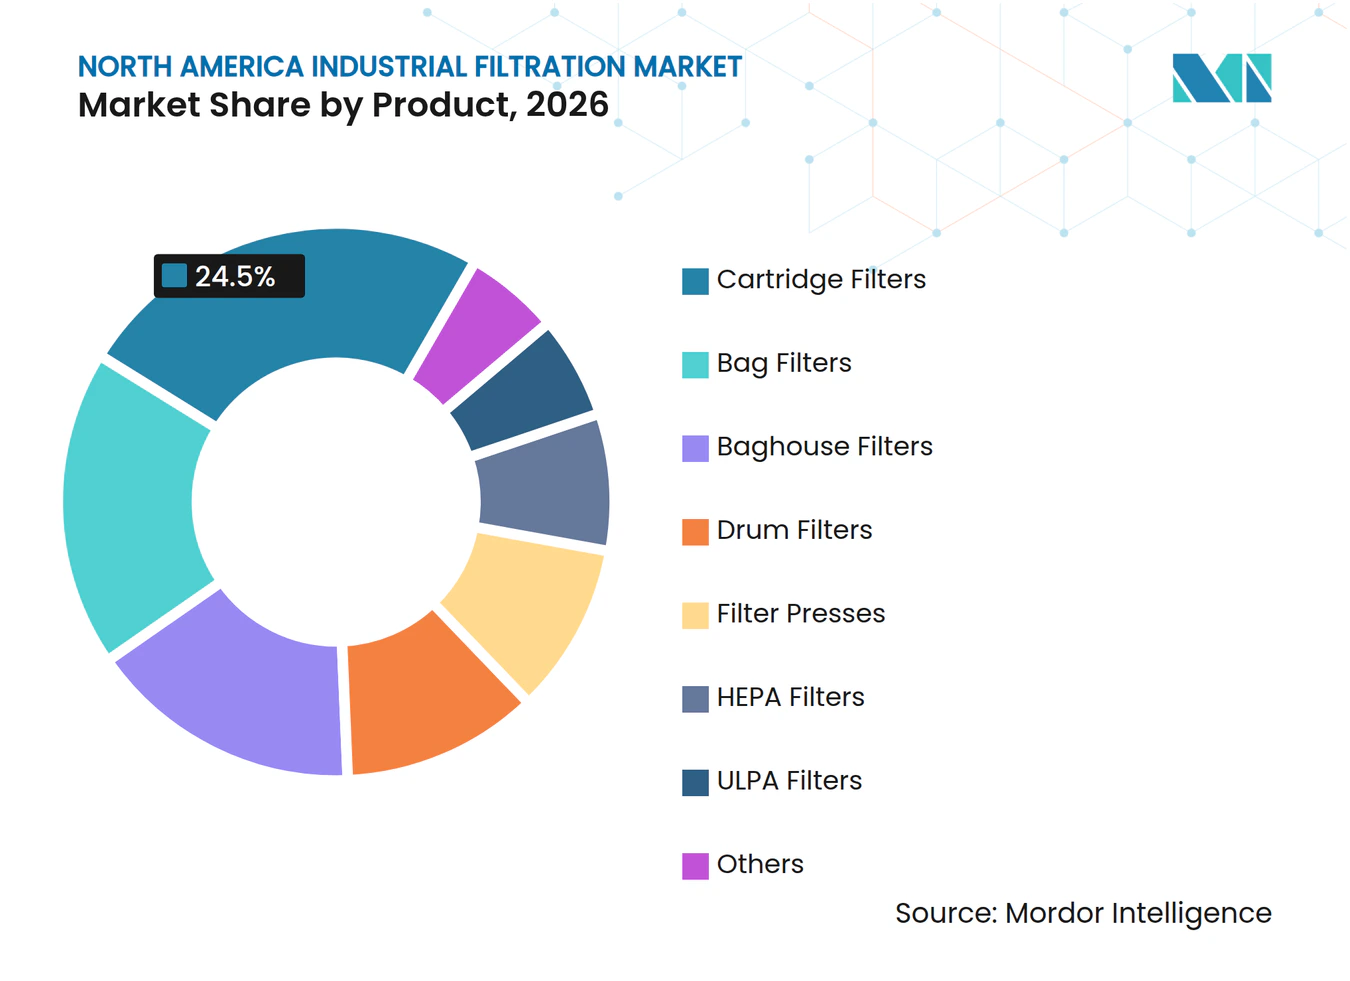
- By product, cartridge filters held a 24.5% revenue share in 2026, while filter presses are projected to register the highest CAGR of 5.5% through 2032.
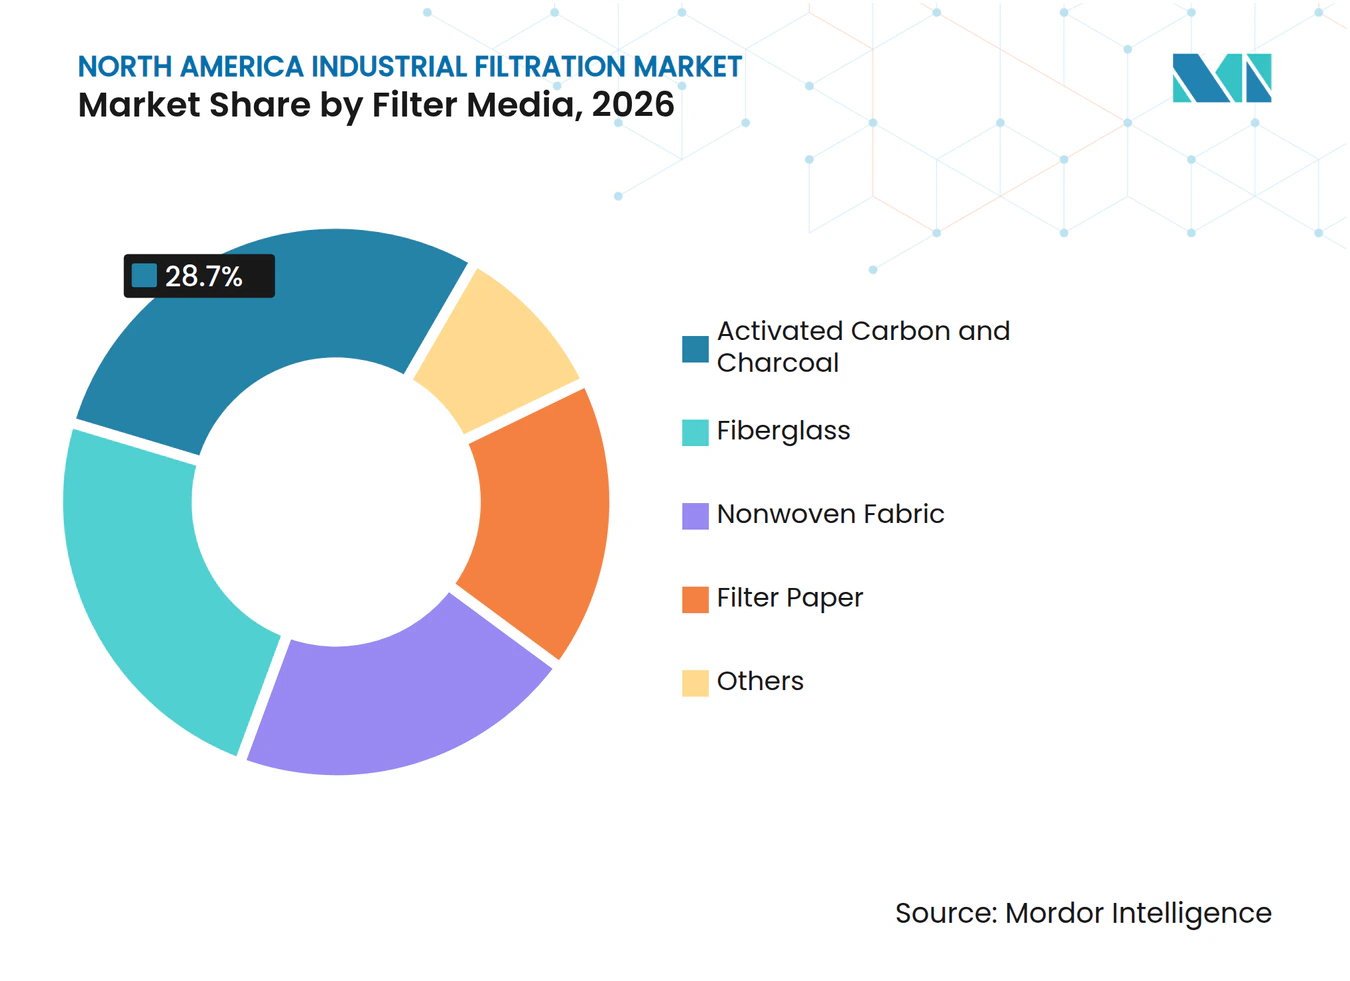
- By filter media, nonwoven fabric held a 28.7% revenue share in 2026, while activated carbon and charcoal are projected to register the highest CAGR of 5.4% through 2032.
- By application, chemicals and petrochemicals held a 22.1% revenue share in 2026, while water and wastewater treatment is projected to register the highest CAGR of 5.8% through 2032.
- By geography, the United States held an 81.8% revenue share in 2026, while Canada is projected to register the highest CAGR of 5.6% through 2032.
Note: Market numbers in this report are based on Mordor Intelligence's proprietary estimation framework, which combines nine months of actuals with Q4 projections for base year 2026.
North America Industrial Filtration Market Trends and Insights
Drivers Impact Analysis*
| Driver | (~) % Impact on CAGR Forecast | Geographic Relevance | Impact Timeline |
|---|---|---|---|
| EPA And State-Level Emission and Discharge Compliance | +1.3% | United States, with spillover to Canada and early pressure in Great Lakes, Northeast, and Pacific Coast states | Short term (≤ 2 years) |
| Semiconductor Fab Expansion and Ultra-Pure Process Filtration | +0.8% | United States, including Arizona, New York, Idaho, Ohio, Virginia, and Texas, with emerging activity in Canada | Medium term (2-4 years) |
| Industrial Water Reuse and Zero-Liquid-Discharge Investment | +0.6% | United States, especially California, Texas, and the Permian Basin, and Mexico, including Nuevo León, Baja California, and Guanajuato | Medium term (2-4 years) |
| Aging Infrastructure and Replacement-Cycle Demand | +0.5% | North America, with concentration in the U.S. Rust Belt, Midwest, and Northeast industrial corridors | Long term (≥ 4 years) |
| Smart Monitoring and Predictive Filter Maintenance | +0.4% | North America, with early deployments in U.S. industrial hubs and Canadian cleantech zones | Medium term (2-4 years) |
| High-Purity Manufacturing in Pharmaceuticals and Food Processing | +0.5% | U.S. biopharma corridors and Ontario and Québec in Canada | Medium term (2-4 years) |
| Source: Mordor Intelligence | |||
EPA and State-Level Emission and Discharge Compliance
The April 2024 federal drinking water rule for per- and polyfluoroalkyl substances (PFAS) set maximum contaminant levels of 4 parts per trillion for perfluorooctanoic acid (PFOA) and perfluorooctane sulfonate (PFOS). The rule identified granular activated carbon, reverse osmosis, and ion exchange as treatment approaches that can reduce these contaminants in drinking water. The EPA estimated that water systems must meet the limits by 2029, following monitoring and compliance planning requirements. These obligations support purchases of treatment equipment, replacement media, testing, and related operating services. The North America industrial filtration market benefits when regulated facilities must improve control of water quality or discharge performance.
The proposed 2026 Multi-Sector General Permit adds a separate monitoring requirement for industrial stormwater dischargers. The proposal includes monitoring for 40 PFAS compounds through EPA Method 1633 at covered facilities. This requirement links physical filtration equipment with sampling, measurement, and control systems. It also gives suppliers a reason to provide connected monitoring alongside filters and treatment equipment. The North America industrial filtration market therefore has demand from compliance work that continues after the original equipment installation.
Federal air rules also sustain demand for systems that control pollutants in industrial exhaust streams. The April 2026 technology review for chemical manufacturing area sources addressed hazardous air pollutant controls under the Clean Air Act. State rules can add further requirements in locations where water reuse and discharge constraints are more demanding. California’s operating environment has made recycled-water projects relevant to refinery and chemical operations. The combination of federal and state requirements supports ongoing investment in filtration trains rather than one-time purchases.
Semiconductor Fab Expansion and Ultra-Pure Process Filtration
Semiconductor Equipment and Materials International (SEMI) projects USD 60 billion in 300 mm fab equipment investment in the Americas during 2026 to 2028. Semiconductor plants require ultra-pure water for wafer processing and need filtration at several points in the production process. These systems also need high-recovery wastewater treatment, reclaim systems, and controls for chemical contamination. This creates demand for membrane systems, point-of-use filters, and related replacement products. The North America industrial filtration market is exposed to both the construction phase and the continuing operating needs of these facilities.
TSMC’s Arizona campus plans USD 165 billion of investment across several fabs. At full development, its water systems are expected to handle up to 14 million gallons per day. Such projects require water-treatment infrastructure that meets demanding purity specifications and can manage wastewater from production. The resulting filtration requirements differ from general industrial service because process reliability and contaminant control are central to production yields. This makes specification relationships and engineering support important factors for suppliers serving advanced fabs.
Gradiant reported USD 300 million in new semiconductor water treatment contracts in 2026 across 5 U.S. sites in New York, Virginia, Idaho, and Utah. The contracts cover ultra-pure water, high-recovery wastewater, scrubber reclaim, and zero liquid discharge systems. These projects show that water treatment is part of the supporting infrastructure for semiconductor expansion. They also show that suppliers can build a position through site-wide systems rather than individual filter sales. The North America industrial filtration market gains when new fabrication plants extend demand to water reuse and wastewater management.[2]
Pharmaceutical and semiconductor users have process requirements that favor high-performance membrane applications. Food and Drug Administration (FDA) current good manufacturing practice requirements require controls that prevent contamination and protect product quality in finished pharmaceuticals. Membrane integrity testing is part of the operating discipline for sterile filtration. This raises the value of validated equipment, documented maintenance, and technical service. It also reduces the ability of suppliers to compete on price alone in high-purity applications.[3]
Industrial Water Reuse and Zero-Liquid-Discharge Investment
Industrial water reuse is gaining importance where freshwater supplies are constrained and discharge capacity is limited. California’s rules for recycled water have increased the relevance of treatment projects at industrial sites. Mexico is also directing water infrastructure resources toward regions with high industrial demand. CONAGUA allocated MXN 30,800 million, equal to USD 1.66 billion at the stated 2025 average rate, for 2025 water infrastructure projects. The allocation covered water-stressed regions that included Baja California, Nuevo León, Guanajuato, and Durango.
Dow integrated a dedicated water reuse system into its Path2Zero plant expansion after facing tighter discharge limits to local waterways. The example shows how operating limits can make water treatment part of plant design rather than a stand-alone environmental project. Similar constraints can affect chemical manufacturers when receiving waters have limited capacity. Filtration, activated carbon, membrane separation, and controls can work together in these projects. The North America industrial filtration market can therefore benefit when industrial expansion occurs in areas with limited water availability.
FINSA deployed ultrafiltration and reverse osmosis at its Santa Catarina industrial park in Nuevo León in May 2026. The system aligns with ISO 16075 and ISO 23070:2020, recovers 520 m³ per day, and can reduce discharges by up to 80%. The project shows how industrial parks can adopt reuse systems before individual tenants make similar investments. It also gives nearby manufacturers a working example of treatment performance and operating requirements. This supports wider interest in filtration systems among companies expanding through nearshoring.[4]
NX Filtration received an order in 2025 to double the capacity of the Sistema de Agua Potable y Alcantarillado de León (SAPAL)'s hollow-fiber nanofiltration plant in León, Mexico. The project was designed to reach 34 million liters per day for indirect potable water reuse from municipal wastewater. The installation demonstrates the use of advanced treatment for reuse applications in Mexico. It also shows that membrane and carbon-based processes can be combined when the treatment objective is more demanding. Such applications expand the addressable use of filtration beyond conventional process water.
Smart Monitoring and Predictive Filter Maintenance
Digital monitoring is extending the value proposition of filtration systems beyond the initial equipment sale. Cleanova introduced Sentinel Connect in February 2026 for industrial baghouse and dust-collection systems. The platform sends real-time pressure, airflow, and performance information through LTE-M cellular networks. It allows operators to monitor conditions without depending on plant information technology infrastructure. The North America industrial filtration market is adding service and software elements where customers need closer visibility into equipment performance.
GEA’s InsightPartner Filtration provides real-time dashboards for membrane equipment condition and system key performance indicators. The system gives plant teams data that can support maintenance decisions and daily operations. Monitoring can help users identify performance changes before a filter failure interrupts production. It can also help avoid replacing filters earlier than necessary. These capabilities make connected systems more relevant in plants with high shutdown costs or demanding quality requirements.
A 2025 study in the International Journal of Advanced Manufacturing Technology examined a digital twin approach for predictive maintenance of a filter. The study used historical process data and XGBoost machine learning to estimate filter sleeve degradation and remaining useful life. This work supports the practical use of condition-based maintenance in industrial filtration. Vendors can use similar methods to provide maintenance advice with equipment and consumables. The approach may strengthen differentiation for suppliers that have access to operating data.
Parker Hannifin identified recurring revenue and aftermarket growth as important reasons for its Filtration Group Corporation acquisition. Consumables and service contracts create repeat customer contact after installation. Connected monitoring can help a supplier manage those relationships through routine performance data. It also supports planned replacement rather than emergency ordering. This commercial model is becoming more relevant as industrial users seek predictable uptime and maintenance budgets.
Restraints Impact Analysis*
| Restraint | (~) % Impact on CAGR Forecast | Geographic Relevance | Impact Timeline |
|---|---|---|---|
| High Capital and Lifecycle Cost of Advanced Systems | -0.9% | North America, especially small and mid-sized operators in Mexico and rural U.S. markets | Short term (≤ 2 years) |
| Energy Penalty from Pressure Drop and Membrane Operation | -0.5% | North America, especially energy-intensive Midwest and Southeast industrial clusters | Medium term (2-4 years) |
| Skilled-Service Scarcity for Complex Filtration Trains | -0.4% | North America, with greater pressure in nonmetro and rural manufacturing regions | Long term (≥ 4 years) |
| Fragmented Compliance Specifications Across North American Jurisdictions | -0.6% | North America, particularly cross-border U.S.-Canada and U.S.-Mexico operations | Medium term (2-4 years) |
| Source: Mordor Intelligence | |||
High Capital and Lifecycle Cost of Advanced Systems
Advanced filtration systems can require substantial up-front spending from industrial operators. The supplied data places membrane filtration upgrades for a medium-sized facility at USD 10 million to USD 40 million per installation. Granular activated carbon systems also need replacement every 12 to 18 months, with a cited USD 200,000 to USD 500,000 cost per cycle. These costs can be difficult for small and mid-sized operators to fund even when compliance requirements are clear. The North America industrial filtration market can face slower adoption when the cost of a complete system exceeds available capital.
The economics of zero liquid discharge and semiconductor-grade ultra-pure water systems depend on local conditions. Regulatory enforcement, water prices, and the cost of noncompliance can determine whether a project moves forward. California and urban Mexican locations have stronger reasons to invest where water constraints are more evident. Interior U.S. facilities may have a different investment case if water costs and enforcement pressures are lower. This can create different adoption patterns across the region.
Lifecycle costs also include labor, replacement media, energy, monitoring, and system maintenance. Facilities with limited engineering staff can find complex treatment trains harder to operate than basic filtration equipment. This issue is more significant where a supplier cannot provide local commissioning and service support. Suppliers that offer performance contracts or packaged support may be better placed to address this barrier. The cost challenge therefore affects both adoption and the services customers expect from vendors.
Energy Penalty from Pressure Drop and Membrane Operation
Pressure-driven membrane processes use energy to maintain the pressure needed for treatment. As membranes foul, operators may need higher operating pressure to maintain permeate flow. This increases energy use through the operating life of the system. The cost effect can lengthen the expected payback period for water treatment upgrades. Energy performance is therefore an important consideration for industrial users of membrane technology.
In membrane bioreactors for industrial wastewater treatment, air scouring can account for 30% to 50% of total system energy demand. This can make advanced treatment less attractive where electricity prices are high and regulatory pressure is limited. The issue is relevant in energy-intensive manufacturing clusters in the Midwest and Southeast. Operators must weigh water-quality benefits against electricity and maintenance costs. The restraint can be stronger for facilities that cannot pass operating costs through to customers.
Variable-frequency drives and improved setpoint management can reduce unnecessary energy use. Suppliers have used monitoring tools to help plants respond to pressure changes and equipment conditions. These capabilities can support lower operating costs, but they may also add to initial system complexity. Large plants may be better able to pay for these controls than smaller users. Energy efficiency remains a clear product differentiator when customers compare advanced treatment systems.
*Our forecasts treat driver/restraint impacts as directional, not additive. The impact forecasts reflect baseline growth, mix effects, and variable interactions.
Segment Analysis
By Type: Liquid Filtration Leads Current Demand While Air and Gas Filtration Grows With Emission Controls
Liquid filtration held 61.3% of North America industrial filtration market share in 2026. It serves chemical purification, food and beverage clarification, and sterile pharmaceutical processing. Its broad use across liquid streams gives the segment a large installed base. Filtration specifications are becoming more demanding in semiconductor and pharmaceutical applications. Industrial discharge monitoring also increases attention to water quality at the point of release.
Air and gas filtration is forecast to grow at a 5.4% CAGR through 2032. The segment is supported by air-emission requirements across industrial facilities. Chemical manufacturing controls can require upgraded pollutant-control equipment. Baghouse systems remain important for cement, metals, chemicals, and food manufacturing. Cleanova’s Sentinel Connect shows how air filtration suppliers are adding remote performance monitoring to established equipment categories.



By Technology: Mechanical Filtration Retains the Largest Base While Membrane Filtration Expands Faster
Mechanical filtration held 37.4% of North America industrial filtration market share in 2026. It has a large installed base in manufacturing, power generation, and mining. These users value reliable particulate removal and manageable maintenance needs. Retrofitting established equipment with membrane alternatives can require engineering review and operator retraining. Pressure, gravity, centrifugal, and vacuum systems also serve specialized needs across chemicals, mining, and food processing.
Membrane filtration is projected to grow at a 6.2% CAGR from 2027 to 2032. The North America industrial filtration market size for membrane applications is supported by semiconductor ultra-pure water, pharmaceutical sterile processing, and industrial water reuse requirements. FDA rules reinforce the need for controlled sterile filtration and integrity testing. Membranes are important where industrial projects require higher recovery or stricter water quality. These requirements favor suppliers with application engineering and validated process expertise.
Product: Cartridge Filters Lead Revenue While Filter Presses Benefit from Dewatering Needs
Cartridge filters held 24.5% share of the North America industrial filtration market size in 2026. Their use spans liquid and gas streams, with disposable and reusable formats available for different applications. They cover filtration needs ranging from coarse removal to sub-micron control. Frequent replacement creates an ongoing consumables requirement for users. Parker Hannifin identified aftermarket growth and recurring revenue as central considerations in the Filtration Group transaction.[5]
Filter presses are expected to grow at a 5.5% CAGR through 2032. Mining dewatering, municipal sludge management, and chemical solids recovery support demand for this equipment. These uses can make recovered cake valuable when disposal costs rise. Diemme Filtration’s AIDA System Tutor monitors filter cloth condition and cycle pressure data. ULPA filters have separate demand in semiconductor cleanrooms and pharmaceutical fill-finish facilities where low particle counts must be controlled.

By Filter Media: Nonwoven Fabric Holds the Largest Position While Activated Carbon Gains from PFAS Treatment
Nonwoven fabric held 28.7% of North America industrial filtration market share in 2026. The material is used in automotive filtration, commercial HVAC, and general industrial liquid processing. Its mechanical durability and chemical compatibility support use across many applications. Demand is spread across sectors with different investment cycles. Fiberglass remains relevant for high-temperature and corrosive streams in chemicals and power generation.
Activated carbon and charcoal is forecast to grow at a 5.4% CAGR through 2032. The EPA identifies granular activated carbon as a treatment technology that can reduce PFOA and PFOS in drinking water. The 2024 rule set 4 parts per trillion limits for those contaminants. Replacement cycles for carbon media can create repeat demand after installation. The North America industrial filtration market gains a recurring consumables component from facilities that use these systems.
By Application: Chemicals and Petrochemicals Lead Current Revenue While Water and Wastewater Treatment Grows Fastest
Chemicals and petrochemicals held 22.1% of North America industrial filtration market share in 2026. The segment uses multistage filtration for catalyst recovery, product clarification, and effluent treatment. Gulf Coast refining and specialty chemical manufacturing provide a broad base of demand. Power generation and semiconductors require dependable process control. HVAC and pharmaceutical manufacturing support demand for high-specification systems.
Water and wastewater treatment is forecast to grow at a 5.8% CAGR through 2032. AWWA estimated U.S. drinking water infrastructure needs of USD 2.1 trillion to USD 2.4 trillion between 2026 and 2050. EPA lead and copper rule revisions require replacement of an estimated 9.2 million lead service lines within 10 years. PFAS treatment, aging infrastructure, and high water demand from semiconductor projects support the application. The North America industrial filtration market has exposure through treatment equipment, replacement media, and service needs.
Geography Analysis
The United States held 81.8% of North America industrial filtration market share in 2026. Its position reflects demand across water treatment, chemicals, manufacturing, semiconductor production, and pharmaceutical processing. AWWA reported municipal water treatment construction of USD 12 billion in 2026. The reported level was 31% above 2024 and was linked to the PFAS compliance cycle. ASCE assigned U.S. drinking water infrastructure a C- grade in 2025.
The EPA has allocated USD 55 billion through the Bipartisan Infrastructure Law for water infrastructure. That allocation includes USD 15 billion for lead service line replacement. SEMI projects USD 60 billion in 300 mm fab equipment investment in the Americas from 2026 to 2028. The Micron project in Clay, New York includes a USD 1 billion industrial wastewater treatment plant.
Canada is forecast to grow at a 5.6% CAGR between 2027 and 2032. Provincial water-quality requirements and oil sands process-water management support demand for advanced treatment. Mexico is the smallest of the 3 countries by revenue share, but its adoption intensity is changing. CONAGUA’s 2025 MXN 30,800 million allocation focused on water-stressed industrial regions. Veolia Water Technologies signed a November 2025 memorandum of understanding for the Pacífico Mexinol water treatment plant in Topolobampo.
Competitive Landscape
Market Concentration
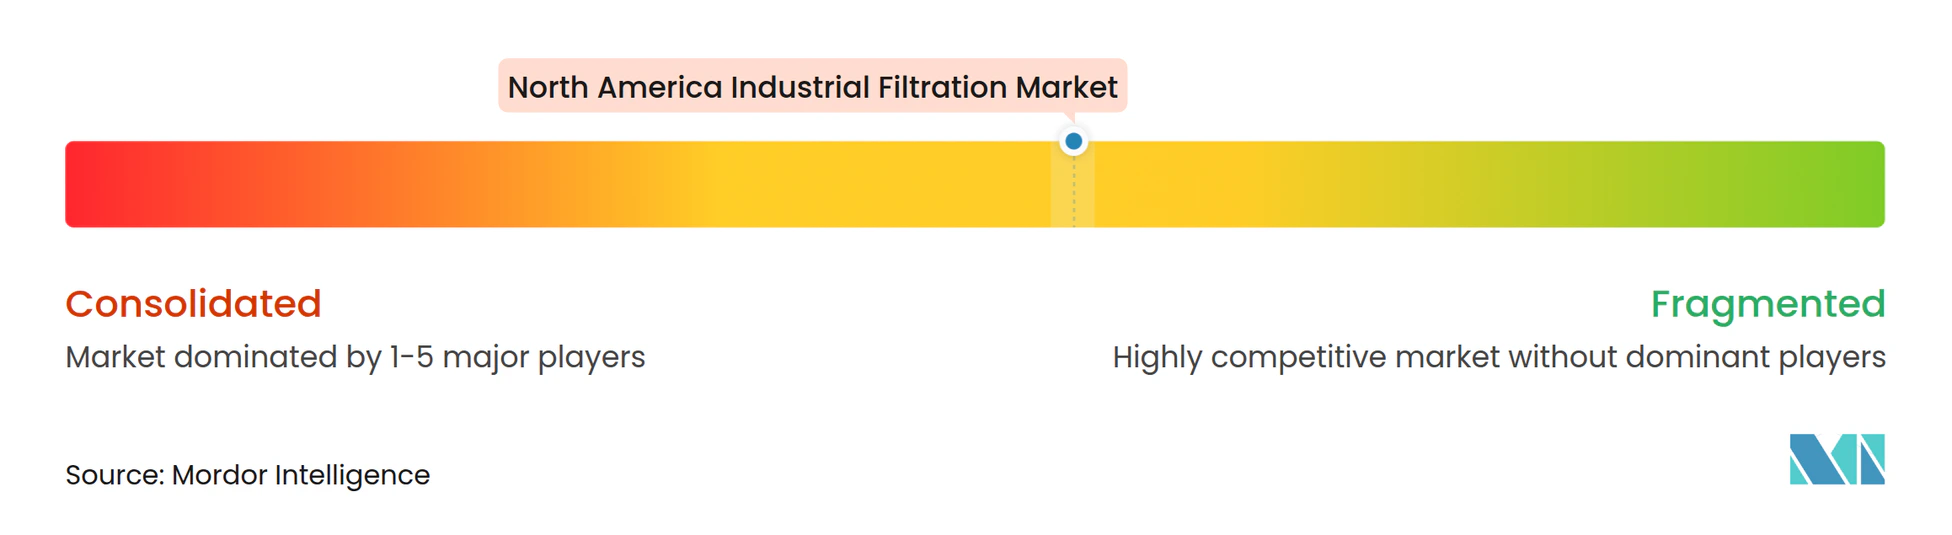
The North America industrial filtration market is moderately consolidated. Parker Hannifin, Donaldson Company, Eaton, Pentair, Camfil, and MANN+HUMMEL form an established top tier with broad product portfolios. These companies benefit from long-standing customer specifications and aftermarket consumables businesses. Replacement filters and service contracts create recurring customer relationships after initial equipment sales.
Parker Hannifin completed its USD 9.25 billion acquisition of Filtration Group Corporation in August 2026. Filtration Group is expected to contribute USD 1.8 billion to Parker fiscal 2027 sales for the first 10.5 months. The supplied information states that 60% of this amount is concentrated in North America. Parker also identified USD 220 million of targeted pretax cost synergies by year 3. Donaldson completed its USD 820 million acquisition of Facet Filtration in May 2026.
The supplied data states that 70% of Facet revenue comes from consumables with regulated replacement cycles. It also states that 57% of Facet’s 2025 revenue was generated in North America. Camfil’s purchase of FCR in early 2026 reflects interest in specialized filtration capabilities. W. L. Gore and Associates, Koch Separation Solutions, Freudenberg Filtration Technologies, LiqTech International, and Cleanova compete through application-specific products and remote monitoring. Smaller operators in Mexico and Canada may need providers that design, install, operate, and maintain systems.
North America Industrial Filtration Industry Leaders
-
Parker Hannifin Corporation
-
Danaher Corporation
-
Donaldson Company, Inc.
-
Eaton Corporation plc
-
Pentair plc
- *Disclaimer: Major Players sorted in no particular order
Recent Industry Developments
- September 2026: Gradiant announced that it has secured USD 300 million in new semiconductor water treatment contracts since the beginning of 2026. The awards cover five semiconductor fabrication sites across New York, Virginia, Idaho, and Utah, including systems for ultrapure water, high recovery wastewater treatment, scrubber reclaim, and zero liquid discharge.
- August 2026: Parker Hannifin Corporation completed its USD 9.25 billion acquisition of Filtration Group Corporation, creating one of the world’s largest industrial filtration businesses. Filtration Group Corporation is expected to contribute approximately USD 1.8 billion to Parker Hannifin Corporation’s fiscal year 2027 sales during the first 10.5 months of ownership, with North America accounting for approximately 60% of revenue.
- May 2026: Donaldson Company, Inc. completed its USD 820 million acquisition of Facet Filtration, a specialist in mission critical fuel and fluid filtration solutions. The acquisition expands Donaldson Company, Inc.’s presence in the aerospace and defense, jet fuel filtration, and power generation markets. Facet Filtration’s jet fuel filtration products are used throughout the fuel supply chain, from refineries to aircraft fueling operations.
- February 2026: Cleanova launched Sentinel Connect™, an industrial internet of things remote monitoring platform for baghouse and dust collection systems. The solution provides real time operational visibility by securely transmitting performance data to a cloud based analytics platform. It enables plant operators to monitor system health, receive automated alerts, access historical performance reports, and implement predictive maintenance strategies.
North America Industrial Filtration Market Report Scope
Industrial filtration is an engineering process used to separate or remove contaminant particles and impurities from fluids, gases, and air streams in manufacturing and process industries. By passing a process stream through a semi-permeable filter medium, it traps suspended solids, harmful microorganisms, and chemical residues while allowing the cleaned substance to pass through. This process protects industrial machinery from abrasive wear, ensures the purity and quality of end products, and reduces environmental emissions.
The North America industrial filtration market is segmented by type into air and gas filtration and liquid filtration. By technology, the market is segmented into mechanical filtration, membrane filtration, pressure filtration, gravity filtration, vacuum filtration, centrifugal filtration, and others. By product, the market is segmented into cartridge filters, bag filters, baghouse filters, drum filters, filter presses, HEPA filters, ULPA filters, and others. By filter media, the market is segmented into activated carbon and charcoal, fiberglass, nonwoven fabric, filter paper, and others. By application, the market is segmented into food and beverage, power generation, semiconductors and electronics, chemicals and petrochemicals, pharmaceutical manufacturing, metals and mining, paper and paints, oil and gas, water and wastewater treatment, automotive and transportation, and HVAC and industrial air pollution control. The report covers the market size and forecasts for the North America industrial filtration market across the United States, Canada, and Mexico. For each segment, the market sizing and forecasts have been provided on the basis of value (USD).
| Air and Gas Filtration |
| Liquid Filtration |
| Mechanical Filtration |
| Membrane Filtration |
| Pressure Filtration |
| Gravity Filtration |
| Vacuum Filtration |
| Centrifugal Filtration |
| Others |
| Cartridge Filters |
| Bag Filters |
| Baghouse Filters |
| Drum Filters |
| Filter Presses |
| HEPA Filters |
| ULPA Filters |
| Others |
| Activated Carbon and Charcoal |
| Fiberglass |
| Nonwoven Fabric |
| Filter Paper |
| Others |
| Food and Beverage |
| Power Generation |
| Semiconductors and Electronics |
| Chemicals and Petrochemicals |
| Pharmaceutical Manufacturing |
| Metals and Mining |
| Paper and Paints |
| Oil and Gas |
| Water and Wastewater Treatment |
| Automotive and Transportation |
| HVAC and Industrial Air Pollution Control |
| United States |
| Canada |
| Mexico |
| By Type | Air and Gas Filtration |
| Liquid Filtration | |
| By Technology | Mechanical Filtration |
| Membrane Filtration | |
| Pressure Filtration | |
| Gravity Filtration | |
| Vacuum Filtration | |
| Centrifugal Filtration | |
| Others | |
| By Product | Cartridge Filters |
| Bag Filters | |
| Baghouse Filters | |
| Drum Filters | |
| Filter Presses | |
| HEPA Filters | |
| ULPA Filters | |
| Others | |
| By Filter Media | Activated Carbon and Charcoal |
| Fiberglass | |
| Nonwoven Fabric | |
| Filter Paper | |
| Others | |
| By Application | Food and Beverage |
| Power Generation | |
| Semiconductors and Electronics | |
| Chemicals and Petrochemicals | |
| Pharmaceutical Manufacturing | |
| Metals and Mining | |
| Paper and Paints | |
| Oil and Gas | |
| Water and Wastewater Treatment | |
| Automotive and Transportation | |
| HVAC and Industrial Air Pollution Control | |
| By Geography | United States |
| Canada | |
| Mexico |
Key Questions Answered in the Report
What is the forecast growth rate for the North America industrial filtration market?
The North America industrial filtration market is forecast to grow at a 4.87% CAGR from 2027 to 2032, rising from USD 20.24 billion in 2027 to USD 25.67billion in 2032.
Which filtration application is growing fastest in North America?
Water and wastewater treatment is the fastest-growing application, with a projected 5.8% CAGR through 2032.
Why is membrane filtration growing faster than other technologies?
Membrane filtration is projected to grow at a 6.2% CAGR because semiconductor water systems, pharmaceutical sterile processing, and industrial reuse projects require high treatment performance.
Which country holds the largest regional revenue share?
The United States held 81.8% of regional revenue in 2026, supported by water infrastructure investment, industrial activity, and semiconductor investments.
What is driving activated carbon demand in this market?
Activated carbon and charcoal is projected to grow at a 5.4% CAGR because United States Environmental Protection Agency per- and polyfluoroalkyl substances requirements identify granular activated carbon as a treatment option for affected drinking water systems.