
North America Advertising Video-on-Demand (AVOD) Market Size and Share
Market Overview
| Study Period | 2020 - 2031 |
|---|---|
| Forecast Data Period | 2026 - 2031 |
| Base Year Market Size (2025) | USD 38.20 Billion |
| Market Size (2026) | USD 40.53 Billion |
| Market Size (2031) | USD 62.99 Billion |
| Growth Rate (2026 - 2031) | 9.22 % |
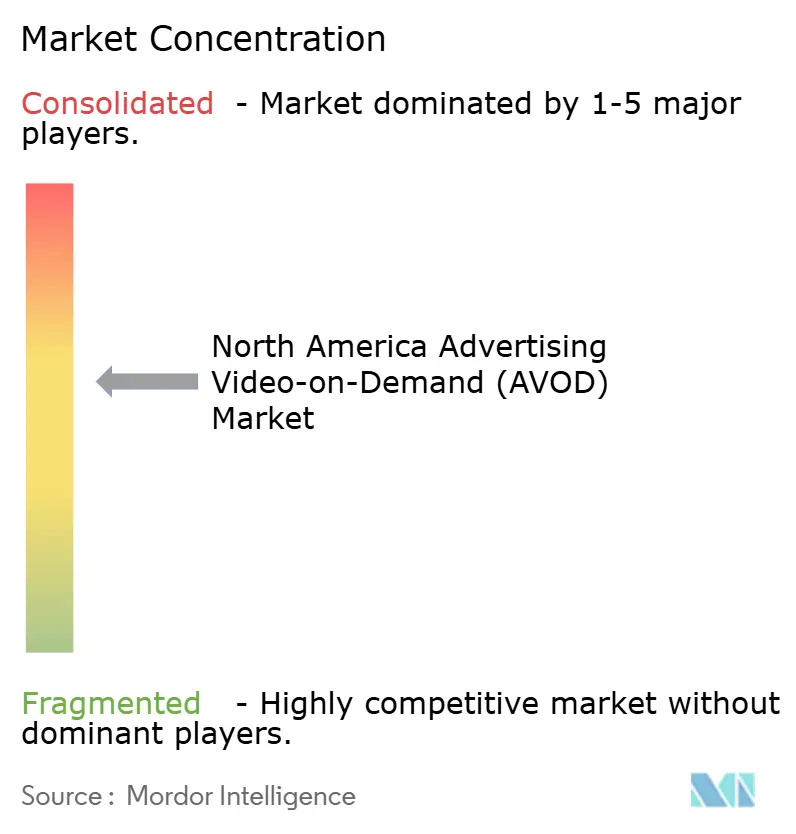
| Market Concentration | Medium |
Major Players *Disclaimer: Major Players sorted in no particular order Image © Mordor Intelligence. Reuse requires attribution under CC BY 4.0. | |
North America Advertising Video-on-Demand (AVOD) Market Analysis by Mordor Intelligence
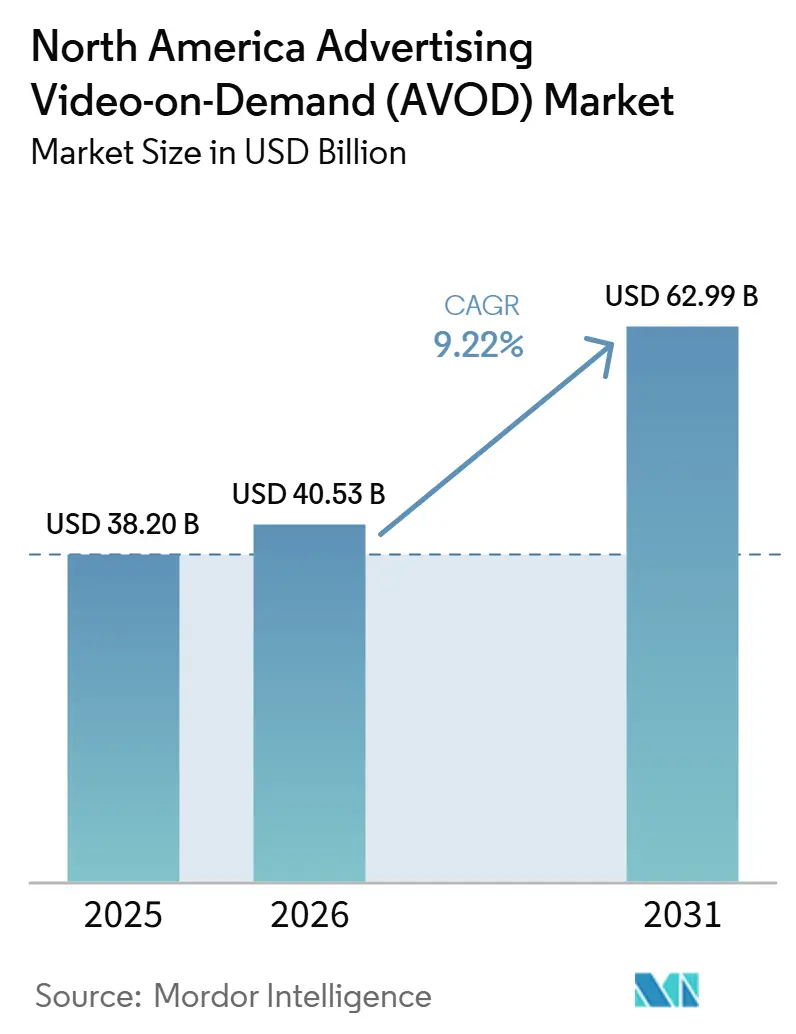
The North America advertising video-on-demand (AVOD) market size was valued at USD 38.20 billion in 2025 and is estimated to grow from USD 40.53 billion in 2026 to reach USD 62.99 billion by 2031, at a CAGR of 9.22% during the forecast period (2026-2031). The market is being reshaped as households move from bundled pay television toward free and lower-cost streaming options. Advertisers are shifting budgets toward connected television because it can support audience targeting and campaign measurement across digital environments. The growth of free ad-supported streaming television and ad-supported subscription tiers is expanding the inventory available to advertisers. Platform owners with first-party audience data and control over device home screens hold an advantage in audience discovery, ad sales, and campaign measurement. Measurement differences across closed platforms remain a constraint, making it difficult for advertisers to manage reach and frequency across services.
Key Report Takeaways
- By content type, TV shows and episodic content accounted for 38.51% of revenue in 2025 for the North America advertising video-on-demand (AVOD) market, while documentaries are projected to expand at a 9.83% CAGR through 2031.
- By device type, smartphones and tablets accounted for 27.99% of revenue in 2025, while smart TVs are projected to grow at a 9.58% CAGR through 2031.
- By end-user, media and entertainment held 39.71% revenue share in 2025, while retail and e-commerce are projected to expand at a 10.06% CAGR through 2031.
- By ad format, pre-roll held 40.21% revenue share in 2025, while mid-roll is projected to expand at a 9.91% CAGR through 2031.
- By geography, the United States held 88.43% of the North America AVOD market share in 2025, while Mexico is projected to expand at a 9.88% CAGR through 2031.
Note: Market size and forecast figures in this report are generated using Mordor Intelligence’s proprietary estimation framework, updated with the latest available data and insights as of January 2026.
North America Advertising Video-on-Demand (AVOD) Market Trends and Insights
Drivers Impact Analysis*
| Driver | (~) % Impact on CAGR Forecast Market | Geographic Relevance | Impact Timeline |
|---|---|---|---|
| Ongoing Cord-Cutting and Subscription Fatigue | +2.8% | United States and Canada core, spillover to Mexico | Short term (≤ 2 years) |
| Migration of Linear TV Budgets to CTV and AVOD | +2.5% | United States-led, national, with early gains in key DMA markets | Medium term (2-4 years) |
| Demand for Addressable and Measurable Video Advertising | +1.8% | United States-primary, spillover to Canada | Medium term (2-4 years) |
| Expansion of FAST and Ad-Supported Streaming Inventory | +1.5% | United States and Canada core, spillover to Mexico | Short term (≤ 2 years) |
| Streaming-Exclusive Live Sports and Premium Event Inventory | +1.0% | United States, Canada, and Mexico, including the 2026 FIFA World Cup | Short term (≤ 2 years) |
| Retail Media and Shoppable Video Convergence | +0.8% | United States-led, with early gains in Canada | Medium term (2-4 years) |
| Source: Mordor Intelligence | |||
Ongoing Cord-Cutting and Subscription Fatigue
Cord-cutting has become a structural condition for the North America advertising video-on-demand (AVOD) market because it moves viewing time from traditional television packages to streaming services. Traditional bundled pay television fell to 43.2 million US households in 2026, down from 83.5 million households in 2016. Streaming subscription costs rose 19.5% in 2025, while the overall inflation rate was 2.7%, thereby increasing the appeal of free and ad-supported services. Netflix raised the monthly price of its Standard with Ads plan from USD 6.99 to USD 8.99, reinforcing the price difference between paid tiers and free viewing options. Ad-supported tiers accounted for 46% of premium subscription video-on-demand subscriptions in 2026, indicating that advertising inventory is also growing within services that began as subscription-led platforms.[1]
Migration of Linear TV Budgets to CTV and AVOD
The shift of advertising budgets from linear television to connected television supports the North America advertising video-on-demand (AVOD) market, as streaming inventory provides a direct alternative for television buyers. Connected TV advertising spending increased 16% in 2025, and digital video represented nearly 60% of total US television and video advertising spending by year-end. A 2026 survey commissioned by Premion found that 70% of US advertisers planned to increase connected TV investment by an average of 17%. The additional investment is expected to come from linear television, digital display, paid search, and social media budgets. National and local linear television advertising, excluding political spending, is projected to decline 2.4% to USD 27.9 billion in 2026, while digital television formats are expected to grow 3% to USD 21 billion. The shift means AVOD providers compete directly with linear sellers for agency relationships and television budgets rather than only seeking new advertising spending.
Demand for Addressable and Measurable Video Advertising
Addressable advertising is a major advantage for the North America AVOD market because advertisers can target audiences more precisely than on traditional broadcast television. The available input projected connected TV revenue at USD 20.5 billion in 2025 and USD 30 billion by 2029, reflecting demand for personalized and outcome-based formats. A 2026 Gracenote survey found that 52% of surveyed U.S. brands in technology, financial services, retail, and healthcare had shifted at least 25% of their paid media budgets to connected TV over the prior 3 years. The same survey found that 32% of brand and agency executives considered their connected TV advertising not very effective. The CIMM and 4A’s study found that fragmented metrics and incompatible identity systems can lead to conflicting measurement results across platforms. This creates a greater opportunity for services that can provide reliable attribution while limiting the complexity advertisers face.
Expansion of FAST and Ad-Supported Streaming Inventory
The expansion of free ad-supported streaming television is increasing the amount of inventory available across the North America advertising video-on-demand (AVOD) market. Amagi recorded 6,500 FAST channel deliveries and reported 55% year-over-year growth in global FAST viewing hours during April through June 2026. The United States and Canada accounted for 54% of viewing hours and 74% of ad impressions in that period, confirming the region’s importance to FAST monetization. FAST reached 131.4 million US viewers in 2026, or 54% of all connected TV users, while daily viewing time was expected to rise 9.9% to 23 minutes per viewer. News programming on FAST increased 40.6% from January 2025, while documentaries and dramas supplied the largest volume of FAST content hours. Content specialization can improve the appeal of FAST inventory to advertisers that seek defined audiences and brand-suitable programming environments.
Restraints Impact Analysis*
| Restraint | (~) % Impact on CAGR Forecast | Geographic Relevance | Impact Timeline |
|---|---|---|---|
| Content Licensing and Premium Rights Cost Inflation | -1.5% | United States-led, with direct cost effects in Canada | Medium term (2-4 years) |
| Measurement Fragmentation Across Walled Gardens | -1.2% | United States and Canada core, spillover to Mexico | Long term (≥ 4 years) |
| Repetitive Ad Loads and Viewer Churn | -0.7% | Global, with primary concentration in the United States | Short term (≤ 2 years) |
| Platform Gatekeeping and Home-Screen Access Fees | -0.5% | United States and Canada, with emerging regulatory attention in the European Union | Medium term (2-4 years) |
| Source: Mordor Intelligence | |||
Content Licensing and Premium Rights Cost Inflation
Rising content acquisition costs constrain the North America advertising video-on-demand (AVOD) market because larger libraries and exclusive programming are needed to compete for viewers and advertising demand. The NBA rights structure, which began with the 2025-26 season, was valued at USD 7.5 billion per year, and Amazon signed an 11-year Thursday Night Football agreement valued at USD 13 billion.[2] Netflix’s annual content spending stands at USD 19 billion in 2026, based on its public disclosures. Standard rights reversion windows of 18 to 36 months reduce the duration of exclusive access, which can support high licensing costs. Licensing, windowing, syndication, and royalty requirements impose a greater burden on smaller operators than on vertically integrated platforms with broader negotiating power.
Measurement Fragmentation Across Walled Gardens
Measurement fragmentation is a long-term restraint on the North America AVOD market because advertisers cannot easily compare campaign results across closed streaming platforms. The 2025 CIMM and 4A’s study found that platform-specific metrics, incompatible identity systems, and differing methodologies can create competing versions of truth for advertisers. This makes it harder for buyers to assess incremental reach, control ad frequency, and attribute outcomes across connected TV campaigns. NBCUniversal used 6 measurement vendors for its 2026 upfront, showing that no single provider was considered sufficient for a cross-platform campaign. Omnicom’s Q2 2026 initiative allowed Creative ID data to enter a multi-platform clean-room environment, demonstrating the demand for a more unified approach. The gap favors platforms with strong first-party reporting, while smaller advertisers may delay investment when they cannot independently verify performance across services.
*Our forecasts treat driver/restraint impacts as directional, not additive. The impact forecasts reflect baseline growth, mix effects, and variable interactions.
Segment Analysis
By Content Type: Serial Programming Led Revenue While Documentaries Expanded Fastest
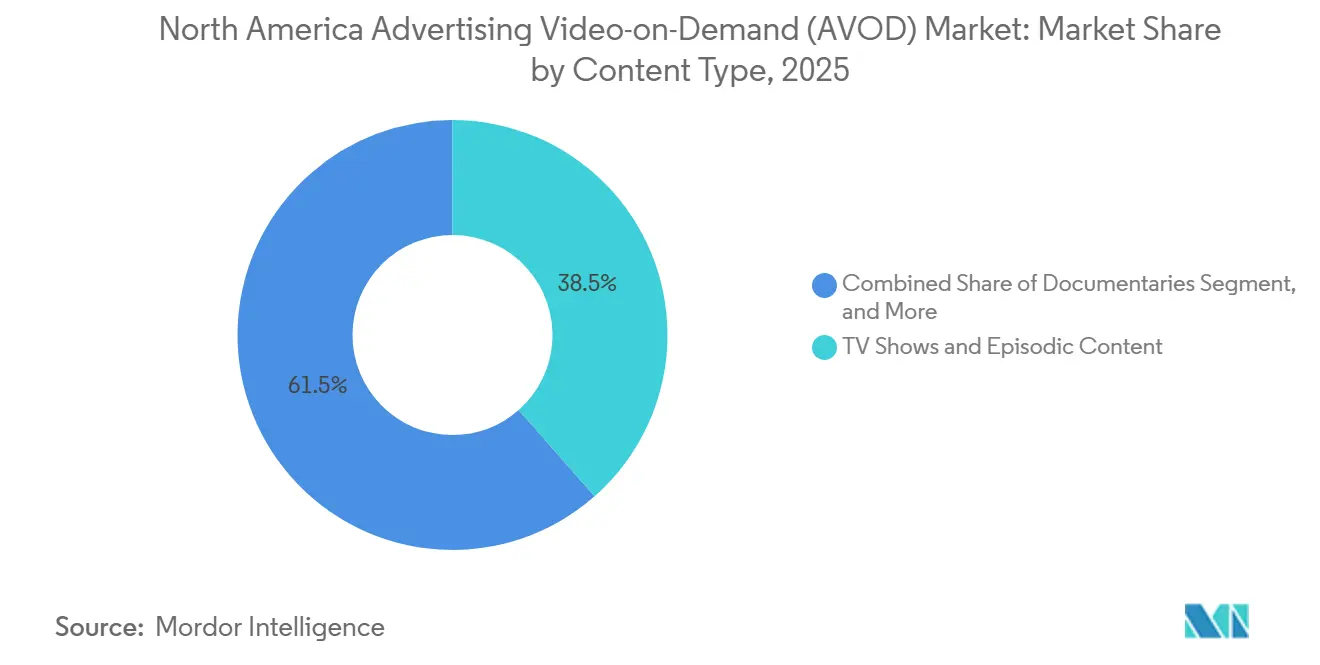
TV Shows and Episodic Content accounted for 38.51% of content-type revenue in 2025. Serial programming provides recurring audiences, predictable session lengths, and familiar advertising breaks that align with established television buying practices. Its broad catalog depth also helps general-entertainment platforms sustain viewing across different times of day. Movies and Films remained an important secondary content category because licensed theatrical titles add inventory and can support longer viewing sessions.
Documentaries are projected to grow at a 9.83% CAGR from 2026 to 2031. The format can appeal to advertisers because its subject matter supports interest-based targeting, and its long-form structure can support viewer completion. Ionic Studios took a strategic equity stake in Documentary+ in June 2026 and became the Publisher of Record for its AVOD and FAST channel business. The transaction reflected growing interest in nonfiction programming as a distinct source of advertising inventory. Other content types, including short-form and creator-led programming, are gaining relevance as platforms add creators who can attract younger audiences that previously engaged less with conventional AVOD formats.

By Device Type: Mobile Led Viewing While Smart TVs Changed Discovery and Ad Sales
Smart TVs are projected to expand at a 9.58% CAGR from 2026 to 2031, making them the fastest-growing device category. Their growth is tied to the television operating system's role in content discovery, advertising delivery, and audience data collection. The Video Advertising Bureau reported that 95% of connected televisions display advertising on the home screen when powered on. This gives device platforms a position in the advertising journey before a viewer enters a streaming application.
Smartphones and tablets accounted for 27.99% of the North America advertising video-on-demand (AVOD) market in 2025. Mobile viewing remains important among younger audiences and in Mexico, where mobile access can precede fixed household broadband. This device base supports continued access to the North America advertising video-on-demand (AVOD) market among consumers who watch short sessions outside the home. A survey of 63 senior streaming executives found that 62% regarded Roku as the most strategically important connected TV platform for home-screen visibility. Laptops and Desktops continued to serve workplace, commute, and remote-viewing use cases, especially for news and business programming. Game consoles and set-top boxes provided a stable, supporting inventory for premium broadcast simulcasts and live events.
By End-User: Media and Entertainment Led Spending While Retail and E-Commerce Grew Fastest
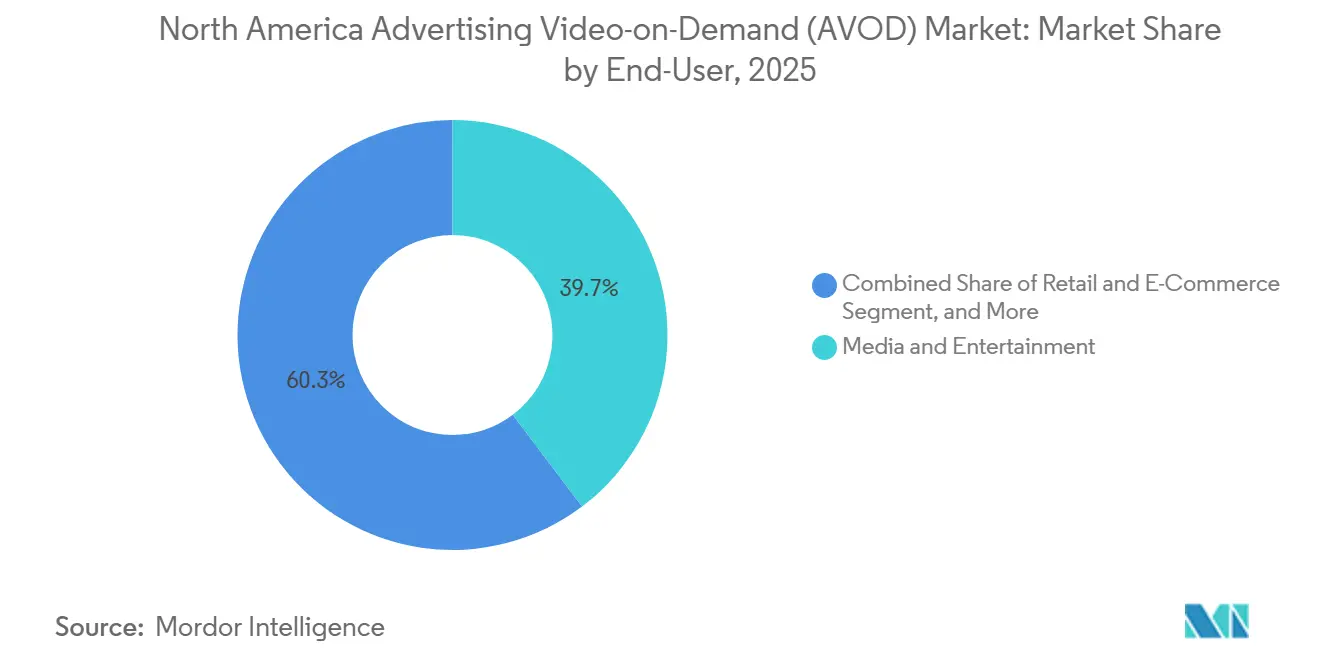
Media and Entertainment accounted for 39.71% share of the North America advertising video-on-demand (AVOD) market size in 2025. The sector has a natural fit with video advertising because its products are promoted in the same screen-based environment in which consumers view content. This alignment can support higher pricing than categories with a weaker connection to entertainment programming. Banking, Financial Services, and Insurance, along with Information Technology and Telecommunications, remained important advertisers because connected TV can support targeted campaigns for financial products and technology services.
Retail and E-Commerce are projected to grow at a 10.06% CAGR from 2026 to 2031. Dentsu reported that off-site retail media represented 53% of brand retail media spending in 2025, with connected TV serving as a major channel for that off-site activity. Walmart, Target, and Amazon announced separate shoppable connected TV initiatives in late June 2026. Education and Healthcare remained smaller advertising categories, but could benefit from streaming environments that offer relevant contextual programming. Documentary and drama content on FAST can reach viewers with above-average educational attainment, which can be useful for education and healthcare advertisers.
By Ad Format: Pre-Roll Held the Largest Position While Mid-Roll Grew Fastest
Pre-Roll held a 40.21% revenue share in 2025. The format appears before the selected content begins, giving advertisers a high-attention placement before viewers start watching a program. Media buyers cited in the supplied research indicated that Netflix's live sports inventory commands premium CPMs. This pricing trend showed that premium streaming sports can achieve rates comparable to historic broadcast sports placements. The placement also allows advertisers to reach viewers at a point of strong intent, before audience attention shifts to the live event or program. As streaming platforms expand their live sports offerings, such inventory is likely to remain attractive to brands seeking broad reach, appointment viewing, and high engagement.
Mid-Roll is projected to grow at a 9.91% CAGR from 2026 to 2031. Amazon increased Prime Video advertising load to 4 to 6 minutes per hour in 2025, from an initial 2 to 3.5 minutes per hour. Post-Roll remained smaller and depends more heavily on completion rates, which can make it better suited to long-form documentaries and other programming with committed audiences. Samsung and Amazon announced remote-enabled Interactive Video Ad technology for Samsung TV Plus at the 2026 IAB NewFronts. The IAB Tech Lab finalized guidance for 6 connected TV ad formats in July 2026, including pause ads, which support broader programmatic use beyond pre-roll placements.
Geography Analysis
The United States held 88.43% of the North America advertising video-on-demand (AVOD) market share in 2025. US connected TV advertising spending stood at USD 37.95 billion in 2026 and is expected to exceed USD 52.53 billion by 2029. The country benefits from a large supply of English-language programming, extensive advertiser demand, and established device ecosystems. Alphabet reported USD 11.055 billion in YouTube advertising revenue for Q2 2026, up 13% year over year, and introduced Buy with Google Pay for direct purchase completion on connected TV. Digital video surpassed linear television for the first time in 2024 and accounted for nearly 60% of total U.S. television and video advertising spending at year-end 2025.
Canada had 26.6 million people reachable with streaming advertising in 2026, representing 78% of adults aged 18 and above. Canada’s digital advertising spending rose 16% year over year to CAD 21.1 billion (USD 15.5 billion) in 2025, while video spending rose 26%.[3] The Canadian digital advertising sector is projected to reach CAD 24.9 billion (USD 18.3 billion) in 2026. In-stream and connected TV advertising account for much of the video revenue, while direct buying led at 71%.
Mexico is projected to grow at a 9.88% CAGR from 2026 to 2031, the fastest rate in the North America advertising video-on-demand (AVOD) market. Rising smartphone use and price sensitivity favor free viewing options over paid subscriptions. These conditions give the market a different growth base in Mexico than in the United States and Canada. The supplied research identified ViX FAST channels as generating USD 219 million during the 2026-2031 forecast window, while YouTube, Tubi, and Pluto TV were expanding Spanish-language inventory. Pay television is declining as consumers adopt streaming alternatives, including FAST, AVOD, and subscription video services. U.S.-originating platforms can extend Spanish-language libraries into Mexico without incurring the full cost of local production, supporting platform entry and advertising interest.
Competitive Landscape
The North America advertising video-on-demand (AVOD) market is dominated by a concentrated group of major platform operators, alongside independent publishers, FAST aggregators, and specialized services. Alphabet, Amazon, Roku, and Fox Corporation have advantages because they control large audience bases, premium inventory, or key distribution points. The North America AVOD market also depends on these operators for much of the infrastructure that connects viewing, advertising delivery, and audience data. YouTube accounted for 13.5% of all US television viewing in March 2026, the highest share for any single streamer in Nielsen’s Gauge report. Roku surpassed 100 million streaming households globally in Q1 2026, while its platform revenue rose 28% year over year to USD 1.13 billion, and advertising revenue increased 27%.[4] Tubi reported 23% revenue growth and more than 100 million monthly active users who streamed more than 1 billion hours of content each month, while operating at break-even or better for the third consecutive quarter.
Competition also centers on technology that connects demand-side buying with publisher inventory. The Trade Desk introduced programmatic access to connected TV pause ads through its Kokai platform in Q2 2026. PubMatic launched Creator Marketplace in June 2026 to connect premium creator-led connected TV inventory with programmatic and agentic demand, with MeatEater as the first launch partner. Magnite reported that connected TV accounted for more than 50% of its total business in Q1 2026. These developments indicate that supply-side firms are seeking roles in new ad formats and creator-led inventory as platforms strengthen direct advertising relationships.
Strategic activity is also changing the range of services available to advertisers. Samsung partnered with Amazon Ads to introduce interactive video advertising technology to Samsung TV Plus, allowing device distribution to support commerce-oriented advertising. Paramount Skydance and Warner Bros. Discovery announced a merger agreement in February 2026, valued at USD 110 billion in enterprise value, with closing expected in Q3 2026, subject to regulatory clearance. DAZN secured exclusive digital rights to MSG and YES networks in July 2026, adding regional sports programming to its North American position. The strongest openings remain in show-level targeting, cross-platform identity resolution, and interactive formats that can link viewing to commerce.
North America Advertising Video-on-Demand (AVOD) Industry Leaders
-
Alphabet Inc.
-
The Walt Disney Company
-
Amazon.com, Inc.
-
Roku, Inc.
-
Fox Corporation
- *Disclaimer: Major Players sorted in no particular order
Recent Industry Developments
- July 2026: DAZN secured exclusive digital streaming rights to the MSG and YES networks, covering the New York Knicks, Rangers, Islanders, Devils, Sabers, Yankees, and Nets, with minimum rights guarantees per team ranging from USD 8 million to over USD 20 million, plus a revenue-sharing model covering advertising, virtual signage, and subscription fees. The deal restructures local sports AVOD rights within the largest US media market and marks a breakthrough in DAZN’s regional sports network strategy in North America.
- July 2026: Alphabet reported Q2 2026 YouTube advertising revenue of USD 11.055 billion, up 13% year over year, per its Q2 2026 SEC filing. The earnings report also detailed the launch of Buy with Google Pay on connected TV, enabling viewers to complete purchases directly on the CTV screen, a shoppable capability that extends YouTube’s AVOD monetization from awareness to transaction.
- July 2026: NBCUniversal and YouTube announced a multiyear deal to bundle Peacock Premium with YouTube Premium beginning in 2027, representing Peacock’s largest wholesale distribution partnership to date. The agreement was first reported by Variety and confirmed by both companies. It also extends NBCUniversal’s distribution deal with YouTube TV for linear channel carriage and positions Peacock Premium for inclusion in YouTube Primetime Channels as a standalone add-on later in 2026.
- June 2026: Ionic Studios took a strategic equity stake in Documentary+ and assumed Publisher of Record responsibilities for its AVOD and FAST channel business through its Emerging Channels Fund. The deal creates an institutional monetization infrastructure for the premium documentary streaming platform and reflects capital markets’ growing recognition of nonfiction content as a discrete and scalable AVOD asset class.
North America Advertising Video-on-Demand (AVOD) Market Report Scope
The North America Advertising Video-on-Demand (AVOD) Market comprises digital streaming platforms, content publishers, advertising technology providers, and media companies that deliver video content to consumers over the internet at no or reduced subscription cost, with revenues primarily generated through advertising. AVOD services enable viewers to access on-demand entertainment and informational content, while advertisers reach targeted audiences through digital video advertisements delivered across connected devices.
The North America Advertising Video-on-Demand (AVOD) Market Report is Segmented by Content Type (Movies and Films, TV Shows and Episodic Content, Documentaries, and Other Content Types), Device Type (Smartphones and Tablets, Smart TVs, Laptops and Desktops, and Other Device Types), End-User (Media and Entertainment, Retail and E-Commerce, Banking, Financial Services, and Insurance, Education, Information Technology and Telecommunications, Healthcare, and Other End-User Industries), Ad Format (Pre-Roll, Mid-Roll, Post-Roll, and Interactive and Shoppable Video), and Geography (United States, Canada, and Mexico). The Market Forecasts are Provided in Terms of Value (USD).
| Movies and Films |
| TV Shows and Episodic Content |
| Documentaries |
| Other Content Types |
| Smartphones and Tablets |
| Smart TVs |
| Laptops and Desktops |
| Other Device Types |
| Media and Entertainment |
| Retail and E-Commerce |
| Banking, Financial Services, and Insurance |
| Education |
| Information Technology and Telecommunications |
| Healthcare |
| Other End-User Industries |
| Pre-Roll |
| Mid-Roll |
| Post-Roll |
| Interactive and Shoppable Video |
| United States |
| Canada |
| Mexico |
| By Content Type | Movies and Films |
| TV Shows and Episodic Content | |
| Documentaries | |
| Other Content Types | |
| By Device Type | Smartphones and Tablets |
| Smart TVs | |
| Laptops and Desktops | |
| Other Device Types | |
| By End-User | Media and Entertainment |
| Retail and E-Commerce | |
| Banking, Financial Services, and Insurance | |
| Education | |
| Information Technology and Telecommunications | |
| Healthcare | |
| Other End-User Industries | |
| By Ad Format | Pre-Roll |
| Mid-Roll | |
| Post-Roll | |
| Interactive and Shoppable Video | |
| By Geography | United States |
| Canada | |
| Mexico |
Key Questions Answered in the Report
What is the North America AVOD market size?
The North America AVOD market was valued at USD 38.20 billion in 2025, is estimated at USD 40.53 billion in 2026, and is projected to reach USD 62.99 billion by 2031 at a 9.22% CAGR.
What is driving advertising video-on-demand growth in North America?
Cord-cutting, subscription price increases, connected TV budget migration, and the expansion of FAST services are increasing viewing and advertising inventory.
Which content category leads advertising video-on-demand revenue?
TV Shows and Episodic Content led content type revenue with a 38.51% share in 2025, while Documentaries are projected to grow fastest at a 9.83% CAGR.
Which devices are most important for advertising video-on-demand viewing?
Smartphones and Tablets held a 27.99% share in 2025, while Smart TVs are projected to grow fastest at a 9.58% CAGR through 2031.
Which end-user category is expanding most quickly in AVOD advertising?
Retail and E-Commerce are projected to grow at a 10.06% CAGR through 2031 as retailers expand shoppable connected TV and off-site retail media activity.
Which country is growing fastest in North American AVOD?
Mexico is projected to grow at a 9.88% CAGR through 2031, supported by smartphone use, price-sensitive audiences, and expanding Spanish-language streaming inventory.