New Zealand Data Center Cooling Market Size and Share
Market Overview
| Study Period | 2020 - 2031 |
|---|---|
| Forecast Data Period | 2026 - 2031 |
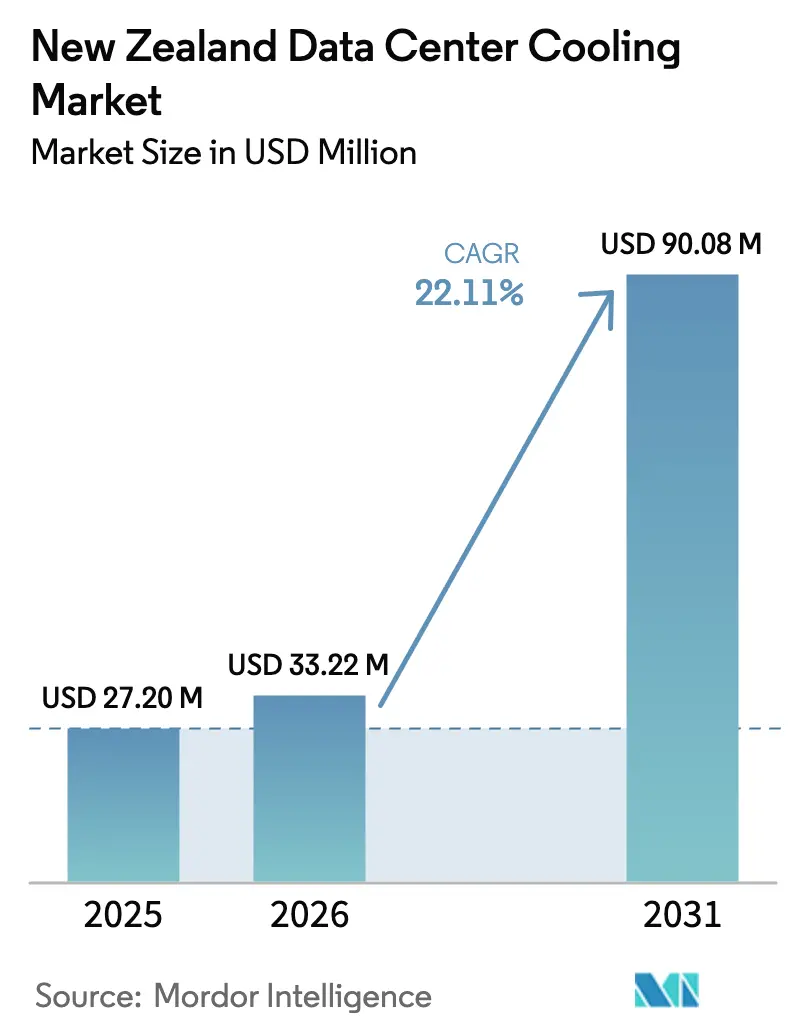
| Base Year Market Size (2025) | USD 27.2 Million |
| Market Size (2026) | USD 33.22 Million |
| Market Size (2031) | USD 90.08 Million |
| Growth Rate (2026 - 2031) | 22.11% CAGR |
| Market Concentration | Medium |
Major Players *Disclaimer: Major Players sorted in no particular order Image © Mordor Intelligence. Reuse requires attribution under CC BY 4.0. | |
New Zealand Data Center Cooling Market Analysis by Mordor Intelligence
The New Zealand data center cooling market size in 2026 is estimated at USD 33.22 million, growing from 2025 value of USD 27.2 million with 2031 projections showing USD 90.08 million, growing at 22.11% CAGR over 2026-2031. Growth is propelled by hyperscale capital expenditure from Microsoft, Amazon Web Services (AWS), and other global cloud majors, each prioritizing carbon-neutral operations that require highly efficient thermal management systems. Liquid-based cooling gains momentum as high-density AI and machine-learning workloads push rack power above 40 kW, a level at which air cooling becomes economically impractical. The country’s 87% renewable electricity mix and temperate climate strengthen the economics of free-cooling techniques, improving power usage effectiveness (PUE) while supporting corporate net-zero pledges. Grid-upgrade projects by Transpower and regional incentives in Southland and Canterbury are expanding capacity for new builds, although Auckland still faces short-term connection bottlenecks. Global equipment vendors compete on liquid-cooling innovation, services, and local partnerships to mitigate workforce shortages and supply chain inflation that threaten margins.
Key Report Takeaways
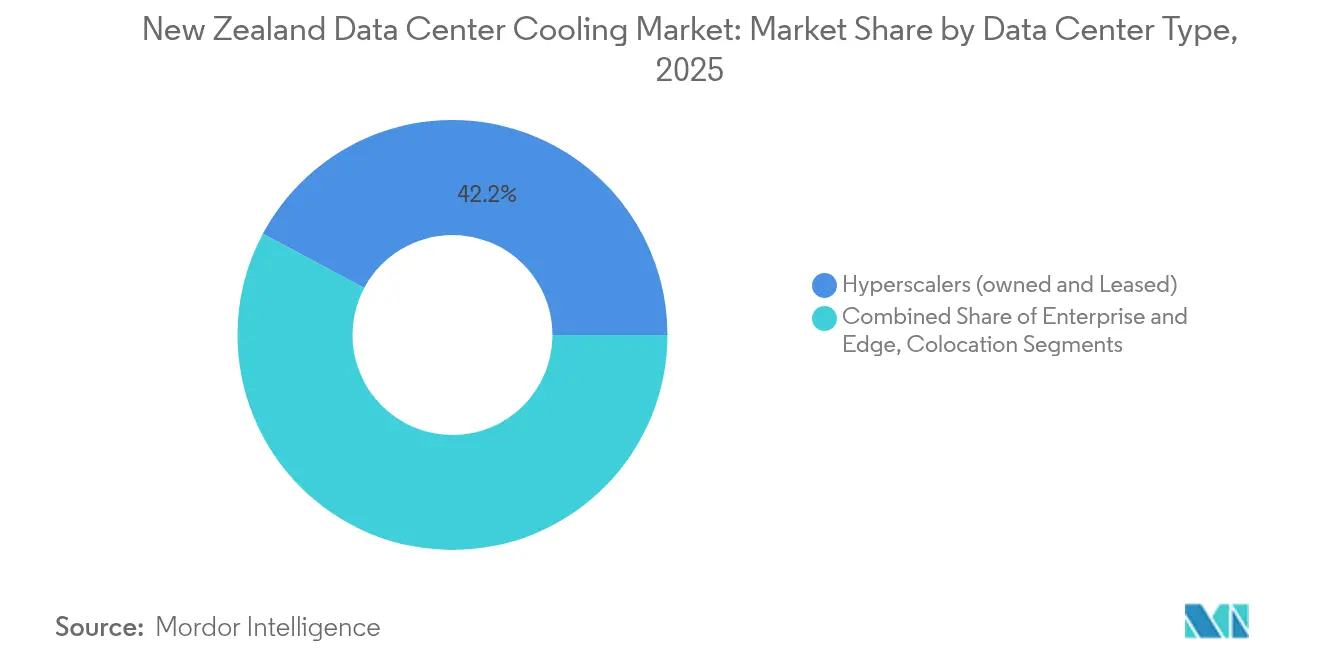
- By data center type, hyperscale facilities led with 42.20% of the New Zealand data center cooling market share in 2025 and are projected to expand at 24.60% CAGR through 2031.
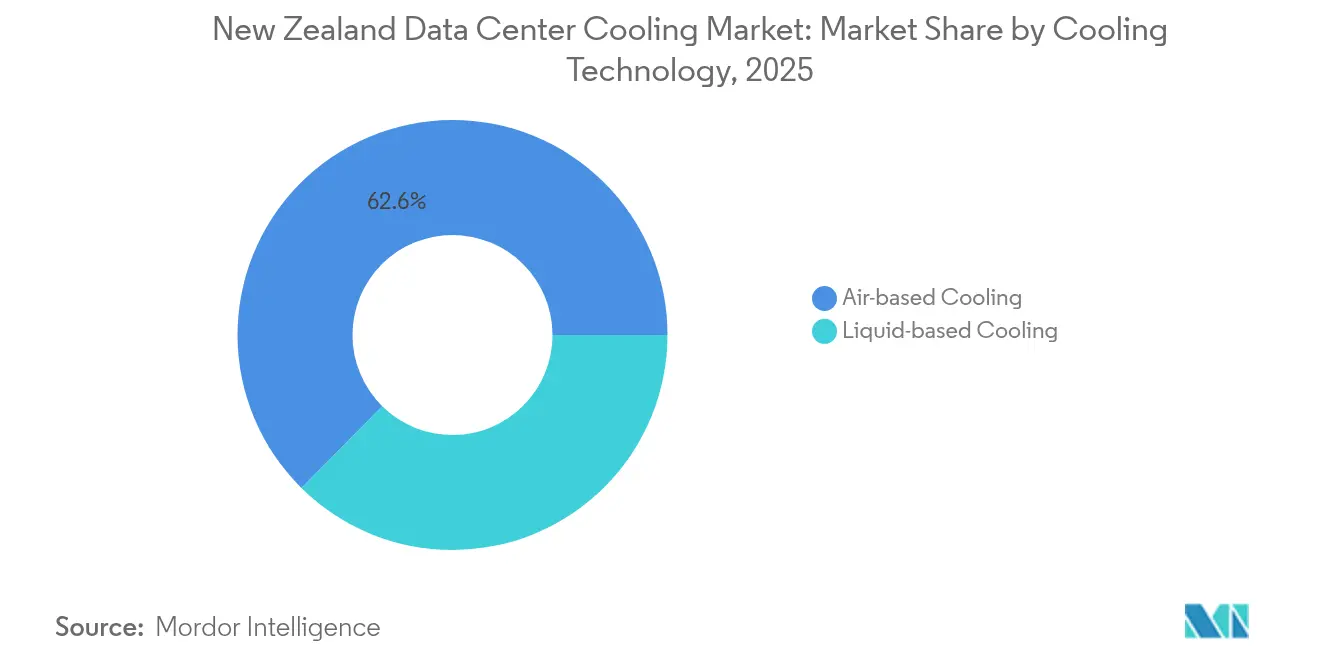
- By cooling technology, air-based solutions retained 62.60% revenue share in 2025 while liquid systems are advancing at 23.65% CAGR through 2031.
- By tier classification, Tier 3 facilities accounted for 65.30% of revenue in 2025; Tier 4 is the fastest-growing category at 23.90% CAGR to 2031.
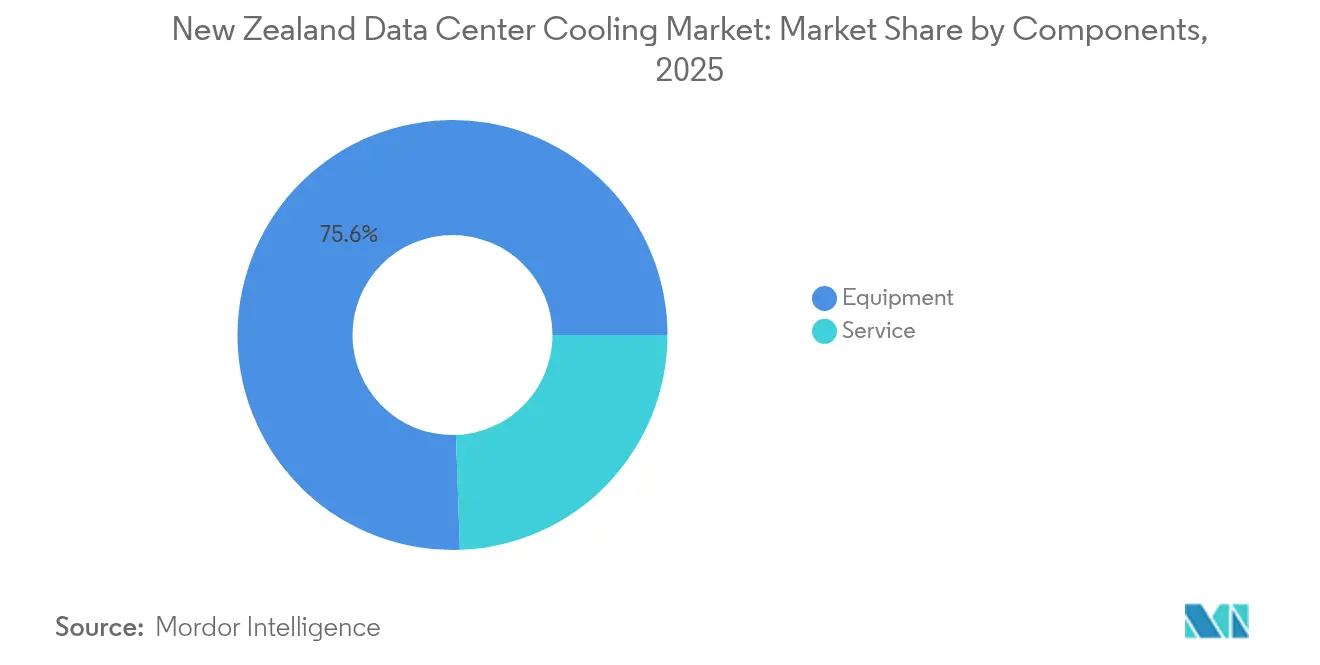
- By component, equipment contributed 75.55% revenue in 2025, whereas the services segment is forecast to rise at 22.95% CAGR through 2031.
Note: Market size and forecast figures in this report are generated using Mordor Intelligence’s proprietary estimation framework, updated with the latest available data and insights as of 2026.
New Zealand Data Center Cooling Market Trends and Insights
Drivers Impact Analysis*
| Driver | (~) % Impact on CAGR Forecast | Geographic Relevance | Impact Timeline |
|---|---|---|---|
| Surging hyperscale DC investments by global cloud majors | +6.8% | National, focused on Auckland and Wellington | Medium term (2-4 years) |
| Favourable ambient climate enabling free-cooling designs | +4.2% | National, stronger in South Island | Long term (≥ 4 years) |
| Renewable-energy push and corporate net-zero mandates | +3.9% | National | Long term (≥ 4 years) |
| High-density AI/ML workloads raising rack heat flux | +5.1% | National, hyperscale and enterprise | Short term (≤ 2 years) |
| Govt “Green Cloud” incentive scheme | +2.3% | Southland and Canterbury | Medium term (2-4 years) |
| Geothermal district-cooling pilots near Taupō | +1.5% | Central North Island | Long term (≥ 4 years) |
| Source: Mordor Intelligence | |||
Surging Hyperscale DC Investments by Global Cloud Majors
Microsoft is building the country’s first carbon-neutral cloud region and plans 100% renewable energy sourcing for all local operations. AWS committed USD 7.5 billion over 15 years, although Auckland stormwater rules have delayed part of its project schedule. Hyperscale designs adopt direct-to-chip liquid cooling that consistently achieves PUE below 1.3, compared with 1.8-2.0 for legacy enterprise sites.[1]Data Center Dynamics, “Microsoft debuts direct-to-chip cooling in NZ,” datacenterdynamics.comConcentrated spending lowers equipment unit costs, accelerates supply-chain localization, and positions the New Zealand data center cooling market as a regional cloud hub extending services into Australia and the Pacific.
High-Density AI/ML Workloads Raising Rack Heat Flux
AI servers now dissipate over 40 kW per rack—five times higher than conventional enterprise deployments—driving mandatory adoption of liquid cooling when heat flux crosses 50 W/cm². Direct-to-chip solutions lower cooling energy by up to 80% and permit 10-fold gains in rack density, enabling advanced research clusters such as the University of Otago–Datagrid partnership for carbon-neutral scientific computing.[2]Semiconductor Engineering, “Cooling challenges at 40kW racks,” semiconductorengineering.com Demand for high-density compute reinforces the technology-leadership role of the New Zealand data center cooling market.
Favorable Ambient Climate Enabling Free-Cooling Designs
Outdoor temperatures below 18 °C prevail 60-70% of the year in major cities, allowing air-side economizers to offload mechanical chillers during extended periods. Spark’s North Shore facility demonstrates COP gains of up to 120% by exploiting natural airflow and waterside economization.[3]W.media, “Spark leverages ambient cooling,” w.media Cooler South Island sites further enhance the economics of liquid cooling, cutting pump energy and improving heat-rejection cycles that benefit high-density deployments. These climatic advantages anchor the long-term competitiveness of the New Zealand data center cooling market.
Renewable-Energy Push and Corporate Net-Zero Mandates
Hydro, wind, and geothermal sources supplied 91% of national electricity in the June 2023 quarter, shielding operators from carbon pricing volatility while enabling genuine carbon neutrality claims. Immersion systems that use 30-40% less energy than traditional methods become commercially attractive when powered by renewable electricity. Microsoft’s pledge to consume only zero-carbon electricity in New Zealand illustrates how sustainability objectives inform site selection and cooling-technology choices.
Restraints Impact Analysis*
| Restraint | (~) % Impact on CAGR Forecast | Geographic Relevance | Impact Timeline |
|---|---|---|---|
| High upfront CAPEX for advanced liquid / hybrid systems | -3.8% | National | Short term (≤ 2 years) |
| Scarcity of NZ-based cooling-specialist workforce | -2.9% | Major urban centers | Medium term (2-4 years) |
| Pending water-consent tightening on evaporative systems | -2.1% | Auckland and Canterbury | Medium term (2-4 years) |
| Grid-capacity moratoria slowing DC build-outs in Auckland | -1.7% | Auckland region | Short term (≤ 2 years) |
| Source: Mordor Intelligence | |||
High Upfront CAPEX for Advanced Liquid / Hybrid Systems
Direct-to-chip solutions can add USD 500,000-2 million to project budgets and double the capital cost versus air-cooled options, extending payback periods to 3-5 years even with 30-50% energy savings. Rapid inflation in material and refrigerant prices since 2020 intensified budget pressures. Spark’s NZD 15 million edge facility in Waikato exemplifies the investment scale required for modern cooling infrastructure.
Scarcity of NZ-Based Cooling-Specialist Workforce
Globally, 58% of operators face talent shortages, an issue magnified in a smaller labor pool such as New Zealand. Two-phase immersion and dielectric fluids demand specialised training in fluid dynamics and leak-prevention procedures, leading smaller operators to outsource maintenance under premium service contracts. Universities have begun adding data-center-focused engineering programs, but the pipeline remains insufficient for forecast demand.
*Our forecasts treat driver/restraint impacts as directional, not additive. The impact forecasts reflect baseline growth, mix effects, and variable interactions.
Segment Analysis
By Data Center Type: Hyperscaler Drive Market Transformation
The hyperscale segment captured 42.20% of the New Zealand data center cooling market share in 2025 and is expected to grow at 24.60% CAGR to 2031 as global cloud majors localise compute regions. This build-out pushes the New Zealand data center cooling market size for hyperscalers to new records, encouraging wide adoption of direct-to-chip liquid loops and modular coolant distribution units that achieve PUE below 1.3. Enterprise and colocation facilities remain relevant but increasingly mimic hyperscale designs to address AI workloads.
Microsoft and AWS anchor a multiyear investment wave that attracts smaller SaaS providers, network backhaul upgrades, and specialist cooling vendors. Edge deployments, though individually smaller, aggregate demand for compact liquid systems with PUE near 1.02, creating an additional growth node that regional integrators can exploit.


By Tier Type: Tier 4 Facilities Lead Innovation
Tier 3 remains the dominant classification at 65.30% revenue share in 2025, yet Tier 4 facilities post the highest 23.90% CAGR through 2031, moving the New Zealand data center cooling market size for Tier 4 toward parity with Tier 3 by decade-end. Mission-critical workloads in banking and healthcare require near-zero downtime, justifying redundant liquid loops and N+1 chiller farms.
In Tier 4 builds, geothermal integration and 2N liquid systems support energy sources with variable load factors. University-industry collaborations such as the Otago–Datagrid project showcase 100% renewable energy coupled with immersion and dielectric cooling to maintain operational continuity for scientific computing.
By Cooling Technology: Liquid Systems Gain Momentum
Air-based systems retained 62.60% market share in 2025, but liquid techniques are advancing at 23.65% CAGR, helping close the gap on the incumbent approach. Direct-to-chip currently dominates the liquid category by volume, whereas full-immersion is chosen for the highest power densities or retrofits limited by floor space.
Rear-door heat exchangers and hybrid coil designs provide a migration path for existing air-cooled halls toward liquid support without wholesale infrastructure replacement. These retrofit solutions keep total cost of ownership competitive and explain the brisk adoption pace across Tier 3 enterprises.
By Component: Services Segment Reflects Complexity
Equipment sales controlled 75.55% of revenue in 2025, yet the services sub-market is set for 22.95% CAGR thanks to a steep learning curve associated with two-phase, dielectric, and hybrid systems. Bundled installation and lifecycle support contracts offset the scarcity of in-house specialists, creating a recurring revenue stream for vendors.
Manufacturers deepen their New Zealand data center cooling industry presence by embedding remote monitoring, AI-driven fault prediction, and compliance management within service offerings. Schneider Electric’s Motivair acquisition typifies this vertical integration trend, combining chiller hardware with field engineers, firmware updates, and coolant quality analytics.
Geography Analysis
Auckland and Wellington remain the epicenters of hyperscale investments, yet grid connection moratoria and rising land costs foster a southward shift that benefits South Island locations with cooler ambient temperatures and abundant hydro resources. Datagrid’s USD 1 billion Invercargill hyperscale campus is emblematic of this pattern, leveraging 100% renewable generation and deep-water fiber connectivity to Australia.
The New Zealand data center cooling market size for the South Island expands rapidly because free-cooling hours routinely exceed 6,000 per year, lowering OPEX and reducing mechanical wear on chillers. North Island projects adopt more advanced hybrid liquid schemes to manage higher ambient temperatures and the urban heat-island effect around Auckland’s industrial zones.
Competitive Landscape
Global brands such as Schneider Electric, Vertiv, Trane Technologies, Johnson Controls, and Stulz anchor the supplier roster, each accelerating liquid-cooling roadmaps and expanding local channels to meet project timelines. Schneider’s Motivair acquisition and Vertiv’s Energy Labs and BiXin Energy deals illustrate how equipment leaders secure proprietary liquid expertise and broaden portfolios from rear-door exchanges to full modular coolant distribution systems.
Price competition remains secondary to reliability, service capability, and time-to-deploy, particularly for Tier 4 and hyperscale buyers. Suppliers also differentiate on low-GWP refrigerants and AI-enabled controls that predict thermal excursions, a crucial feature for mission-critical sites running clustered GPUs.
Local systems integrators gain traction by providing compliance advice and workforce augmentation in regions where specialist technicians are scarce. Their proximity enables rapid response and customisation for New Zealand data center cooling market customers that must navigate evolving water-consent rules and grid-capacity allocations.
New Zealand Data Center Cooling Industry Leaders
Stulz GmbH
Schneider Electric SE
Rittal GmbH & Co. KG
Vertiv Group Corp.
Johnson Controls International plc
- *Disclaimer: Major Players sorted in no particular order

Recent Industry Developments
- June 2025: LiquidStack launched a modular coolant distribution unit that improves scalability for liquid deployments.
- April 2025: Vertiv posted USD 2.04 billion Q1 2025 revenue, up 24% year on year, citing AI cooling demand.
- March 2025: Trane Technologies introduced Magnetic Bearing and Ascend air-cooled chillers offering up to 850 tons capacity with low-GWP refrigerants.
- March 2025: Vertiv unveiled the CoolLoop Trim Cooler with 70% annual energy savings for AI stacks.


Research Methodology Framework and Report Scope
Market Definitions and Key Coverage
We define the New Zealand data center cooling market as the annual spend, in U.S. dollars, on dedicated equipment and services whose primary function is to extract and reject the heat generated by IT hardware housed in purpose-built, colocation, hyperscale, and edge facilities. Systems covered include room, row, rack, and liquid solutions, chillers, CRAH/CRAC units, cooling towers, rear-door heat exchangers, direct-to-chip loops, immersion tanks, and their control software.
Scope exclusion: Retrofit HVAC upgrades for general commercial buildings that merely host server closets are not included.
Segmentation Overview
- By Data Center Type
- Hyperscalers (owned and Leased)
- Enterprise and Edge
- Colocation
- By Tier Type
- Tier 1 and 2
- Tier 3
- Tier 4
- By Cooling Technology
- Air-based Cooling
- Chiller and Economizer (DX Systems)
- Computer Room Air Handler (CRAH)
- Cooling Tower (covers direct, indirect and two-stage cooling)
- Others
- Liquid-based Cooling
- Immersion Cooling
- Direct-to-Chip Cooling
- Rear-Door Heat Exchanger
- Air-based Cooling
- By Component
- By Service
- Consulting and Training
- Installation and Deployment
- Maintenance and Support
- By Equipment
- By Service
Detailed Research Methodology and Data Validation
Primary Research
To balance desk insights, Mordor analysts held structured calls and short surveys with facility managers in Auckland and Invercargill, regional design-build contractors, cooling skid integrators, and utility procurement heads. Interviews clarified rack densities aimed for AI workloads, price spreads between air and liquid kits, and service hour norms for maintenance contracts.
Desk Research
Our analysts gathered cost and shipment cues from open data such as Statistics NZ energy end-use tables, Ministry of Business, Innovation & Employment electricity statistics, Transpower grid load forecasts, and Auckland Council building consent filings. Trade bodies like the New Zealand Data Center Forum, ASHRAE TC 9.9 guidelines, and Uptime Institute reports enriched technical limits on acceptable inlet temperatures and PUE bands. Because many suppliers are private, we tapped D&B Hoovers for company financials, Dow Jones Factiva for deal flow, and Marklines when thermal components overlapped with automotive heat exchange lines. Press releases, tender portals, and patent abstracts rounded out technology adoption timelines. This list is illustrative, not exhaustive; many additional sources supported validation.
Market-Sizing & Forecasting
A top-down model starts with commissioned IT load megawatts and typical installed cooling capex per MW, adjusted for average rack power (15-25 kW), hours of free air cooling available in NZ's 12 C mean climate, renewable electricity share (~ 91%), and observed PUE improvement curves. Supplier roll-ups and sample ASP × volume checks offer bottom-up reasonableness and fill data gaps. Multivariate regression projects the five-year outlook; drivers include hyperscale build pipeline, liquid cooling penetration, carbon pricing scenarios, exchange rate trends, and service inflation. Where inputs are sparse, interpolation uses regional analogs and conservative elasticity factors vetted with interviewees.
Data Validation & Update Cycle
Outputs pass two-stage peer review, anomaly screens against energy intensity norms, and variance checks versus previous editions. Reports refresh each year, while major hyperscale announcements trigger interim updates; an analyst reopens the model just before client delivery.
Why Our New Zealand Data Center Cooling Baseline Earns Confidence
Published numbers often differ because firms pick uneven facility scopes, roll differing HVAC refurb spend into totals, or freeze exchange rates months in advance.
Key gap drivers here are whether edge pods are counted, the rack density assumption applied to 2025 builds, inclusion of service revenue, and how quickly liquid options displace air systems.
Benchmark comparison
| Market Size | Anonymized source | Primary gap driver |
|---|---|---|
| USD 27.20 million (2025) | Mordor Intelligence | - |
| USD 27.43 million (2024) | Regional Consultancy A | Uses revenue share extrapolation and omits edge site spending |
| USD 30.00 million (2025) | Market Publisher B | Combines general HVAC retrofits with purpose-built capex and lacks primary validation |
The comparison shows that, by anchoring scope to purpose-built data centers, calibrating density and PUE with local operator inputs, and revisiting assumptions annually, Mordor provides a balanced, transparent baseline decision makers can trust.


Key Questions Answered in the Report
What is the current value of the New Zealand data center cooling market?
The market reached USD 33.22 million in 2026 and is projected to grow to USD 90.08 million by 2031.
Which cooling technology is expanding the fastest?
Liquid-based systems are growing at 23.65% CAGR through 2031, driven by AI rack densities above 40 kW.
Why are hyperscale facilities important for New Zealand?
Hyperscalers hold 42.20% market share and invest heavily in carbon-neutral infrastructure, accelerating adoption of advanced cooling techniques.
How does renewable energy influence cooling decisions?
With 91% renewable electricity, operators can deploy energy-intensive liquid cooling while meeting corporate net-zero commitments.
Page last updated on:


