
Technology, Media and Telecom
5th MayPricing Strategy for Semiconductor Components
3 Min Read
Hong Kong Data Center Cooling Market is Segmented by Data Center Type (Hyperscalers (owned and Leased), Enterprise and Edge, Colocation), Tier Type (Tier 1 and 2, Tier 3, Tier 4), Cooling Technology (Air Based Cooling, Liquid Based Cooling), Component (Service, Equipment). The Market Forecasts are Provided in Terms of Value (USD).
Market Overview
| Study Period | 2020 - 2031 |
|---|---|
| Base Year For Estimation | 2025 |
| Forecast Data Period | 2026 - 2031 |
| Market Size (2026) | USD 189.47 Million |
| Market Size (2031) | USD 466.12 Million |
| Growth Rate (2026 - 2031) | 19.72 % CAGR |
| Market Concentration | Medium |
Major Players *Disclaimer: Major Players sorted in no particular order. Image © Mordor Intelligence. Reuse requires attribution under CC BY 4.0. |
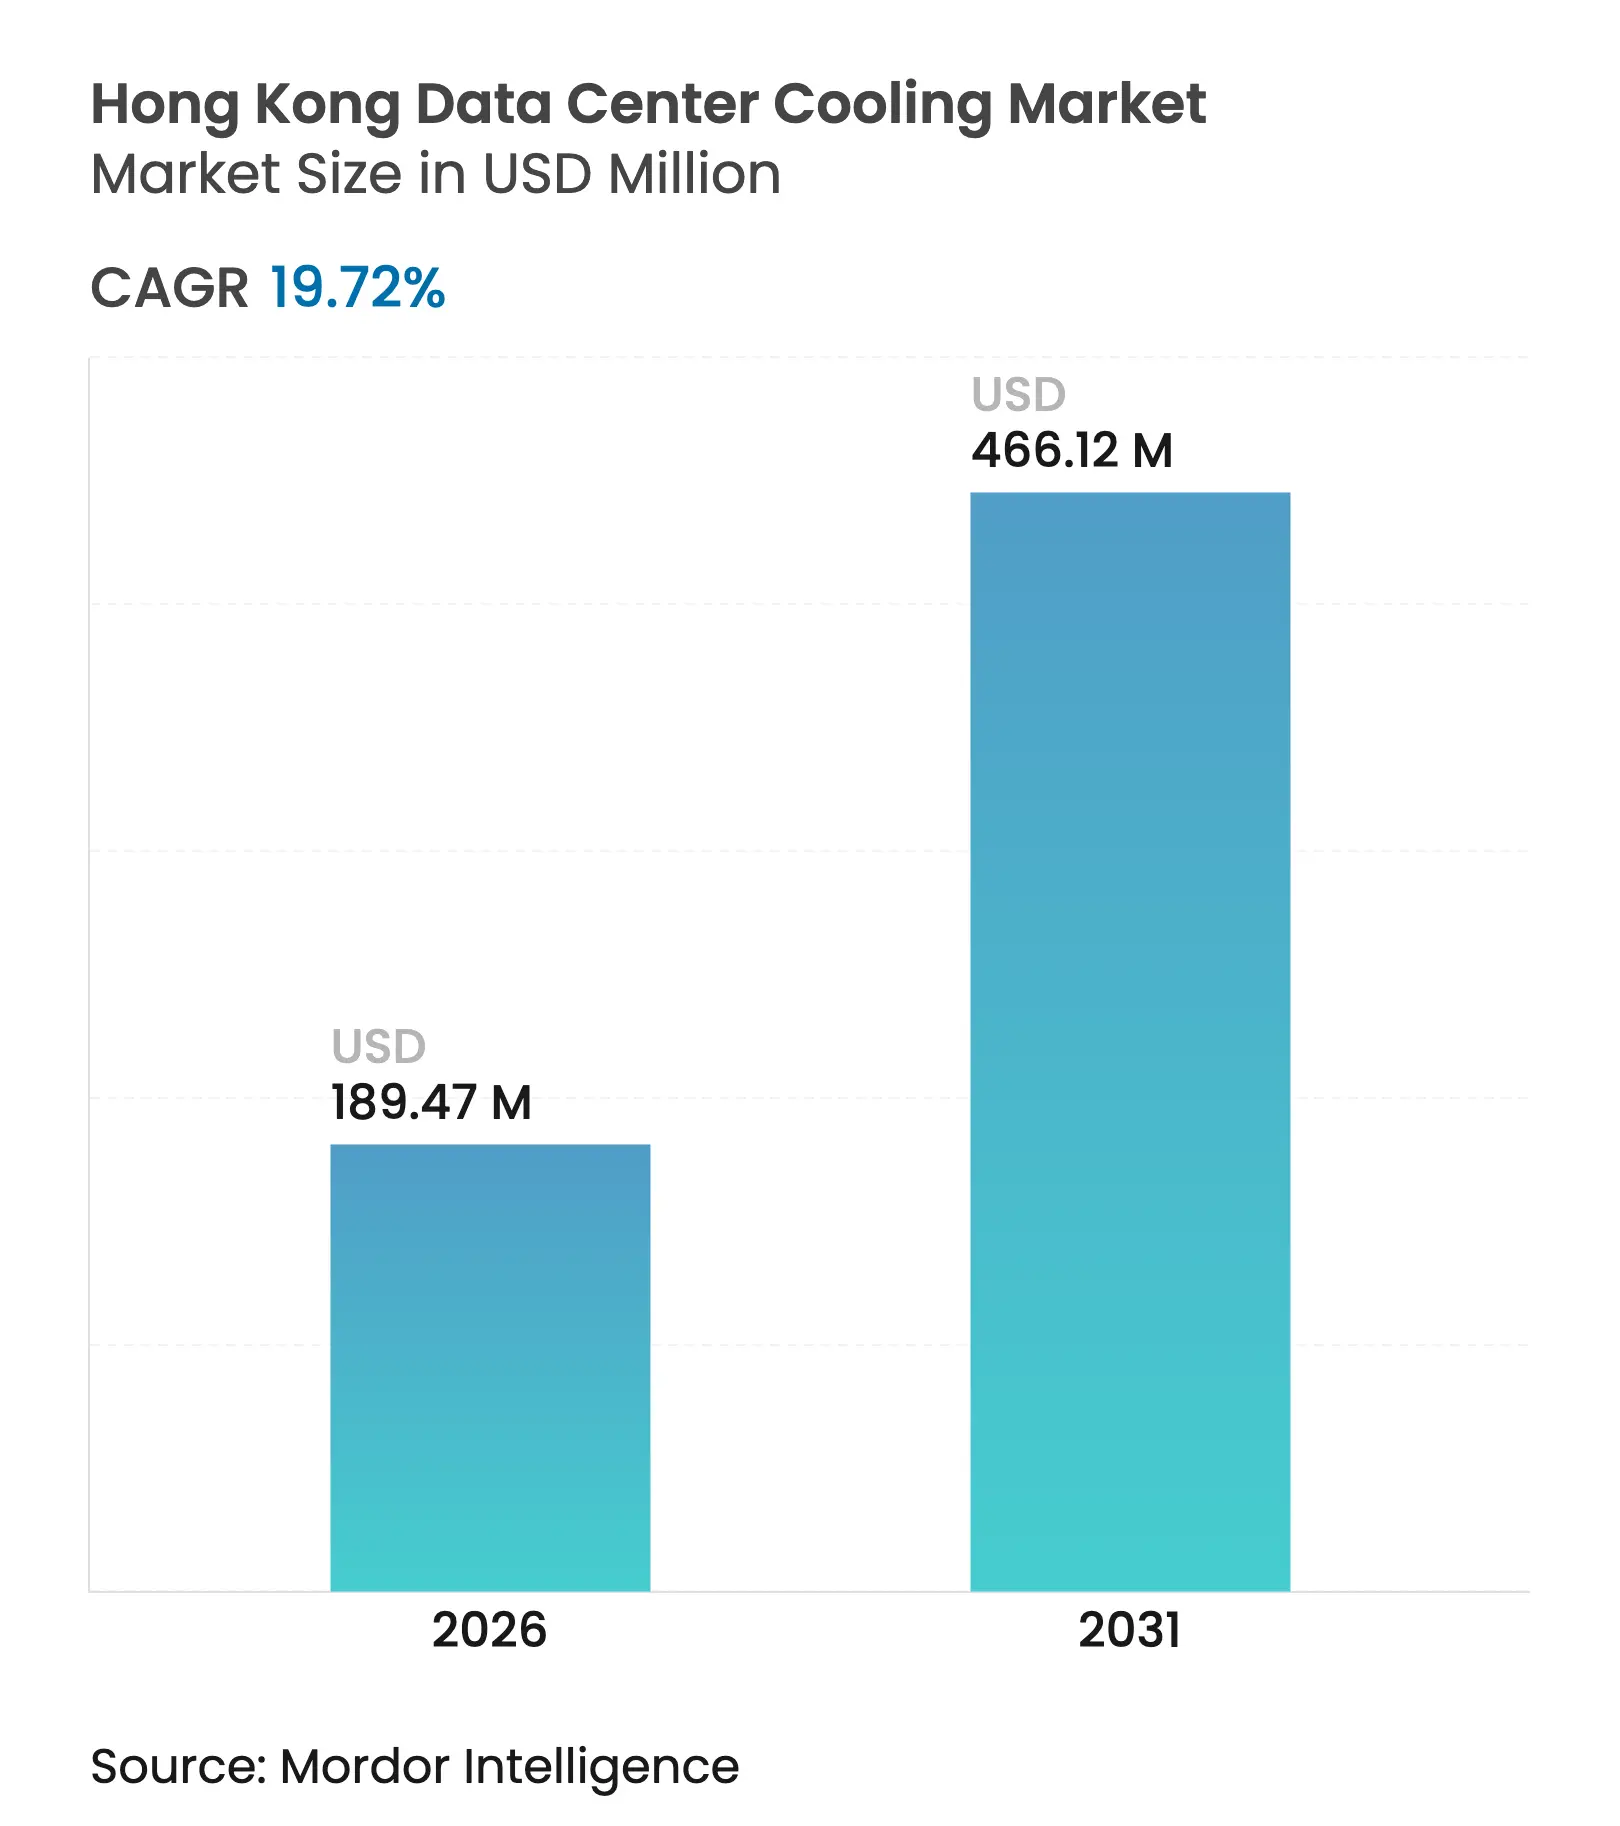
Hong Kong data center cooling market size in 2026 is estimated at USD 189.47 million, growing from 2025 value of USD 158.28 million with 2031 projections showing USD 466.12 million, growing at 19.72% CAGR over 2026-2031. This sustained expansion positions the Hong Kong data center cooling market as one of the fastest-growing country-level cooling arenas worldwide, supported by submarine-cable connectivity that anchors hyperscale deployments, an aggressive artificial-intelligence build-out, and regulatory incentives linked to carbon-neutrality goals. Hyperscale operators account for the bulk of new capacity additions, and their preference for rack densities above 30 kW accelerates the shift toward liquid technologies that outperform conventional computer-room air handlers (CRAH) and chiller loops. Cooling project timelines now intersect tightly with power allocation from CLP Power and HK Electric, forcing operators to prioritize solutions that keep power usage effectiveness (PUE) at or below 1.4. Competitive differentiation has therefore moved from basic availability to cooling efficiency, reliability in typhoon-exposed coastal zones, and the ability to integrate with district-cooling or heat-reuse schemes. Looking ahead, the Hong Kong data center cooling market is expected to balance a legacy air-cooling installed base with direct-to-chip cold plates, rear-door heat exchangers, and two-phase immersion environments that address forthcoming AI training clusters.
Key Report Analysis
Note: Market size and forecast figures in this report are generated using Mordor Intelligence's proprietary estimation framework, updated with the latest available data and insights as of 2026.
Drivers Impact Analysis
| Driver | (~) % Impact on CAGR Forecast | Geographic Relevance | Impact Timeline | |||
|---|---|---|---|---|---|---|
Strong hyperscale pipeline backed by HK submarine-cable
connectivity
Strong hyperscale pipeline backed by HK submarine-cable
connectivity
| +4.2% | Hong Kong; spillover to Greater Bay Area | Medium term (2-4 years) |
(~) % Impact on CAGR Forecast
:
+4.2%
|
Geographic Relevance
:
Hong Kong; spillover to Greater Bay Area
|
Impact Timeline
:
Medium term (2-4 years)
|
Soaring rack densities from AI clusters (greater than 30 kW/rack) Soaring rack densities from AI clusters (greater than 30 kW/rack) | +5.8% | Global focus, concentrated in HK hyperscale sites | Short term (≤ 2 years) | |||
Mandatory “green lease” clauses from top colocation
landlords Mandatory “green lease” clauses from top colocation
landlords | +2.1% | HK commercial data-center districts | Medium term (2-4 years) | |||
Government 2050 carbon-neutral roadmap with ≤1.4 PUE
targets Government 2050 carbon-neutral roadmap with ≤1.4 PUE
targets | +3.4% | Territory-wide | Long term (≥ 4 years) | |||
Under-sea-water heat-exchange pilots in Tseung Kwan O
and Kai Tak Under-sea-water heat-exchange pilots in Tseung Kwan O
and Kai Tak | +1.8% | HK coastal projects | Long term (≥ 4 years) | |||
Heat-reuse projects for district cooling in Kai Tak and
Northern Metropolis Heat-reuse projects for district cooling in Kai Tak and
Northern Metropolis | +2.3% | New development areas | Long term (≥ 4 years) | |||
| Source: Mordor Intelligence | ||||||
Strong Hyperscale Pipeline Backed by HK Submarine-Cable Connectivity
Hong Kong hosts 13 active submarine systems that land in Tseung Kwan O and other coastal precincts, allowing hyperscale operators to interconnect east-west traffic with minimal latency.[1]SUNeVision, “MEGA Plus Connectivity Advantages,” sunevision.com The clustering effect created by these landing sites compresses land availability and raises rack-density expectations, which in turn compels the Hong Kong data center cooling market to specify higher chilled-water setpoints, larger distribution pipework, and modular heat-rejection blocks at inception. Operators such as SUNeVision design cooling plants capable of scaling from enterprise-style 12 kW racks to AI racks, surpassing 30 kW without ripping out existing infrastructure. Demand for instant connectivity also shortens leasing cycles, requiring chilled-water plants to achieve design PUE in under twelve months, a timetable that favors prefabricated cooling modules.
Mandatory “Green Lease” Clauses from Top Colocation Landlords
Global Switch stipulates PUE below 1.4 across its Asia-Pacific estate, and tenants that fall out of compliance face penalty clauses or renewal risks. Equinix HK4, meanwhile, achieved a 30% drop in cooling energy by integrating free-air economizer controls funded in part by CLP Power.[2]NVIDIA Corporation, “DGX B200 System Specifications,” nvidia.comThese contractual mechanisms push tenants to upgrade cooling coils, raise chilled-water temperatures, and adopt active aisle-containment or rear-door heat exchangers more quickly than their own capital-planning cycles would have dictated. The Hong Kong data center cooling market, therefore, benefits from predictable retrofit volumes driven by landlord compliance audits.
Soaring Rack Densities from AI Clusters (greater than 30 kW/rack)
NVIDIA DGX B200 servers draw roughly 14.3 kW each, and eight chassis in a rack breach 30 kW, well beyond the thermal envelope of raised-floor air distribution. Vertiv’s CoolLoop trim cooler addresses these loads with supply-water temperatures at 40 °C that still deliver 70% annual energy savings compared with conventional CRAH deployments. The immediate implication for the Hong Kong data center cooling market is a non-negotiable shift toward liquid media that can transport 1,000-plus W per square meter without recirculation hotspots. Facility operators no longer treat liquid cooling as an optional overlay; it now constitutes the core strategy around which power, white-space layout, and service corridors are arranged.
Government 2050 Carbon-Neutral Roadmap Incentivises ≤1.4 PUE
Hong Kong’s Climate Action Plan earmarks USD 47 billion for territory-wide efficiency incentives, including accelerated depreciation on high-COP chillers and soft loans for waste-heat recovery loops. The Buildings Energy Efficiency Ordinance mandates decade-interval energy audits, a requirement that positions cooling upgrades as the most immediate route to compliance for data-center landlords. At the district level, the Kai Tak cooling plant uses seawater intakes to cut electricity use by 35% and save 85 million kWh annually.[3]Electrical and Mechanical Services Department, “Kai Tak District Cooling System,” emsd.gov.hk These policy signals lock in a long-term growth runway for the Hong Kong data center cooling market as operators align expansion plans with territorial decarbonization milestones.
Restraints Impact Analysis
| Restraint | (~) % Impact on CAGR Forecast | Geographic Relevance | Impact Timeline | |||
|---|---|---|---|---|---|---|
Scarcity and high cost of power feeders from CLP Power
and HK Electric Scarcity and high cost of power feeders from CLP Power
and HK Electric | -3.7% | Territory-wide | Short term (≤ 2 years) |
(~) % Impact on CAGR Forecast
:
-3.7%
|
Geographic Relevance
:
Territory-wide
|
Impact Timeline
:
Short term (≤ 2 years)
|
18–24 month land-use approvals for Tier IV buildings
18–24 month land-use approvals for Tier IV buildings
| -2.8% | New development zones | Medium term (2-4 years) | |||
Typhoon-driven salt-spray corrosion of rooftop chillers
Typhoon-driven salt-spray corrosion of rooftop chillers
| -1.9% | Coastal areas | Medium term (2-4 years) | |||
Limited qualified labour for immersion-ready white-space
retrofits
Limited qualified labour for immersion-ready white-space
retrofits
| -2.1% | Territory-wide; regional spillover | Short term (≤ 2 years) | |||
| Source: Mordor Intelligence | ||||||
Scarcity and High Cost of Power Feeders from CLP Power and HK Electric
New feeder circuits require multi-stage sign-offs that can add 18 months to hyperscale build schedules, raising capitalized interest costs and delaying cooling-plant commissioning. Operators, therefore, push the Hong Kong data center cooling market toward ultra-efficient heat-exchanger loops, elevated chilled-water return temperatures, and variable-speed drives on pumps that flatten demand peaks inside constrained power envelopes. As electricity tariffs remain among the region’s highest, colocation tenants evaluate total landed-cost models where every incremental watt saved on cooling improves gross-margin sensitivity.
Limited Qualified Labour for Immersion-Ready White-Space Retrofits
Immersion cooling requires technicians trained in dielectric-fluid handling, leak-detection regimes, and pressure-balanced tank installation. LiquidStack had to run dedicated certification tracks for local contractors to deploy its 2-phase systems that reach PUE 1.01. The scarcity inflates installation quotes and pushes project owners to bundle training packages with equipment orders, embedding a services premium into the Hong Kong data center cooling market that is reflected in the 20.4% CAGR forecast for the services segment.
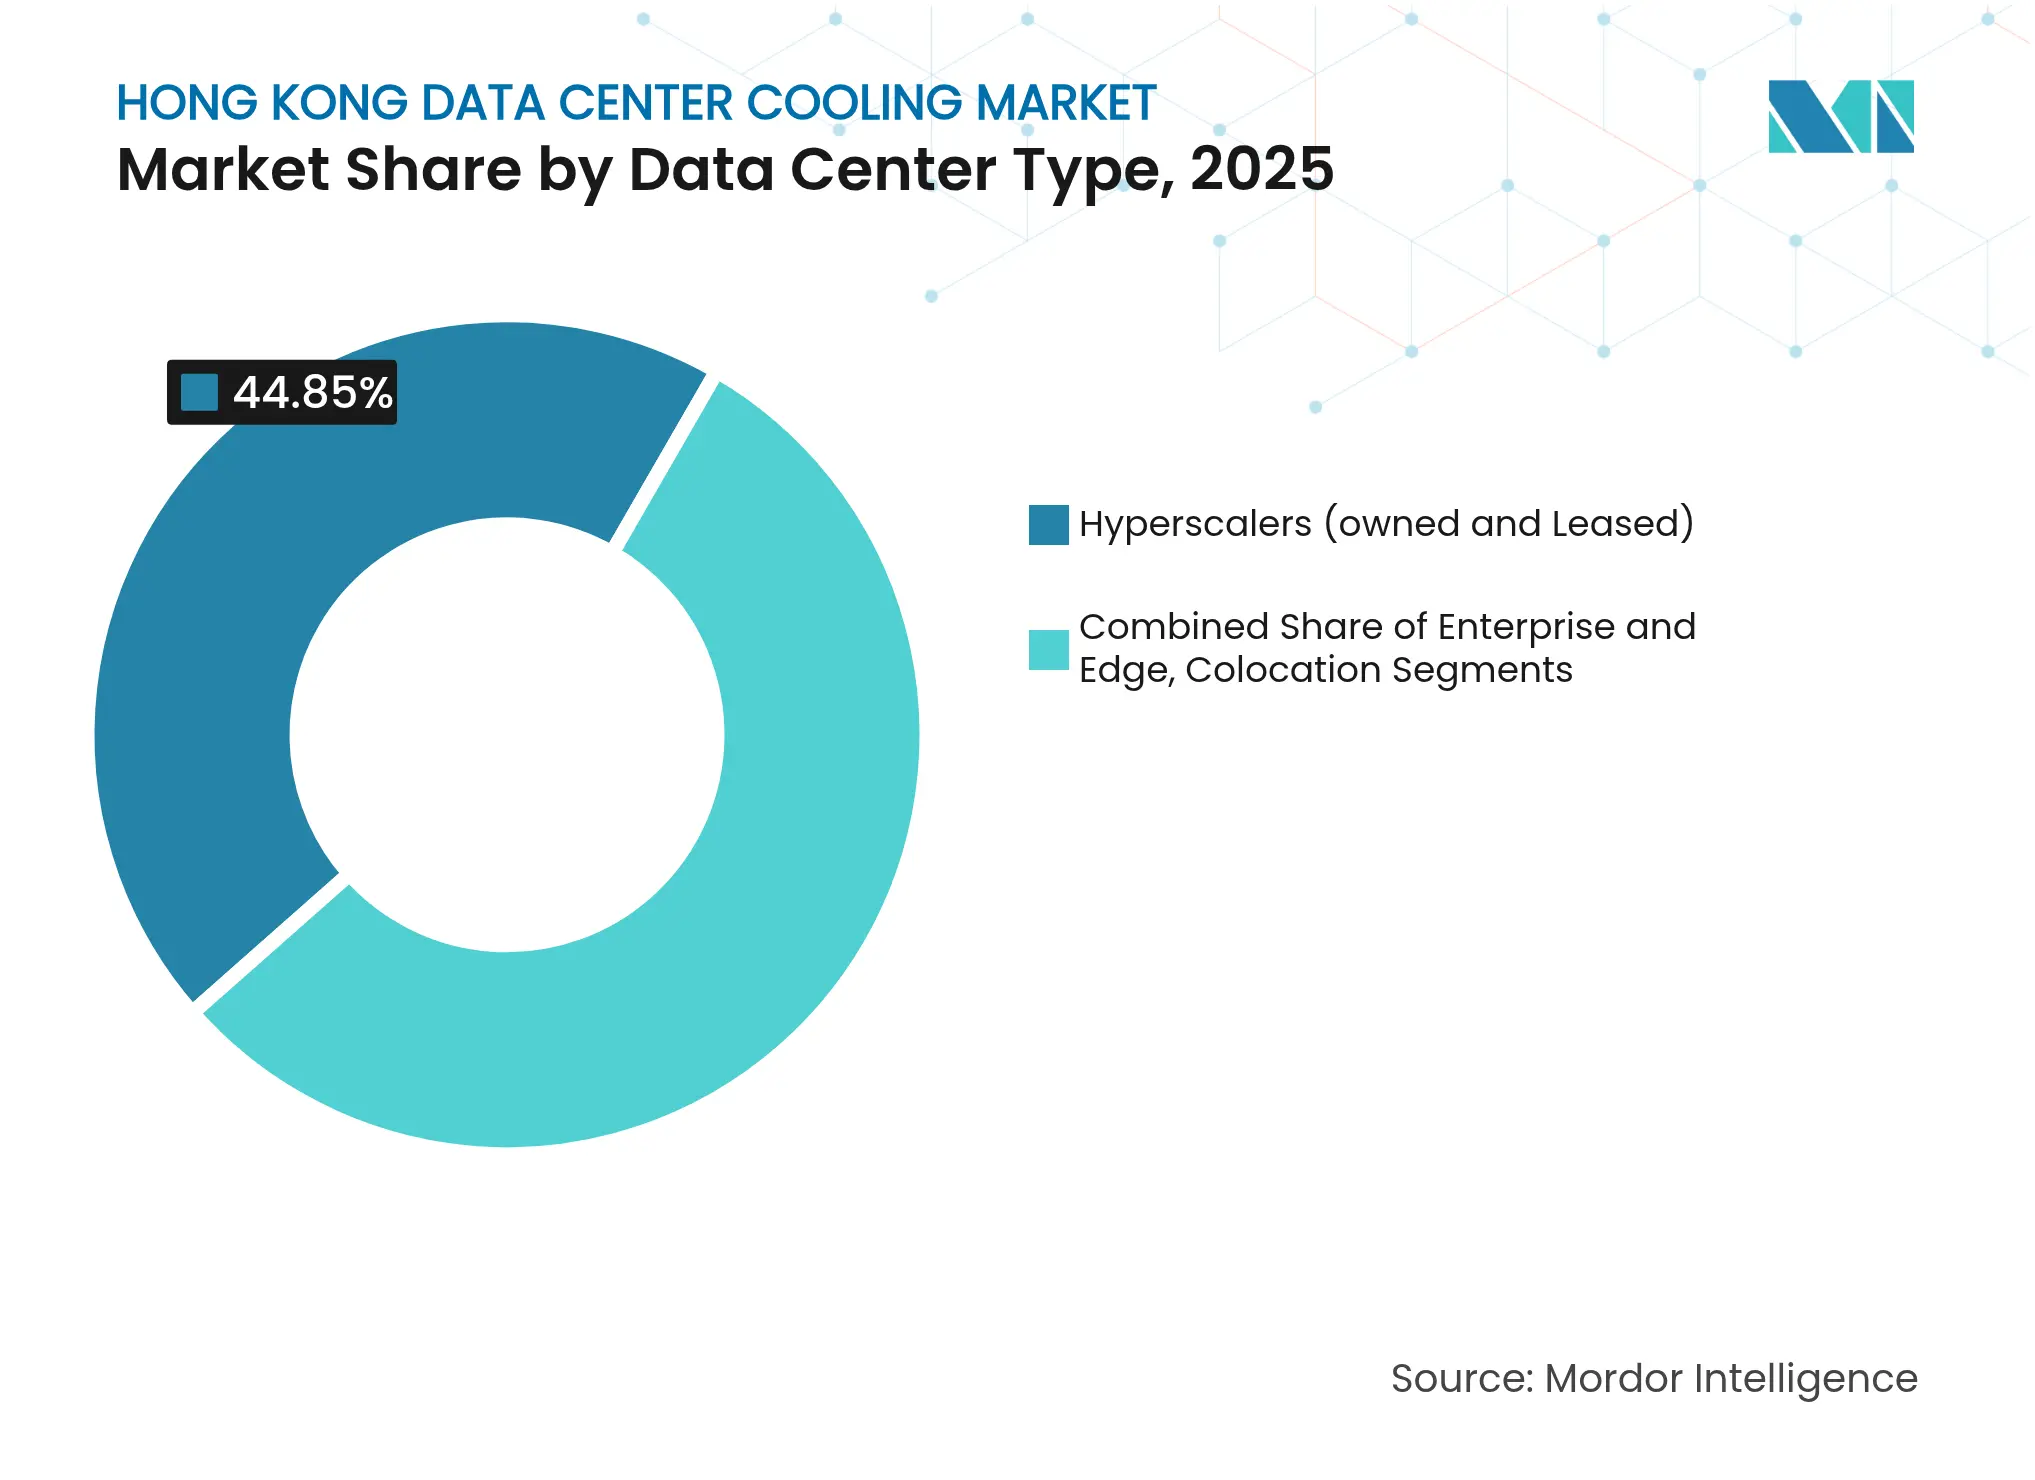
By Data Center Type: Hyperscalers Drive Liquid Cooling Innovation
Hyperscalers accounted for a 44.85% Hong Kong data center cooling market share in 2025, and their planned expansions position the segment to post a 20.15% CAGR through 2031. These large builds incorporate dedicated chilled-water loops for AI zones, rear-door heat-exchanger rows for general compute, and immersion pods for training clusters. The Hong Kong data center cooling market must therefore supply modular pumping skids, quick-disconnect manifolds, and rack-level coolant distribution units that allow phased deployment without production outages.
Enterprise and edge facilities trail in absolute spend yet experiment with hybrid solutions that couple aisle-containment airflows with localized liquid loops for GPU racks. This mixed adoption demonstrates how hyperscale standards cascade down the ecosystem: once supply chains for cold plates, leak-sealed hoses, and fluid sensors mature, total-cost-of-ownership curves converge, prompting second-tier operators to adopt similar architectures. Consequently, consultancy firms report a surge in design-build inquiries that reference hyperscale specification sheets as de-facto industry baselines.
Note: Segment shares of all individual segments available upon report purchase
By Tier Type: Tier 4 Facilities Embrace Advanced Cooling
Tier 3 sites owned 62.55% of the Hong Kong data center cooling market size in 2025, anchored by legacy builds that prioritize predictable PUE outcomes over redundancy. Tier 4 pipelines, however, are projected to climb at 20.6% CAGR, reflecting demand for 99.995% uptime that necessitates N+N cooling redundancy with dual chilled-water headers, isolated containment zones, and emergency heat-rejection modules.
The stringent approval cycle—often 24 months for fire-safety, structural, and power-interface reviews—rewards designs that reuse validated component lists, further channeling procurement toward multinational vendors with documented reliability records. Tier 1 and Tier 2 footprints remain cost-focused, selecting high-COP air-handling units over immersion setups, yet even these facilities now reserve floor space for future liquid skids, indicating the pervasive influence of higher-tier resilience metrics.
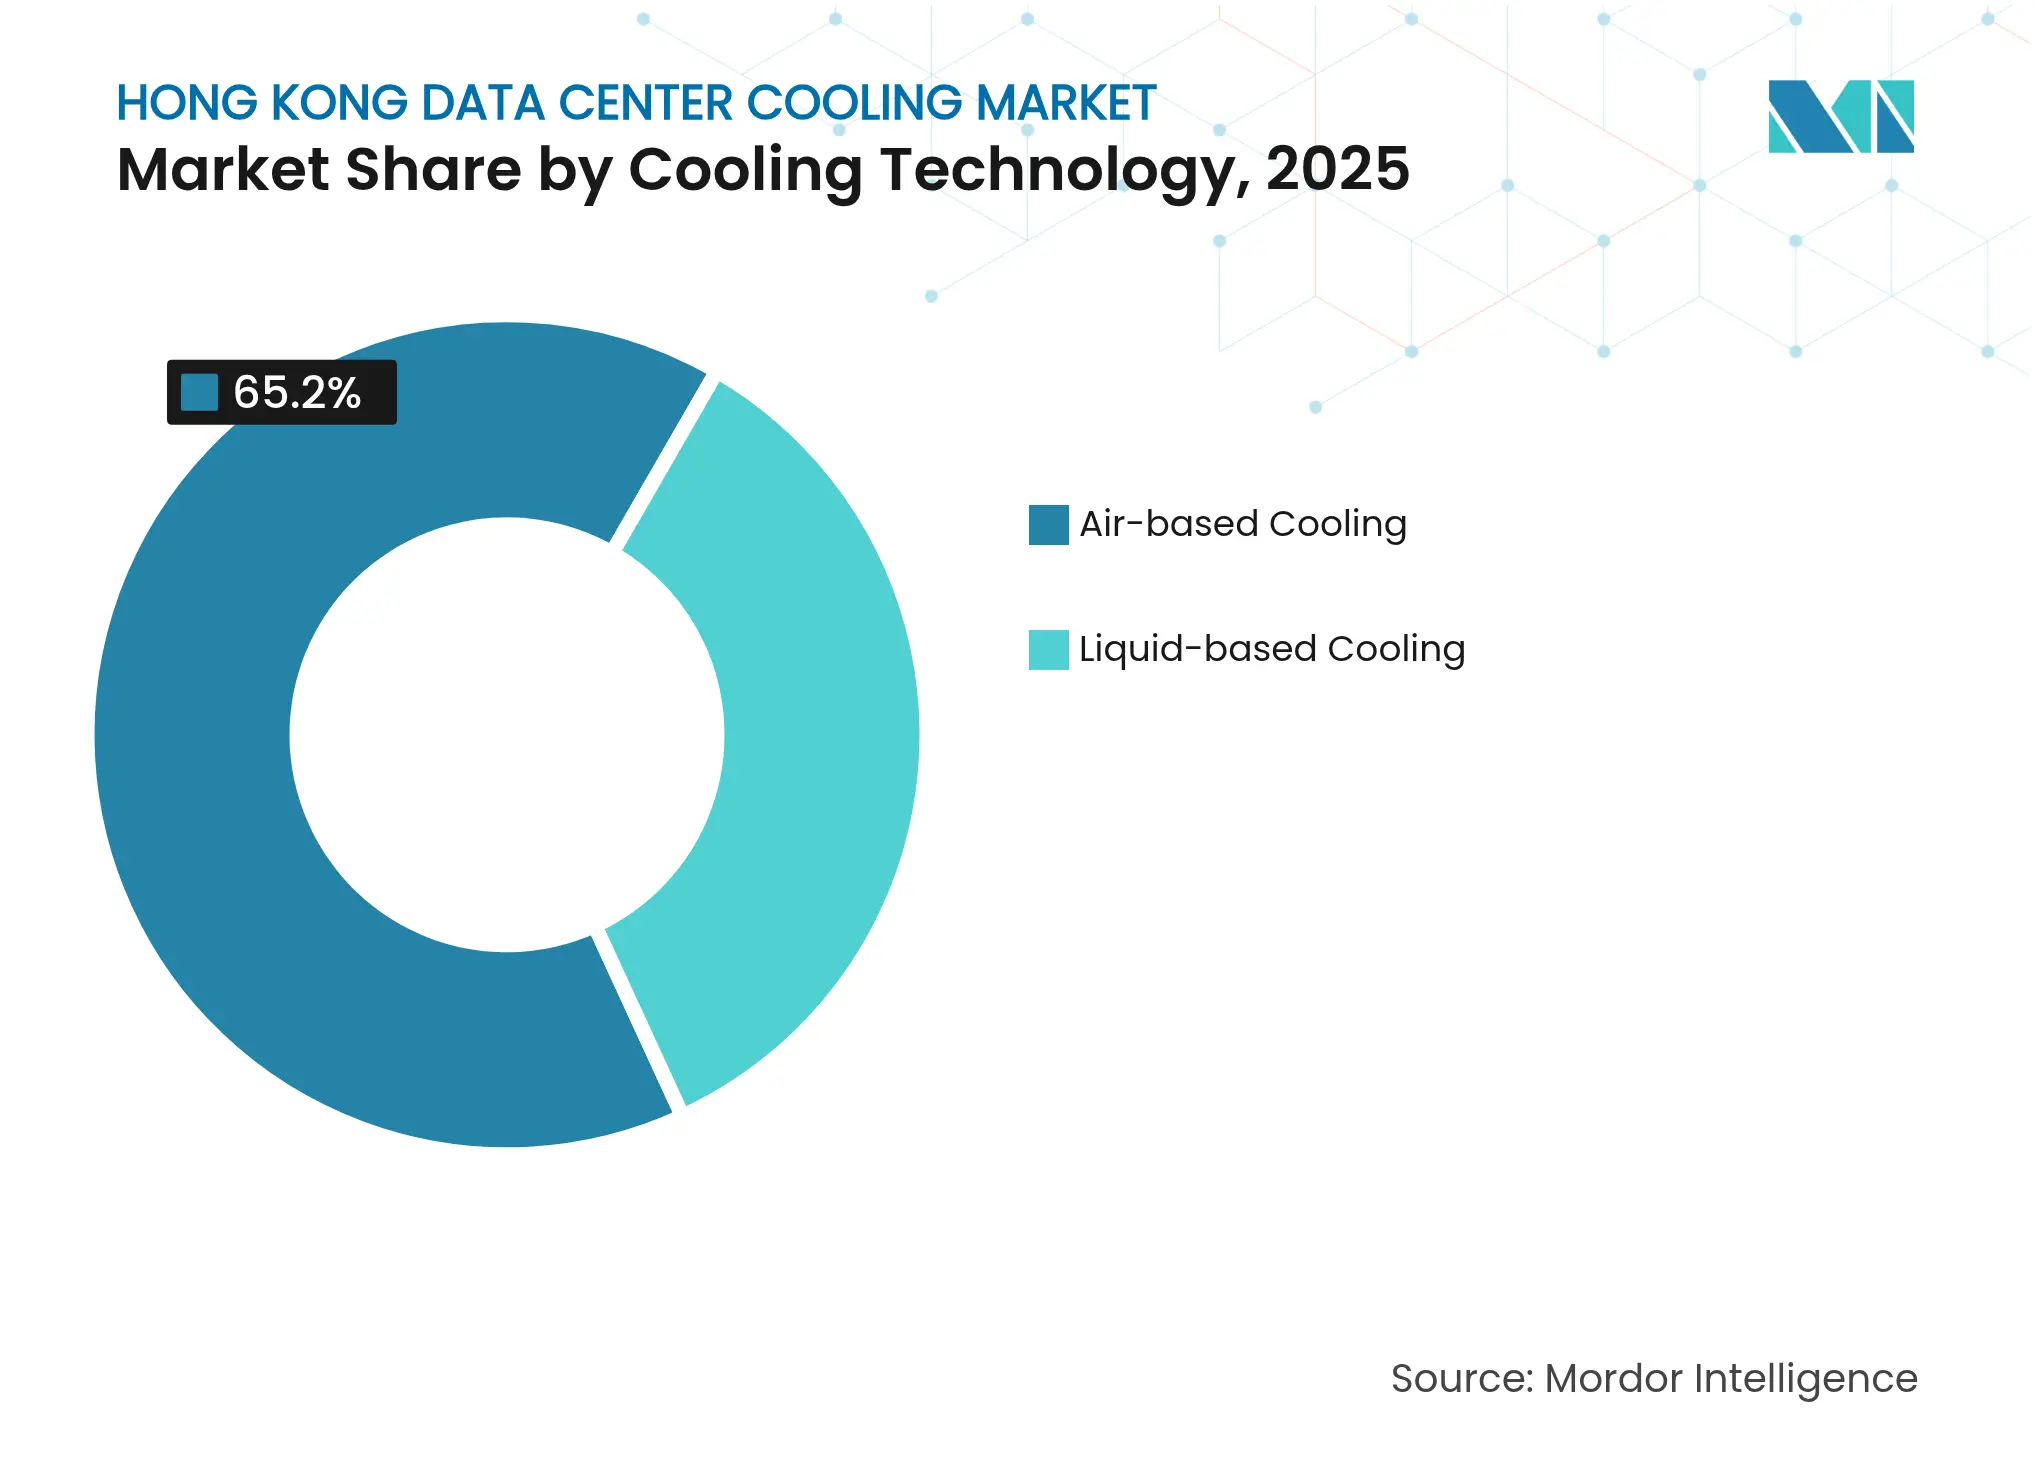
By Cooling Technology: Liquid Solutions Gain Momentum
Air-based cooling maintained 65.20% revenue within the Hong Kong data center cooling market in 2025, but liquid solutions headline the growth story with a 20.75% forward CAGR. Direct-to-chip plates transport heat loads exceeding 350 W per processor while returning coolant at 45 °C, a parameter that unlocks heat-reuse loops for domestic-hot-water or district-cooling tie-ins. Immersion baths, meanwhile, remove up to 200 kW per rack, reshaping white-space ceiling heights, fire-suppression layouts, and raised-floor grid densities.
Legacy chillers and CRAH rows are not disappearing overnight. Instead, operators layer liquid circuits onto existing plant rooms, creating hybrid arrays where air handles baseline IT loads and liquid loops intercept AI blades. Such dual-path architectures help mitigate downtime risks during technology migration, a factor driving procurement managers to favor vendor-agnostic manifolds and quick-swap cold plates.
Note: Segment shares of all individual segments available upon report purchase
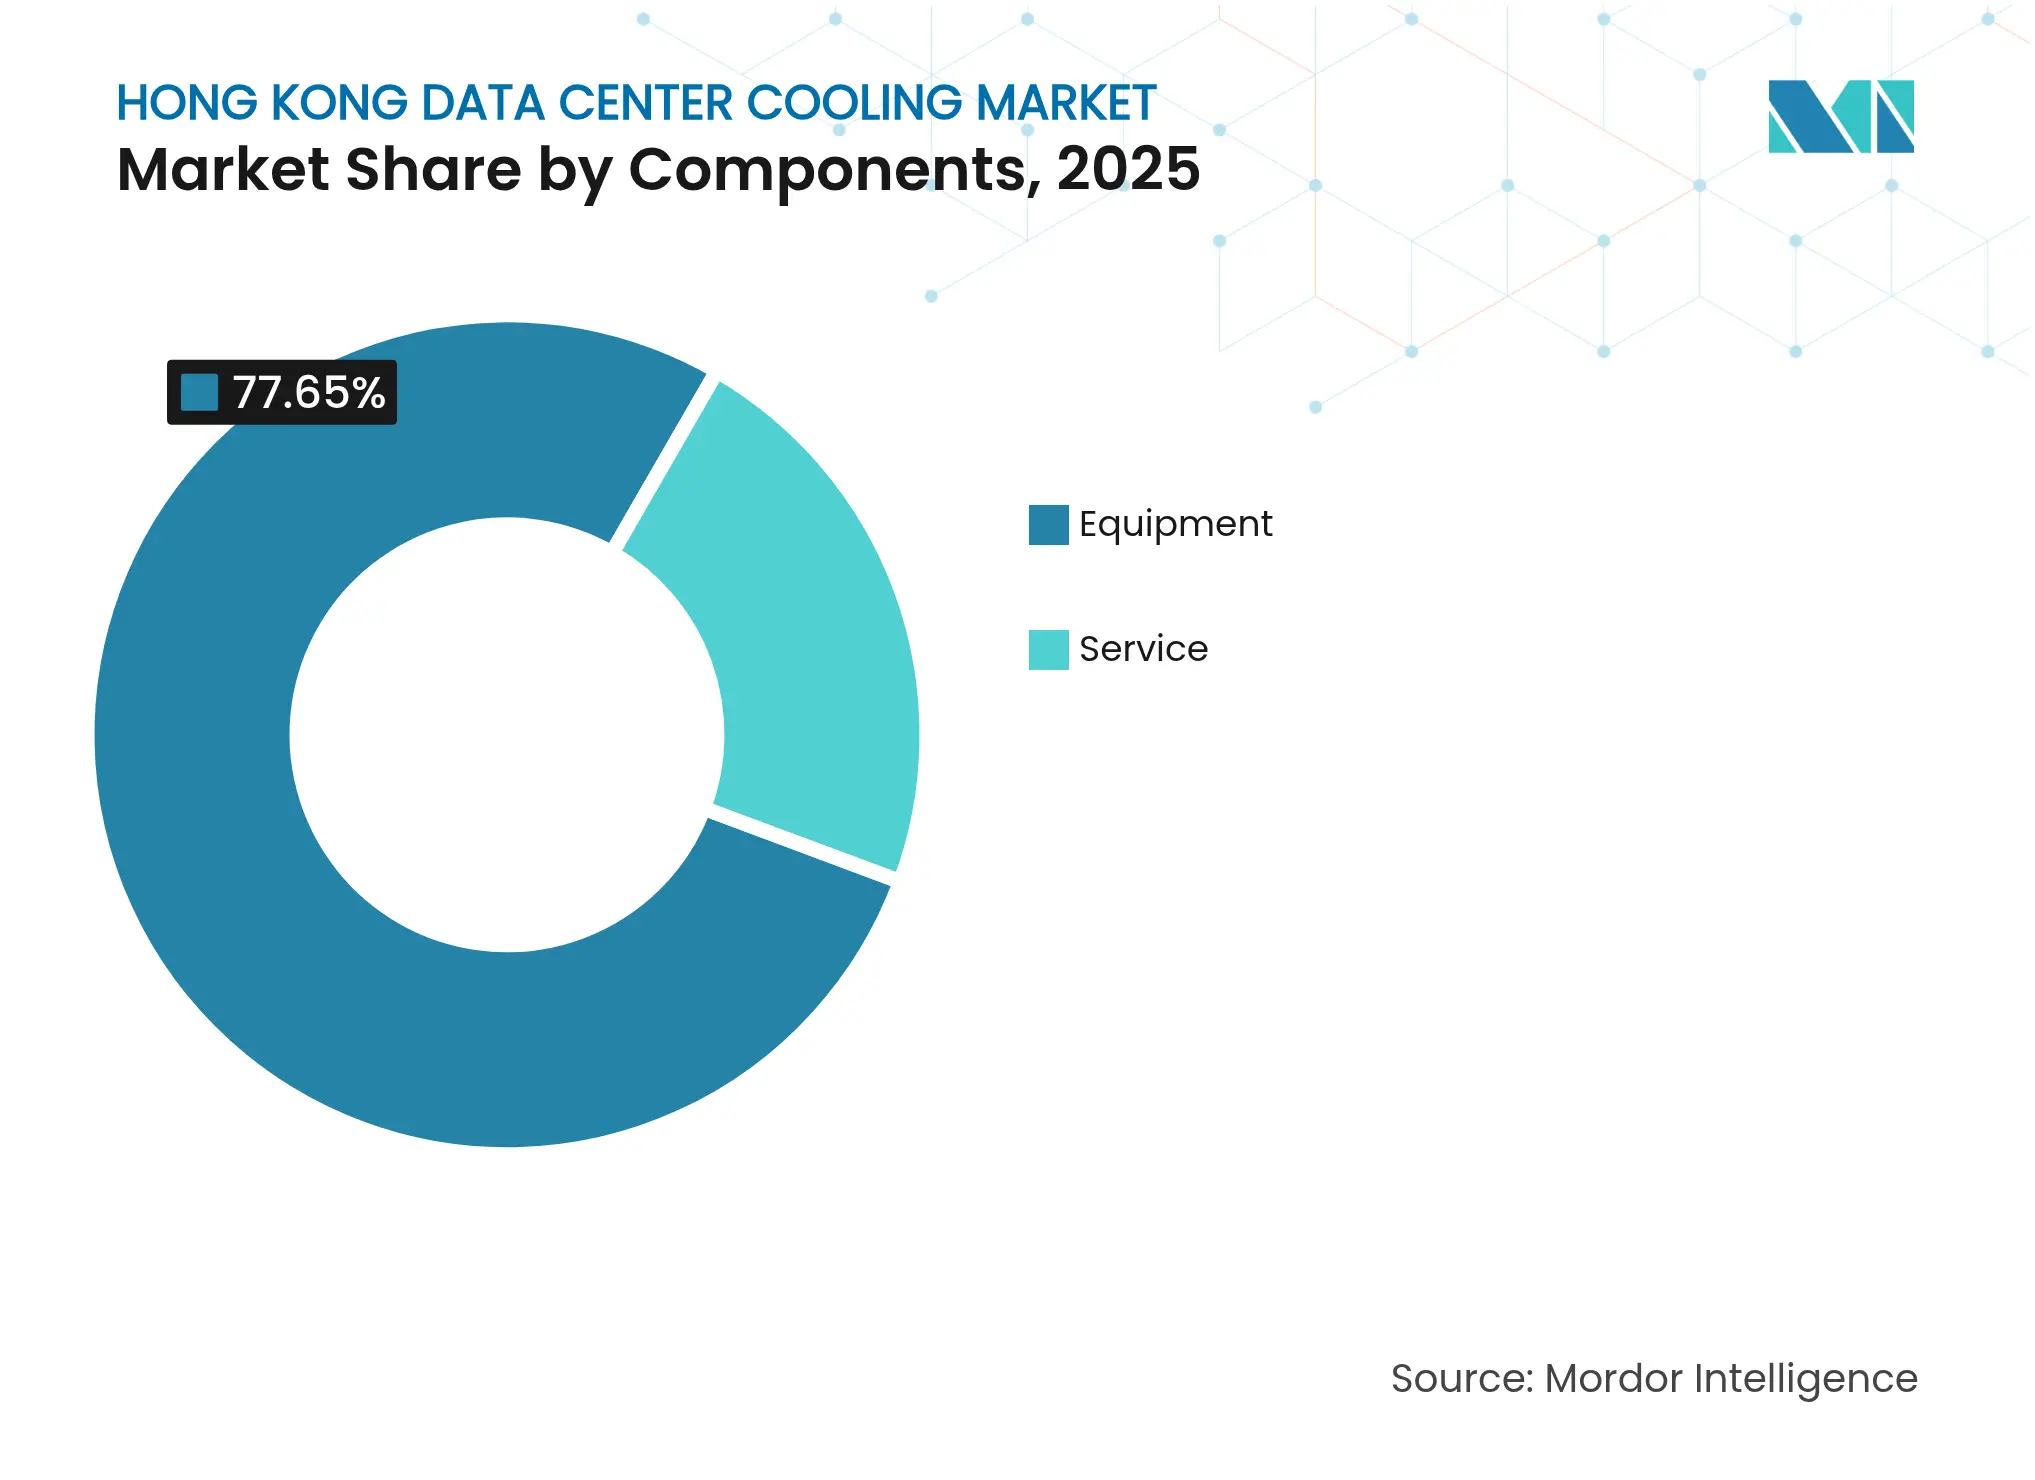
By Component: Services Segment Accelerates Growth
Equipment purchases represented 77.65% of the Hong Kong data center cooling market size in 2025, spanning chillers, pumps, dry-coolers, containment panels, and control systems. Nevertheless, the services slice is projected to grow at 19.95% CAGR as complexity rises. Design-assist engagements now cover CFD simulations for multi-storey airflow, fluid-compatibility testing for dielectric media, and digital-twin modeling for predictive maintenance.
Maintenance contracts expand to fluid sampling, particulate filtration, and leak-alarm calibration that differ markedly from filter-change routines in air systems. Vendor training academies supply immersion-specific certifications to mitigate the labour shortage. Additionally, performance-based service level agreements link fees to achieved PUE or water-usage effectiveness targets, effectively converting service providers into risk-sharing partners.
Note: Segment shares of all individual segments available upon report purchase
Hong Kong’s Tseung Kwan O district concentrates more than one-third of active server halls, clustering around dual cable stations and district-cooling conduits that feed adjacent industrial plots. The supply pipeline is set to rise from 317 MW in 2023 to about 700 MW by 2028, doubling the cooling load requirement. This escalation cements the Hong Kong data center cooling market as a cornerstone infrastructure layer for the Greater Bay digital-economy blueprint.
Coastal exposure introduces typhoon-induced salt-spray corrosion that shortens condenser-coil lifecycles. Operators respond with epoxy-coated tube sheets, seawater-compatible titanium plates, and hurricane-rated louver systems. Simultaneously, seawater-intake pilots in Kai Tak and Tseung Kwan O illustrate how large delta-T loops can leverage ambient water at 23 °C, reducing tower plume drift and trimming make-up water consumption.
Vertical data-center designs, necessitated by land scarcity, pose intricate coolant-distribution challenges. Engineers deploy risers with pressure-independent balancing valves and branch isolation headers every two floors to control column height pressure drops. The Hong Kong data center cooling market, therefore, now incorporates seismic snubbers, quick-close dampers, and redundancy logic that addresses both vertical stacking and seismic considerations.
Market Concentration
The Hong Kong data center cooling market is moderately fragmented. Schneider Electric, Vertiv, Carrier, and Johnson Controls anchor the air-cooling incumbency, while LiquidStack and ZutaCore spearhead immersion and direct-to-chip niches. LiquidStack’s Hong Kong pod achieved PUE 1.01 in 2024, setting a regional benchmark. Schneider countered by acquiring Motivair, embedding coolant distribution units into its Galaxy power-train line, and offering turnkey liquid blocks that interlock with EcoStruxure monitoring.
Strategic alliances between cooling OEMs and GPU vendors define the next phase of competition. Carrier’s investment in ZutaCore aligns its QuantumLeap chiller program with cold-plate loops optimized for 800 W processors, giving hyperscale prospects an integrated roadmap. Vertiv collaborates with NVIDIA on reference architectures that position CoolLoop skids directly beneath SXM-based AI racks, lowering rack-to-cooling latency and improving thermal excursion response times.
Edge-cooling remains a white-space segment. Start-ups promote micro-modular immersion tanks for 5G roadside shelters, while established vendors trial refrigerant-based pumped loops that eschew water entirely. Competitive intensity therefore pivots on breadth of technology portfolio, channel support for retrofit services, and access to sustainable coolant chemistries.

*Disclaimer: Major Players sorted in no particular order
1. INTRODUCTION
2. RESEARCH METHODOLOGY
3. EXECUTIVE SUMMARY
4. MARKET LANDSCAPE
5. MARKET SIZE and GROWTH FORECASTS (VALUE)
6. COMPETITIVE LANDSCAPE
7. MARKET OPPORTUNITIES and FUTURE OUTLOOK
Market Definitions and Key Coverage
Segmentation Overview
Detailed Research Methodology and Data Validation
Primary Research
Desk Research
Market-Sizing & Forecasting
Data Validation & Update Cycle
Why Mordor's Hong Kong Data Center Cooling Baseline Remains Highly Dependable
Benchmark comparison
| Market Size | Anonymized source | Primary gap driver | ||
|---|---|---|---|---|
USD 158.28 M (2025) | Mordor Intelligence | - | Anonymized source:Mordor Intelligence | Primary gap driver:- |
USD 250 M (2023) | Regional Consultancy A | Focuses only on equipment and mixes new build with retrofit spend, inflating the base. | ||
USD 301.1 M (2023) | Trade Journal B | Uses vendor shipment value without aligning to Hong Kong service revenue cut-offs. | ||
USD 8.5 B (2024) | Global Consultancy C | Bundles power, fire suppression, and site construction under "cooling," leading to extreme overstatement. |
Pricing Strategy for Semiconductor Components
3 Min Read
Accelerating Additive Manufacturing Adoption in India
3 Min Read
US Market Entry for Taiwanese Machine Tool Manufacturers
5 Min Read
When decisions matter, industry leaders turn to our analysts. Let’s talk.