Market Overview
| Study Period | 2021 - 2031 |
|---|---|
| Forecast Data Period | 2026 - 2031 |
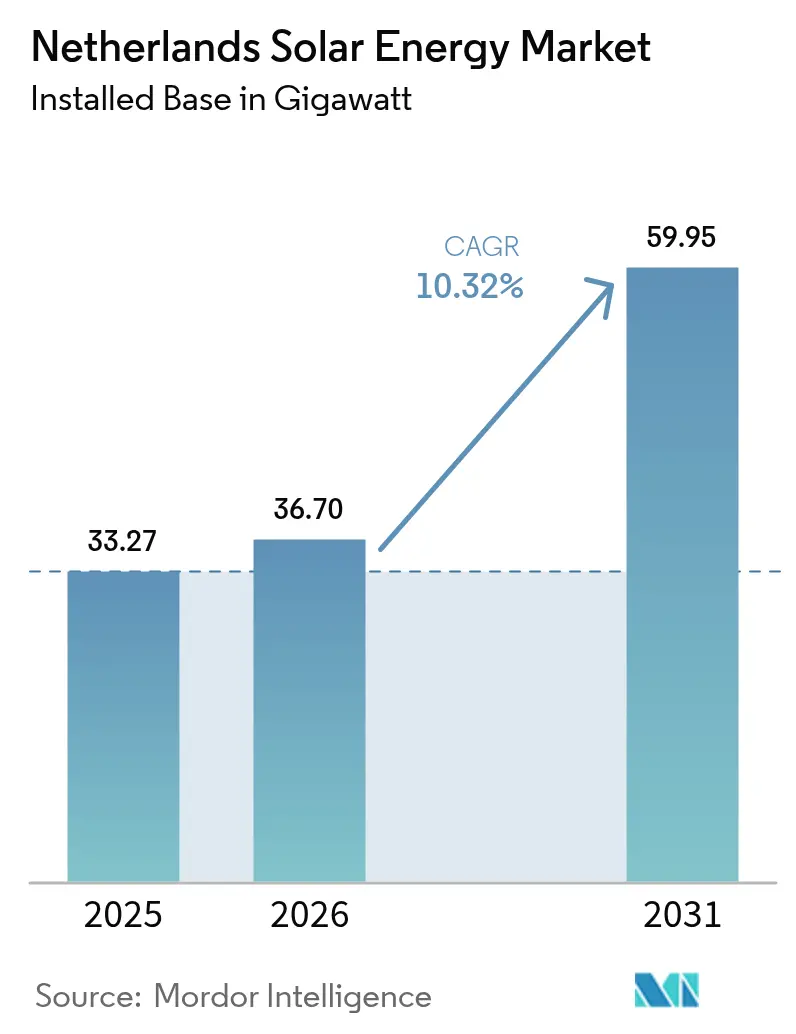
| Base Year Market Size (2025) | 33.27 gigawatt |
| Market Volume (2026) | 36.7 gigawatt |
| Market Volume (2031) | 59.95 gigawatt |
| Growth Rate (2026 - 2031) | 10.32% CAGR |
| Market Concentration | Low |
Major Players *Disclaimer: Major Players sorted in no particular order Image © Mordor Intelligence. Reuse requires attribution under CC BY 4.0. | |
Netherlands Solar Energy Market Analysis by Mordor Intelligence
The Netherlands Solar Energy Market size in 2026 is estimated at 36.7 gigawatt, growing from 2025 value of 33.27 gigawatt with 2031 projections showing 59.95 gigawatt, growing at 10.32% CAGR over 2026-2031.
Market Analysis
Strong policy mandates, a sustained decline in the levelized cost of electricity, and a pre-deadline rush ahead of the 2027 net-metering phase-out are reinforcing growth momentum. Corporate power-purchase agreements (PPAs) from data-center and retail giants are broadening demand beyond the residential segment, while agrivoltaic incentives are unlocking dual-use land opportunities. At the same time, developers are investing in hybrid solar-plus-storage designs to navigate curtailment risk and secure premium evening-hour revenues. Grid upgrades announced by TenneT, coupled with the EU Fit-for-55 framework, position the Netherlands' solar energy market as a resilient growth story through 2030.
Key Report Takeaways
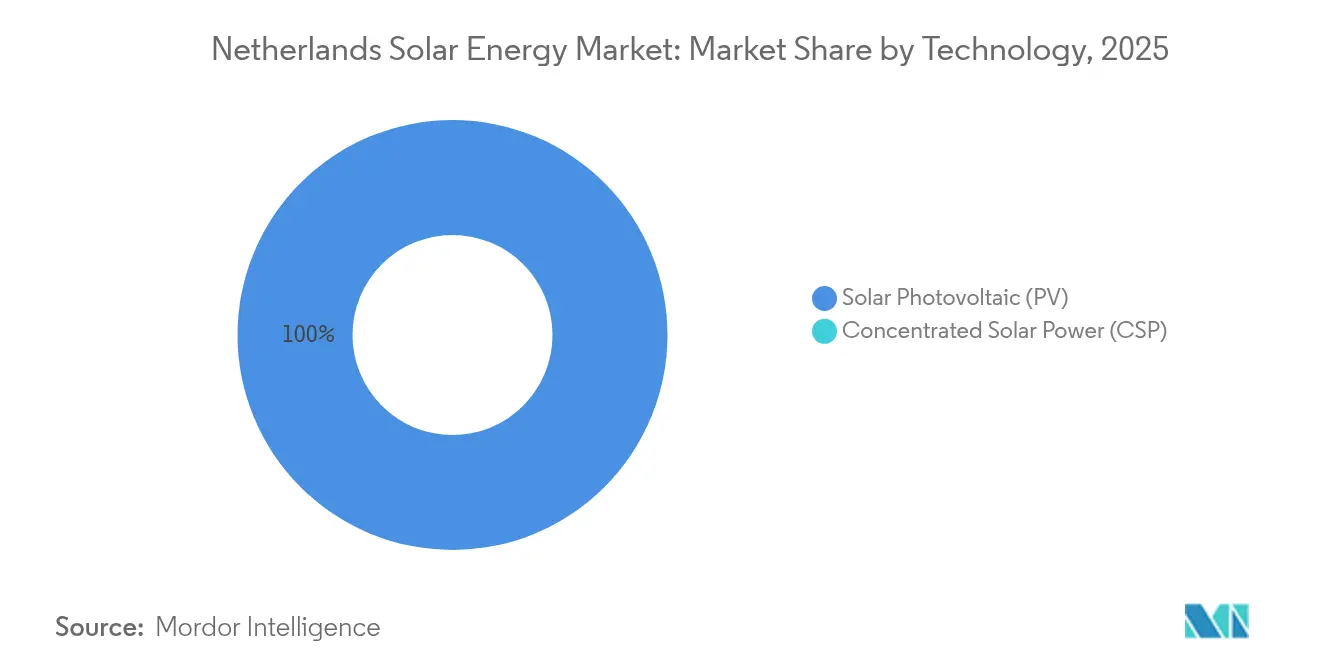
- By technology, photovoltaic systems held 100.00% of the Netherlands' solar energy market share in 2025.
- By grid type, on-grid assets commanded 98.62% of the Netherlands solar energy market size in 2025, while off-grid installations are advancing at a 15.21% CAGR toward 2031.
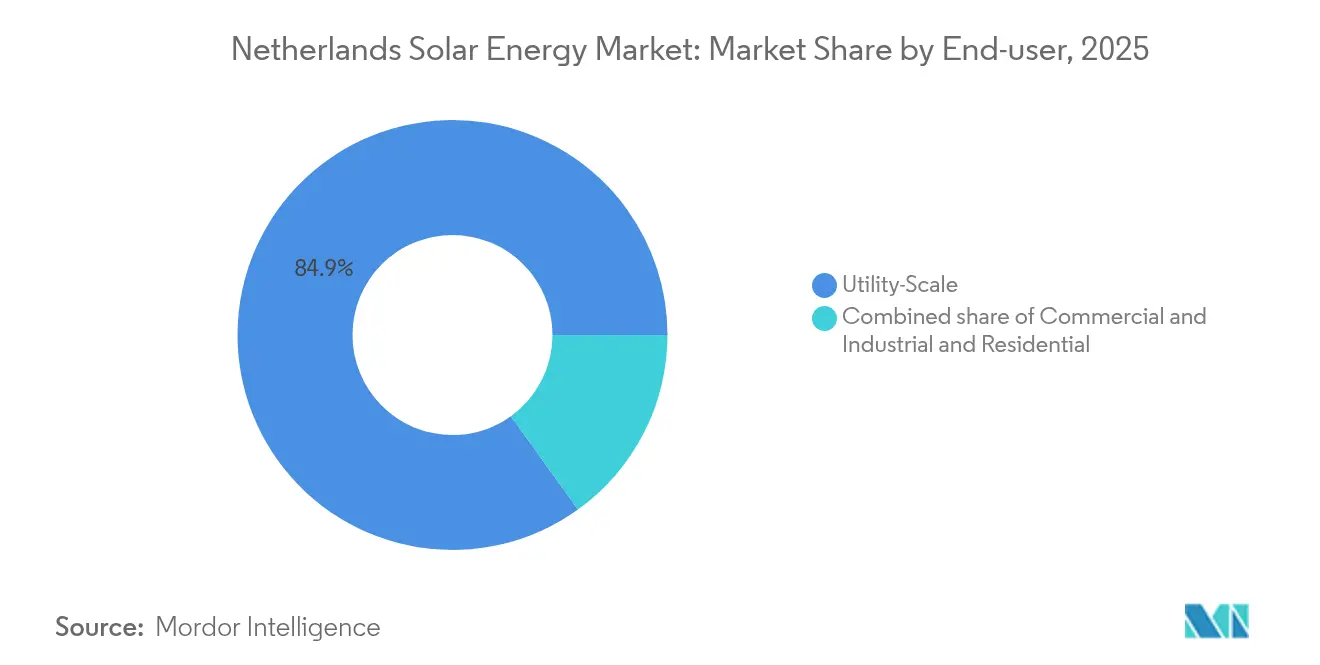
- By end-user, commercial and industrial projects grew 13.78% year over year in 2025 and are set to outpace utility-scale additions through 2031.
- By geography, Noord-Brabant and Limburg together accounted for 34.78% of installed capacity in 2025, whereas grid-constrained zones are forecast to register the highest curtailment-mitigation investments through 2028.
Note: Market size and forecast figures in this report are generated using Mordor Intelligence’s proprietary estimation framework, updated with the latest available data and insights as of 2026.
Netherlands Solar Energy Market Trends and Insights
Drivers Impact Analysis*
| Driver | (~) % Impact on CAGR Forecast | Geographic Relevance | Impact Timeline |
|---|---|---|---|
| EU Fit-for-55 targets accelerate PV roll-out | +2.80% | National, aligned with EU mandates | Long term (≥ 4 years) |
| Phase-out of net-metering after 2025 spurs pre-cut-off rush | +1.90% | National, residential & small C&I | Short term (≤ 2 years) |
| Corporate PPAs from data-center & retail giants | +2.30% | Amsterdam & Rotterdam corridors | Medium term (2-4 years) |
| Declining LCoE below EUR 0.04/kWh | +1.70% | Utility-scale clusters nationwide | Medium term (2-4 years) |
| Agri-PV subsidies for livestock shading | +0.90% | Gelderland & Noord-Brabant | Long term (≥ 4 years) |
| Curtailment-insurance products | +0.60% | Noord-Brabant, Limburg & Zeeland | Medium term (2-4 years) |
| Source: Mordor Intelligence | |||
EU Fit-for-55 Targets Accelerate PV Roll-Out
The EU requirement to source 39% of final energy from renewables by 2030 translates into roughly 70 TWh of additional clean electricity for the Netherlands.[1]European Commission, “Fit-for-55 Package,” ec.europa.eu Utility-scale solar currently offers the lowest delivered power cost, with 2024 projects achieving EUR 0.03–0.04 per kWh amid a 35% slide in module prices. The SDE++ program set aside EUR 11.5 billion in 2024 to close the wholesale-versus-renewable cost gap, yet auction volumes missed the 5 GW target by 18% because grid connections, not capital, remain the bottleneck.[2]Netherlands Enterprise Agency, “SDE++ 2024 Allocation,” rvo.nl Developers are therefore pairing photovoltaics with one- to two-hour batteries, allowing stored midday output to meet evening peaks and satisfy guarantees of origin demanded under Renewable Energy Directive II.
Phase-Out of Net-Metering After 2025 Spurs Pre-Cut-Off Rush
Retail prosumers can currently offset electricity imports at retail rates; however, the scheme ends on January 1, 2027, when exports will earn only the wholesale price minus grid fees. The change extends residential payback from seven to roughly eleven years, prompting a wave of orders through 2025. Installers report full calendars into Q3 2025, while household battery-attachment rates reached 22% in 2024, nearly triple the 2023 level. Demand beyond 2027 is uncertain, implying that corporate and utility buyers, not homeowners, will dominate the Netherlands solar energy market thereafter.
Corporate PPAs from Data-Center and Retail Giants
Microsoft and Google signed 200 MW and 100 MW PPAs, respectively, with Eneco in 2024, locking fixed prices for 10-15 years. These contracts bypass retail networks and secure finance at interest rates up to 150 basis points below SDE++ projects. Connection queues in Noord-Holland now exceed 36 months, prompting behind-the-meter solar adjacent to data centers. This PPA wave mitigates merchant risk and cements corporate procurement as a durable pillar of the Netherlands' solar energy market.
Declining LCoE Below EUR 0.04/kWh
All-in costs for 2024 utility sites dropped to EUR 0.03–0.04 per kWh, putting solar ahead of gas peakers on price. Bifacial panels, now 40% of new builds, add 10-15% output, and agrivoltaic ground treatments further boost rear irradiance. Yet curtailment lifts effective costs by up to EUR 0.012 per kWh in grid-choked provinces, making one- to two-hour batteries a standard design feature.
Restraints Impact Analysis*
| Restraint | (~) % Impact on CAGR Forecast | Geographic Relevance | Impact Timeline |
|---|---|---|---|
| Severe grid congestion in Noord-Brabant & Limburg | −1.8% | Southern provinces | Medium term (2-4 years) |
| Land-use opposition in Natura 2000 areas | −1.2% | Protected ecological zones | Long term (≥ 4 years) |
| Rising module waste-management costs | −0.7% | Nationwide | Long term (≥ 4 years) |
| Volatility in SDE++ clearing prices | −0.9% | Utility & large C&I | Short term (≤ 2 years) |
| Source: Mordor Intelligence | |||
Severe Grid Congestion in Noord-Brabant and Limburg
TenneT classifies both provinces as critical congestion zones, with a connection backlog topping 8 GW, three times the upgrade pipeline through 2027. Curtailment trims effective capacity factors to below 10%, forcing developers to install batteries that add EUR 0.15–0.20 per watt in capex. A proposed congestion-management scheme that would pay curtailed generators 90% of day-ahead prices remains under regulatory review, leaving near-term revenue uncertainty.
Land-Use Opposition in Natura 2000 Areas
Roughly 15% of Dutch territory falls under Natura 2000 protection, where environmental impact assessments can delay projects 18-24 months. Local objections have derailed several 50 MW-plus sites, pushing developers toward costly agrivoltaic or floating solutions. Even with streamlined priority-zone designations, only 30% of protected areas are fast-track eligible.
*Our forecasts treat driver/restraint impacts as directional, not additive. The impact forecasts reflect baseline growth, mix effects, and variable interactions.
Segment Analysis
By Technology: PV Monopoly Drives Innovation
Photovoltaics owned 100.00% of the Netherlands' solar energy market share in 2025, and the segment is forecast to post a 10.32% CAGR through 2031. Concentrated solar power remains absent due to sub-optimal direct normal irradiance of 1,000–1,100 kWh/m². Bifacial modules captured 40% of 2024 utility builds, and tandem perovskite-silicon prototypes reached 29% efficiency in domestic pilot lines run by the Solliance consortium.
Advances in tandem cells may shorten residential payback to under nine years once commercial releases start in 2026. Agrivoltaic roll-outs, supported by a EUR 200 million SDE++ envelope, use elevated racking that maintains farm output while tapping solar revenues, reinforcing land-use compatibility and sustaining the Netherlands solar energy market.


By Grid Type: Off-Grid Surge Targets Resilience
On-grid systems comprised 98.62% of installed capacity in 2025, yet off-grid arrays are forecast to expand at a 15.21% CAGR by 2031. Hyperscale data centers adopt islandable solar-plus-diesel-plus-battery clusters to mitigate outages costing EUR 10,000–15,000 per minute. Hybrid configurations cut daytime diesel burn and ensure uptime while bypassing congested interconnection queues. Grid-tied assets remain dominant, but rising curtailment risk is motivating designs that can island during congestion, store excess energy, then re-export once constraints ease, blurring the on-versus off-grid dichotomy in the Netherlands solar energy market.
By End-User: C&I Outpaces Utility Growth
Utility-scale farms held 84.92% of the Netherlands' solar energy market size in 2025. However, commercial and industrial installations are tracking a 13.78% CAGR to 2031 as corporate PPAs unlock sub-4% financing. Warehouses around Rotterdam and Amsterdam host 1–1.5 MW rooftop systems that offset up to 40% of load. Solar-as-a-service contracts eliminate upfront capex, accelerating uptake. Residential momentum is slowing; 2.6 million homes already feature PV, and net-metering sunset discourages new adopters beyond 2026. Utility builds still anchor volume additions, but C&I flexibility, rooftop availability, and tariff hedging prospects are shifting growth weight toward corporate buyers in the Netherlands solar energy market.
Geography Analysis
The Netherlands' solar energy market exhibits stark regional contrasts. Noord-Brabant and Limburg supplied 34.78% of capacity in 2025, lifted by marginally higher irradiance and lower land prices, yet both provinces face substation curtailment exceeding 15% of output. A EUR 4 billion TenneT expansion aims to add 3 GW of capacity by 2028, potentially clearing an 8 GW connection queue. In the interim, developers pivot to Noord-Holland and Zuid-Holland, where behind-the-meter PPAs with data centers bypass grid queues and stabilize revenues.
Gelderland and Overijssel, constrained by Natura 2000 overlap, are emerging hotspots for agrivoltaic projects that blend livestock grazing with power generation. Coastal Zeeland and Friesland exploit hybrid solar-wind synergies, sharing grid links and smoothing seasonal intermittency. Groningen and Drenthe cut permitting for agrivoltaics to 12 months, catalyzing northern cluster growth. Whether the Netherlands' solar energy market consolidates into high-capacity southern hubs post-upgrade or remains distributed hinges on grid build-out timelines and land-use compromises.
Competitive Landscape
The top five developers, Vattenfall, Eneco, GroenLeven, BayWa r.e., and Shell Renewables, control roughly 45% of utility pipelines, indicating moderate concentration. Vertically integrated utilities leverage EPC and trading desks to capture value chain margins, while Chinese module makers vie for cost and product innovation. Residential and C&I installation remains fragmented among 200-plus contractors, though roll-ups by solar-as-a-service platforms are accelerating.
Competitive edges now rest on three pillars: securing long-dated corporate PPAs, mastering agrivoltaic engineering to navigate land constraints, and integrating storage to monetize price spreads. SMA Solar and GoodWe are embedding grid-forming inverters that qualify solar plants for voltage support and black-start services. Floating solar, curtailment insurance, and virtual power plants represent emerging niches. EU WEEE compliance is also differentiating suppliers like First Solar that run take-back schemes.
Netherlands Solar Energy Industry Leaders
Solarfields Nederland BV
DMEGC Solar Energy
Vattenfall AB
Orsted A/S
AB SOLAR TOTAL.
- *Disclaimer: Major Players sorted in no particular order

Recent Industry Developments
- August 2024: TenneT has announced a EUR 4 billion grid expansion package to add 3 GW of substation capacity in Limburg and Noord-Brabant, the Netherlands. This investment is part of a larger €200 billion investment plan across the Netherlands and Germany, spanning 2034, aimed at upgrading and expanding the electricity grid to support the energy transition.
- April 2024: RVO introduced a EUR 200 million agrivoltaic envelope and lowered the SDE++ size floor to 5 kW. The Netherlands Enterprise Agency (RVO) has introduced specific policy changes within the SDE++ subsidy scheme to encourage the growth of agrivoltaics (agri-PV) projects.


Netherlands Solar Energy Market Report Scope
Solar energy is heat and radiant light from the Sun that can be harnessed with technologies such as solar power (used to generate electricity) and solar thermal energy (used for applications such as water heating).
The Netherlands solar energy market is segmented by technology, grid type, and end-user. By technology, the market is segmented into solar photovoltaic, concentrated solar power. By grid type, the market is segmented into on-grid and off-grid. By end-user, the market is segmented into utility-scale, commercial and Industrial (C&I), and residential. The report also covers the market size and forecasts for Argentina.
For each segment, the market sizing and forecasts have been done based on the installed capacity (GW).
By Technology
| Solar Photovoltaic (PV) |
| Concentrated Solar Power (CSP) |
By Grid Type
| On-Grid |
| Off-Grid |
By End-User
| Utility-Scale |
| Commercial and Industrial (C&I) |
| Residential |
By Component (Qualitative Analysis)
| Solar Modules/Panels |
| Inverters (String, Central, Micro) |
| Mounting and Tracking Systems |
| Balance-of-System and Electricals |
| Energy Storage and Hybrid Integration |
| By Technology | Solar Photovoltaic (PV) |
| Concentrated Solar Power (CSP) | |
| By Grid Type | On-Grid |
| Off-Grid | |
| By End-User | Utility-Scale |
| Commercial and Industrial (C&I) | |
| Residential | |
| By Component (Qualitative Analysis) | Solar Modules/Panels |
| Inverters (String, Central, Micro) | |
| Mounting and Tracking Systems | |
| Balance-of-System and Electricals | |
| Energy Storage and Hybrid Integration |


Key Questions Answered in the Report
How large is the Netherlands solar energy market in 2026?
Installed capacity totals 36.7 GW, and the Netherlands solar energy market is on track for 59.95 GW by 2031.
What CAGR is forecast for Dutch solar from 2026 to 2031?
The market is expected to register a 10.32% CAGR during the period.
Will the net-metering phase-out halt residential solar growth in the Netherlands?
Orders are surging until 2026, but residential demand is likely to slow post-2027, shifting growth to corporate and utility projects.
Which segment is growing fastest in Dutch solar?
Commercial and industrial installations lead with a forecast 13.78% CAGR through 2031 due to widespread corporate PPAs.
Where are grid constraints most severe for Dutch solar developers?
Noord-Brabant and Limburg provinces face the highest curtailment rates and connection backlogs.
What technology trend will shape Dutch solar competitiveness beyond 2026?
Hybrid solar-plus-storage systems that capture price spreads and mitigate curtailment are becoming the new investment benchmark.
Page last updated on:


