Native Starch Market Size and Share
Market Overview
| Study Period | 2021 - 2031 |
|---|---|
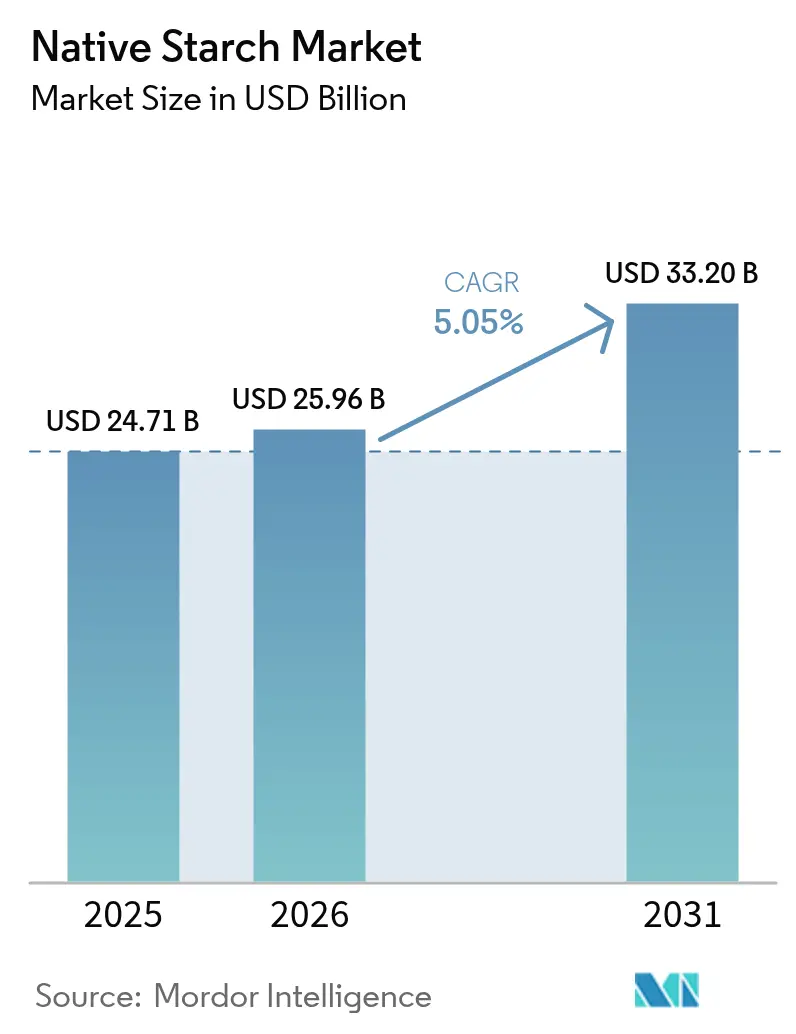
| Market Size (2026) | USD 25.96 Billion |
| Market Size (2031) | USD 33.2 Billion |
| Growth Rate (2026 - 2031) | 5.05% CAGR |
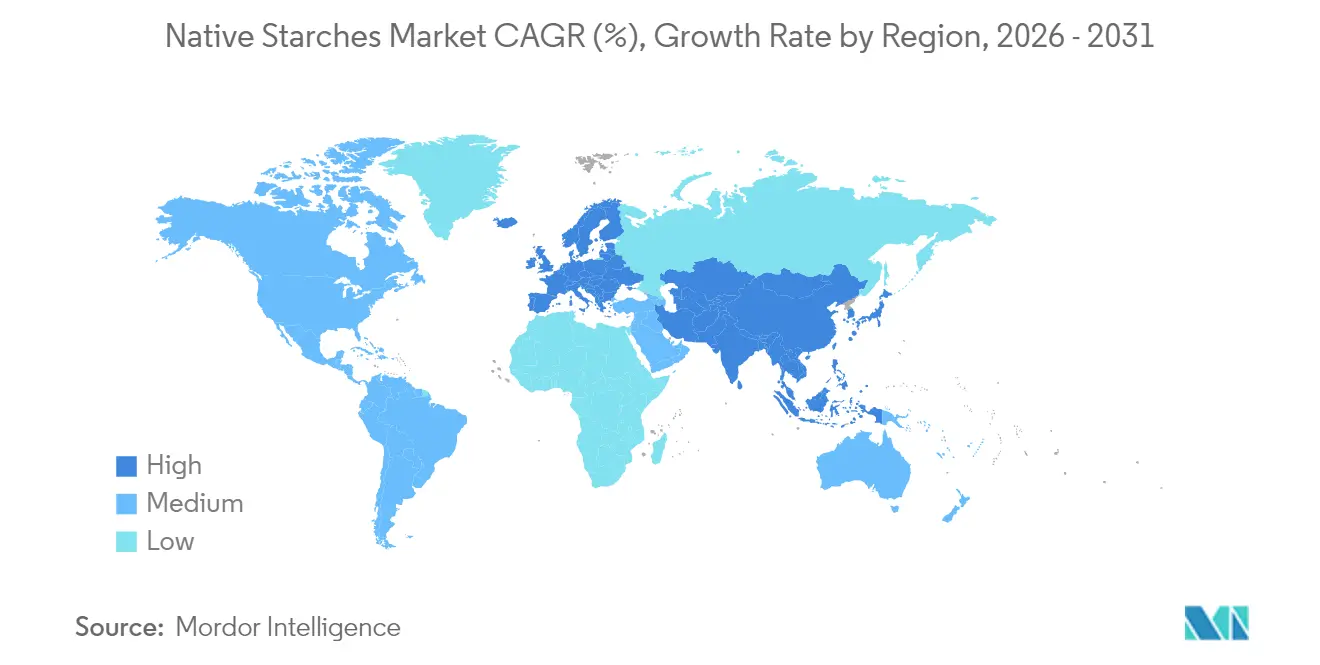
| Fastest Growing Market | Middle East and Africa |
| Largest Market | Asia Pacific |
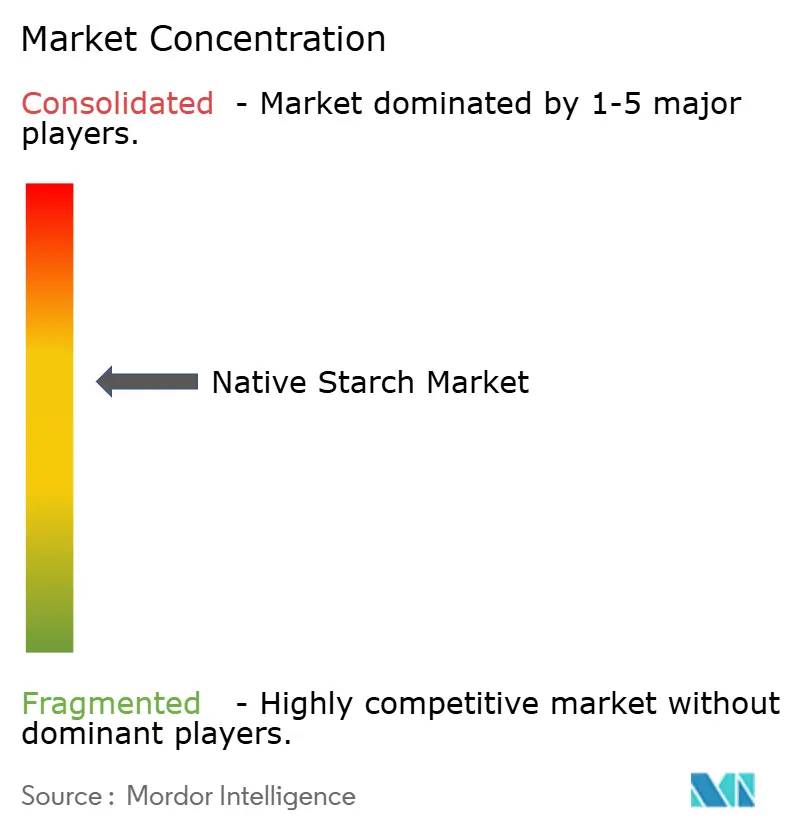
| Market Concentration | Medium |
Major Players
*Disclaimer: Major Players sorted in no particular order Image © Mordor Intelligence. Reuse requires attribution under CC BY 4.0. |
|
Native Starch Market Analysis by Mordor Intelligence
The native starch market size was valued at USD 24.71 billion in 2025 and estimated to grow from USD 25.96 billion in 2026 to reach USD 33.2 billion by 2031, at a CAGR of 5.05% during the forecast period (2026-2031). This growth is driven by expanding applications in food, pharmaceuticals, personal care, paper, adhesives, and bioplastics, alongside clean-label reformulation trends that elevate native starch as a functional, chemical-free ingredient. Producers are addressing raw-material price volatility through diversified sourcing, vertical integration, and advancements in extraction technologies that improve yields and reduce resource use. Key demand areas include bakery, confectionery, dairy, meat alternatives, and biodegradable packaging, with plant-based diets and functional foods further boosting its role as a texturizer and nutritional component. Industrial users in paper and packaging are adopting starch for sustainability goals, prompting investments in specialty grades and technologies like ultrasound-assisted extraction and heat-moisture treatments to enhance performance while maintaining a clean-label profile. Despite regulatory challenges and agricultural cost fluctuations, these factors collectively sustain the market's growth trajectory.
Key Report Takeaways
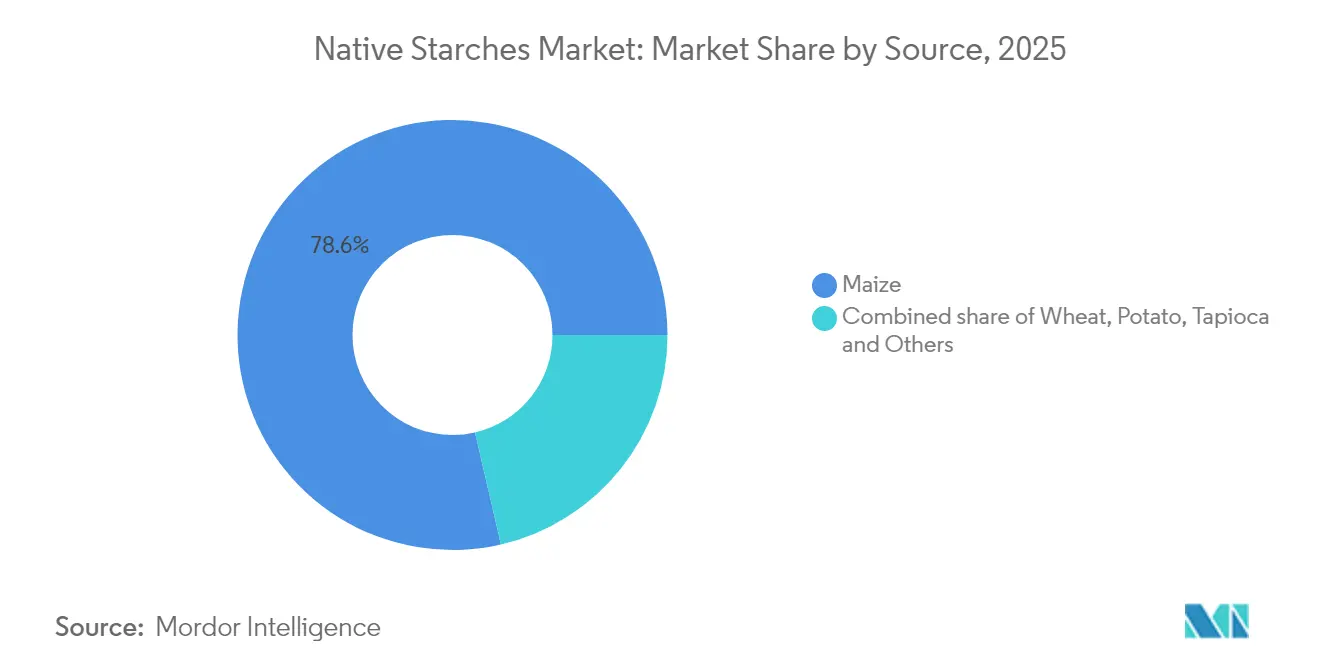
- By source, maize captured 78.62% of the native starch market share in 2025, while tapioca is projected to grow at a 5.32% CAGR between 2026 and 2031.
- By form, powder commanded 79.15% share of the native starch market size in 2025; liquid formats are advancing at a 5.78% CAGR through 2031.
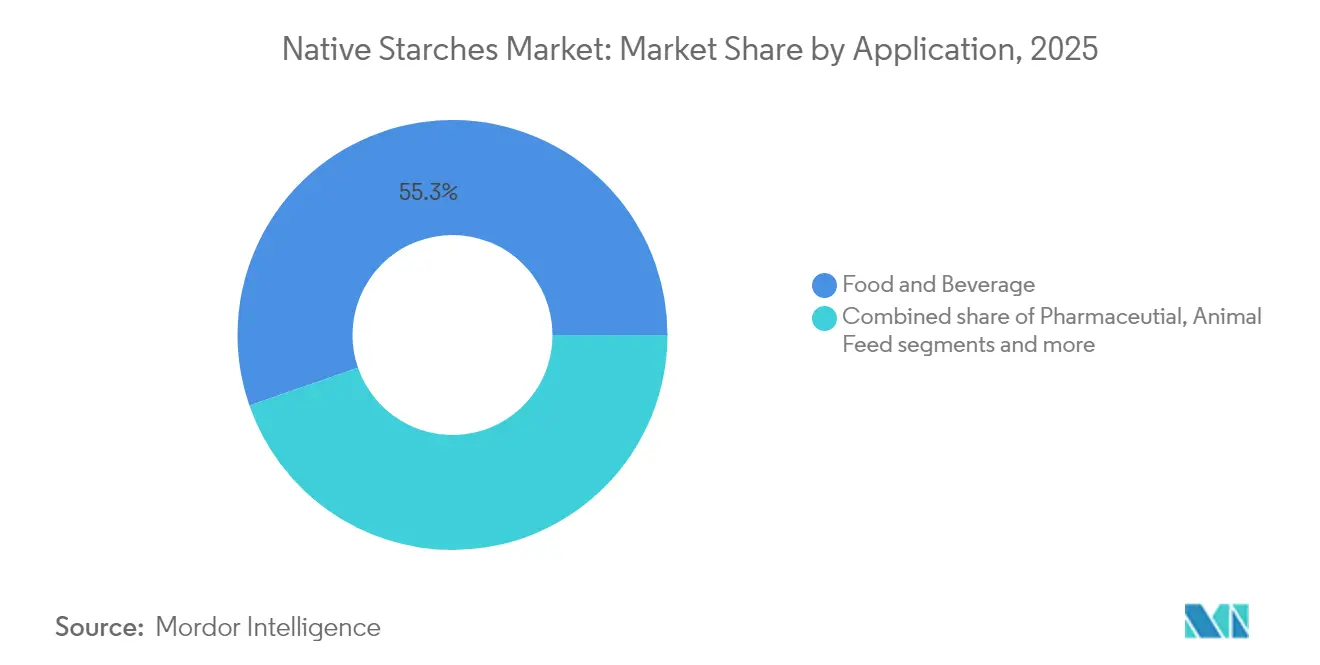
- By application, food and beverage accounted for 55.32% share of the native starch market size in 2025, whereas the pharmaceutical application records the highest 5.98% CAGR to 2031.
- By geography, Asia-Pacific led with 31.94% revenue share in 2025, whereas the Middle East and Africa region is forecast to expand at a 5.61% CAGR through 2031.
Note: Market size and forecast figures in this report are generated using Mordor Intelligence’s proprietary estimation framework, updated with the latest available data and insights as of 2026.
Global Native Starch Market Trends and Insights
Drivers Impact Analysis*
| Driver | (~) % Impact on CAGR Forecast | Geographic Relevance | Impact Timeline |
|---|---|---|---|
| Growing Usage in Bakery and Confectionery as a Texturizer | +1.2% | Global, with stronger impact in Europe and North America | Medium term (2-4 years) |
| Cost-Effective Thicking Agent for Processed Foods | +0.9% | Global, with significant impact in Asia-Pacific and South America | Short term (≤ 2 years) |
| Rise in Demand for Plant-Based and Functional Food Ingredients | +1.4% | North America, Europe, with growing impact in Asia-Pacific | Long term (≥ 4 years) |
| Adoption of Native Starch in Industrial Applications Beyond Food | +0.8% | Global, with stronger impact in Europe and North America | Medium term (2-4 years) |
| Strategic Collaboration Between Food Giants and Local Starch Producers | +0.6% | Global, with emphasis on Asia-Pacific and South America | Medium term (2-4 years) |
| Inclusion of Native Starch in Food Driven by Clean Label Trend | +1.1% | North America, Europe, with growing adoption in Asia-Pacific | Medium term (2-4 years) |
| Source: Mordor Intelligence | |||
Growing Usage in Bakery and Confectionery as a Texturizer
Native starch is increasingly favored in the bakery and confectionery sectors for its ability to enhance texture, retain moisture, and extend shelf life without chemical additives. This strategic reformulation helps manufacturers meet clean-label demand while reducing production costs. Maize and tapioca-derived native starches, valued for their neutral flavors, perform well in high-sugar contexts, ensuring stability and preserving sensory qualities. Acting as both a thickening agent and texturizer, native starch simplifies ingredient lists and ensures consistent product quality globally. Regulatory support further drives adoption. For example, the U.S. FDA promotes transparency in food labeling, encouraging natural ingredients, while Europe’s Clean Label Project influences consumer choices toward alternatives like native starch. In the Asia-Pacific region, rising incomes and food quality awareness are boosting demand for clean-label bakery and confectionery products. These factors position native starch as essential for meeting consumer preferences and regulatory requirements, driving global market growth.
Cost-Effective Thickening Agent for Processed Foods
Native starch, increasingly favored in the processed food sector, stands out for its cost-effective thickening properties. It delivers consistent results at a lower price than hydrocolloids and other specialty ingredients. This financial edge is vital for food producers contending with inflation while maintaining stable prices. Derived from maize and potatoes, native starches undergo minimal processing, reducing production costs and conserving energy compared to modified counterparts or plant protein texturizers. Their adaptability to various pH levels and processing conditions allows for standardization in diverse products, from soups and sauces to dairy alternatives and ready meals. USDA data shows U.S. maize production reached 389.67 million metric tons in 2023/24, ensuring a steady raw material supply [1]Source: U.S. Department of Agriculture, "USDA Grain World Markets and Trade-2025", www.fas.usda.gov. This abundance enhances the cost-effectiveness of native starches, solidifying their status as a top choice for manufacturers. Advancements in starch extraction technologies have improved yield rates and functional attributes, enabling manufacturers to achieve desired viscosity and mouthfeel with less starch. These improvements reduce supply chain costs and bolster a clean label image.
Rise in Demand for Plant-Based and Functional Food Ingredients
With the growing popularity of plant-based foods and functional nutrition products, demand for native starch has surged. Once seen as just a carbohydrate source, native starch, especially its resistant variants, is now valued for its prebiotic properties and potential in managing blood glucose. This versatility makes it essential in plant-based formulations. Food manufacturers are using native starches from various botanical sources to craft textures in meat alternatives, creating fibrous structures and retaining moisture to mimic animal proteins. Its clean label status further boosts its appeal in the premium functional food market, where ingredient transparency is key. Government initiatives also highlight the global native starches market's growth. The European Union's Common Agricultural Policy (CAP) promotes sustainable farming and starch-producing crops, aligning with consumer demand for clean-label and plant-based products. Additionally, the Food and Agriculture Organization (FAO) emphasizes native starches in enhancing plant-based diets and addressing global food security. These factors underscore native starch's importance in meeting evolving consumer and industry needs.
Adoption of Native Starch in Industrial Applications Beyond Food
Driven by a quest for sustainability, the industrial sector is increasingly turning to native starch, marking a notable expansion beyond its traditional food-centric applications. Leading the charge, the paper and packaging industries are integrating native starches into surface sizing, coatings, and adhesives. These industries reap the environmental benefits of starch's biodegradability, especially in single-use applications facing mounting regulatory scrutiny. Innovations in starch-based bioplastics, boasting enhanced performance and superior end-of-life characteristics, are propelling this trend further. Meanwhile, the pharmaceutical sector is harnessing native starch as a multifunctional excipient in tablet formulations, crucial for disintegration, binding, and controlled release. This widespread adoption across industries not only stabilizes and diversifies demand for starch producers, shielding them from sector-specific fluctuations, but also spurs investments in specialized starch grades tailored for distinct industrial needs.
Restraints Impact Analysis*
| Restraint | (~) % Impact on CAGR Forecast | Geographic Relevance | Impact Timeline |
|---|---|---|---|
| Fluctuating Agricultural Raw Material Prices Impact Industry Profit Margins | -0.7% | Global, with higher impact in regions with climate vulnerability | Medium term (2-4 years) |
| Complex Regulatory Requirements | -0.5% | North America, Europe, with increasing impact in Asia-Pacific | Long term (≥ 4 years) |
| Potential Allergen Concerns for Wheat-Based Starch | -0.3% | Global, with stronger impact in North America and Europe | Short term (≤ 2 years) |
| Moisture Sensitivity of Native Starch Reduces Shelf Life | -0.4% | Global, with higher impact in humid tropical regions | Medium term (2-4 years) |
| Source: Mordor Intelligence | |||
Fluctuating Agricultural Raw Material Prices Impact Industry Profit Margins
Producers in the native starch industry face margin pressures due to agricultural commodity price volatility. Maize starch manufacturers are particularly affected, competing with the biofuel sector for raw materials. Climate change-induced weather disruptions, such as droughts in key regions, have worsened harvest uncertainties, causing supply shortages and price spikes that cannot be quickly passed to industrial clients with long-term contracts. To address this, producers are diversifying starch sources and integrating vertically into agricultural production. Many are forming direct farmer partnerships with guaranteed pricing to secure supply chains and investing in processing technologies to handle varying crop qualities while maintaining product standards. Although these strategies require significant capital, they are essential for staying competitive in the market.
Complex Regulatory Requirements
The regulatory landscape for native starch is becoming increasingly complex, posing compliance challenges for smaller producers and emerging market players. Manufacturers must navigate diverse regulations on food safety, genetic modification, allergen management, and sustainability certifications across export markets. For example, the European Union's strict non-GMO documentation requirements compel maize starch producers to establish segregated supply chains and conduct extensive testing. Additionally, the pharmaceutical industry's use of native starch as an excipient subjects it to stricter good manufacturing practice (GMP) standards, requiring specialized production and validation. These demands drive consolidation as smaller producers struggle with costs, while vertically integrated firms gain a competitive edge by maintaining supply chain documentation. To address compliance and consumer transparency, forward-thinking manufacturers are adopting blockchain-based traceability systems.
*Our forecasts treat driver/restraint impacts as directional, not additive. The impact forecasts reflect baseline growth, mix effects, and variable interactions.
Segment Analysis
By Source: Maize Dominates, Tapioca Accelerates
In 2025, maize leads the native starch market with a 78.62% share, driven by its cost-effectiveness, availability, and versatile properties. Wet milling processes for maize starch extraction provide economic advantages over alternatives. Wheat starch, though secondary, offers unique protein interactions for bakery applications, but faces growth challenges due to gluten allergen concerns. Potato starch, valued for its thickening power and neutral flavor, is favored in clean-label applications despite higher costs. Tapioca starch, the fastest-growing segment, is projected to grow at a 5.32% CAGR (2026-2031) due to its freeze-thaw stability and clear gel formation, ideal for frozen foods and transparent sauces.
The competitive dynamics among starch sources are shifting as manufacturers increasingly develop specialized grades optimized for specific applications rather than treating native starches as commodity ingredients. This specialization strategy is particularly evident in the tapioca segment, where producers are leveraging its natural functional properties to target premium clean label applications without chemical modification. Simultaneously, research into unconventional starch sources like pea, palm, and other botanical origins is expanding the industry's raw material base, creating opportunities for product differentiation and supply chain resilience that will reshape competitive dynamics over the forecast period.


By Form: Powder Leads, Liquid Gain Momentum
In 2025, powdered native starch leads the market with a 79.15% share due to its storage stability, transport ease, and versatility. Manufacturers value its precise dosing and long shelf life, essential for ingredients stored before use. The food industry's infrastructure for powdered ingredients further supports this dominance with minimal production adjustments. Meanwhile, liquid native starch, though holding a smaller share, is set to grow at a 5.78% CAGR from 2026 to 2031, driven by seamless integration into continuous systems and reduced dust-related hazards.
Advancements in powder processing enhance native starch's functionality while preserving its clean label status, opening new applications traditionally dominated by modified starches. For instance, improved milling techniques optimize particle size for better dispersion and cold-water solubility without chemicals. Ingredion's functional native corn starch exemplifies this trend, matching modified variants' performance while maintaining a clean label. Simultaneously, liquid starch benefits from stabilization technologies that extend shelf life without preservatives, addressing a key challenge. These innovations expand applications for both formats, with manufacturers choosing based on processing needs rather than limitations.
By Application: Food and Beverage Leads While Pharmaceutical Accelerates
In 2025, the food and beverage sector leads the market with a 55.32% share, highlighting native starch's role as a texturizer, stabilizer, and bulking agent. Bakery and dairy applications dominate, leveraging their properties to enhance texture and support clean labels. In personal care and cosmetics, demand grows for natural alternatives to synthetic thickeners, especially in clean beauty products. The paper and corrugating industry uses native starch as a sustainable binder and coating agent, improving printability and surface properties.
Although smaller in current market value, the pharmaceutical sector is the fastest-growing, projected to expand at a CAGR of 5.98% between 2026 and 2031. Premium-grade native starch is increasingly used in tablet disintegration and capsule filling due to its compliance with pharmacopeia standards. The sector is also exploring its use in novel drug delivery systems, leveraging the material’s biocompatibility and biodegradability. The "Others" category, including bioplastics, adhesives, and textile processing, continues to expand, reflecting native starch’s broader industrial reach as industries seek renewable alternatives to petroleum-derived materials. This cross-industry adoption supports stable demand while encouraging specialization in starch grades tailored to specific technical requirements.
Geography Analysis
In 2025, Asia-Pacific leads the native starch market with a 31.94% share, fueled by its vast food processing sector and broadening industrial uses. China and India, prioritizing food security and industrial autonomy, act as the region's main growth drivers. Benefiting from rich agricultural resources and reduced production costs, producers in Asia-Pacific can sustain healthy margins even when raw material prices fluctuate. Thailand, bolstered by supportive weather and government initiatives, has positioned itself as a key player in tapioca starch, enhancing cassava production. Meanwhile, India's native starch landscape is evolving, with maize output projected to hit 42 million tons by 2025-26 . This surge is set to bolster domestic processing, curtail imports, and elevate India to the status of an emerging exporter.
Europe holds a prominent stance in the market, leading in potato and wheat starch production. The continent has honed specialized extraction techniques, ensuring top-tier product quality. Europe's regulatory stance, especially on GMO matters, has influenced its production dynamics, leading to distinct supply chains that fetch premium prices globally. North America, with its efficient maize starch production, sees the U.S. as a key global player and exporter. Emphasizing technological advancements, companies like Ingredion highlight that starches made up nearly 49% of their USD 7.4 billion net sales in 2024 . Middle East and Africa, starting from a modest base, is poised for the most rapid growth, with a projected 5.61% CAGR from 2026 to 2031. This growth is largely driven by strategic investments in food security, especially in Gulf Cooperation Council nations aiming to lessen their import reliance. However, the region grapples with challenges like water scarcity and agricultural constraints. These hurdles are steering investments towards efficient processing technologies and alternative starch sources that align with local agricultural conditions. In South America, Brazil and Argentina dominate the scene, leveraging their abundant maize production to offer competitive advantages for native starch producers catering to both local and international markets.

Competitive Landscape
The native starch market exhibits moderate consolidation, characterized by the presence of established multinational corporations alongside regional specialists with strong positions in specific geographies or starch sources. The focus of strategic differentiation has shifted from mere cost leadership to a more nuanced approach, emphasizing specialized product development, sustainable sourcing, and vertical integration throughout the value chain. Industry giants such as Ingredion, Archer Daniels Midland, and Tate & Lyle are not only bolstering their native starch portfolios through internal research and development but are also making strategic acquisitions. These companies are leveraging their global presence, advanced technological capabilities, and extensive distribution networks to maintain their competitive edge. Additionally, they are investing in partnerships and collaborations to enhance their market reach and product offerings.
Meanwhile, regional specialists in the Asia-Pacific, capitalizing on local agricultural strengths and their closeness to burgeoning markets, have carved out competitive niches, even if they don't boast the scale of their global counterparts. These players often focus on leveraging indigenous raw materials and tailoring their products to meet the specific needs of local consumers. Their agility in responding to regional market dynamics and their ability to offer cost-effective solutions have enabled them to sustain their market positions. Furthermore, these regional companies are increasingly exploring export opportunities to expand their footprint beyond domestic markets, thereby intensifying competition in the global arena.
Innovation in the sector is taking a turn. The emphasis is now on boosting native starch functionality without resorting to chemical modifications. Techniques such as ultrasound treatment, annealing, and controlled heat-moisture applications are being harnessed, achieving desired properties that once necessitated chemical methods. This shift not only resonates with the rising consumer preference for clean label ingredients but also fortifies the industry's intellectual property landscape. Companies are actively investing in research to develop proprietary technologies that enhance the performance of native starch in various applications, including food and beverages, pharmaceuticals, and industrial sectors. The focus on clean label solutions is also driving collaborations between manufacturers and end-users to co-develop products that align with evolving consumer trends.
Native Starch Industry Leaders
-
Cargill, Incorporated
-
Archer Daniels Midland Company
-
Ingredion Incorporated
-
Tate & Lyle PLC
-
Roquette Frères S.A.
- *Disclaimer: Major Players sorted in no particular order

Recent Industry Developments
- May 2025: KMC, a Danish farmer-owned starch specialist, has partnered with UK-based Daymer Ingredients to expand the reach of its native potato starches in the UK. The collaboration will later include functional and modified variants, supporting clean-label, plant-based, and allergen-free product development.
- April 2025: Ulrick & Short has introduced Synergie A, a native starch range designed to deliver clean-label thickening and stabilizing, using physical processing to enhance functionality while retaining its native status.
- June 2024: Daymer Ingredients has inked a deal with AKV, a Danish producer specializing in potato ingredients, to market its native and clean-label functional potato starches across the UK. This collaboration underscores Daymer's commitment to providing food manufacturers with a range of natural and sustainable ingredients, spanning fibres, starches, malt extracts, proteins, flours, and gums.
- February 2024: Ingredion has unveiled its first functional native starch, NOVATION® Indulge 2940. This clean-label starch boasts gelling properties and an enhanced mouthfeel. Designed to cater to health-conscious consumers, it's a label-friendly ingredient that offers an indulgent, plant-based texture in food products.


Research Methodology Framework and Report Scope
Market Definitions and Key Coverage
Our study defines the native starch market as the worldwide sales value of unmodified starches extracted from corn, wheat, cassava, potato, rice, and other botanical sources that are sold in food, pharma, or industrial-grade form for immediate use in finished food, beverage, pharmaceutical, paper, adhesive, textile, and bioplastic products. Modified or pre-gelatinized starches are referenced only for context and are not included in the valuation.
Scope Exclusion: Native starch that is consumed internally by vertically integrated wet-millers before any external sale is excluded from the baseline.
Segmentation Overview
-
By Source
- Maize
- Wheat
- Potato
- Tapioca
- Other Sources
-
By Form
- Powder
- Liquid
-
By Application
- Food and Beverage
- Pharmaceutial
- Personal Care and Cosmetics
- Animal Feed
- Paper and Corrugating
- Other Applications
-
By Geography
-
North America
- United States
- Canada
- Mexico
- Rest of North America
-
Europe
- United Kingdom
- Germany
- Spain
- France
- Italy
- Netherlands
- Sweden
- Poland
- Belgium
- Rest of Europe
-
Asia-Pacific
- China
- India
- Japan
- Australia
- South Korea
- Indonesia
- Thailand
- Singapore
- Rest of Asia-Pacific
-
South America
- Brazil
- Argentina
- Chile
- Colombia
- Peru
- Rest of South America
-
Middle East and Africa
- United Arab Emirates
- Saudi Arabia
- South Africa
- Nigeria
- Egypt
- Morocco
- Turkey
- Rest of Middle East and Africa
-
North America
Detailed Research Methodology and Data Validation
Primary Research
According to Mordor analysts, interviews with snack producers, generic-drug formulators, Asian trading houses, and logistics brokers helped us verify import-parity prices, measure clean-label momentum, and refine utilization ratios across regions.
Desk Research
We drew core supply-demand indicators from public datasets such as FAOSTAT crop output, UN Comtrade codes 1108 and 3505, USDA corn and cassava balance sheets, and Eurostat PRODCOM starch production files. Regulatory briefs from EFSA and the FDA, patent analytics via Questel, and annual reports of leading wet-millers enriched price and end-use cues. Company 10-Ks, association releases (for example, Starch Europe), and fact-checked media obtained through Dow Jones Factiva rounded out the secondary picture. This list is illustrative, and many additional sources informed data collection and validation.
Market-Sizing & Forecasting
We start with a top-down reconstruction that links FAO production, net trade, and average selling price to total addressable value and then use sampled supplier roll-ups plus channel checks to corroborate totals. Key variables include feedstock harvest volume, starch-extraction yield, ex-works ASP, food-grade penetration, and bioplastic adoption rates; these feed a multivariate regression that projects demand through 2030. Where bottom-up volumes are opaque, three-year moving averages benchmarked against import data plug gaps.
Data Validation & Update Cycle
Model outputs undergo variance checks against historical price bands, peer figures, and prior editions before a two-stage analyst review. We refresh every twelve months and issue interim updates after material market shocks so clients receive the latest view.
Why Mordor's Native Starch Baseline Commands Reliability
Published estimates often diverge because firms select different functional scopes, price anchors, and refresh cadences.
Key gap drivers include omission of industrial grades, discounting high-growth Asian demand, reliance on headline crop prices without yield adjustments, and slower update cycles; each of which compresses or inflates rival totals relative to our balanced view.
Benchmark comparison
| Market Size | Anonymized source | Primary gap driver |
|---|---|---|
| 24.71 B | Mordor Intelligence | - |
| 7.75 B | Global Consultancy A | Food end-uses only, static ASP |
| 1.50 B | Regional Consultancy B | Limited geography, dated base year |
| 0.15 B | Trade Journal C | Pharma-grade focus, excludes bulk starch |
These comparisons confirm that Mordor's disciplined scope setting, live price tracking, and annual refresh cycle deliver a transparent, repeatable baseline that decision-makers can trust.


Key Questions Answered in the Report
How large is the native starch market in 2026?
The native starch market stands at USD 25.96 billion in 2026 with a projected 5.05% CAGR to 2031.
Which region leads the native starch market?
Asia-Pacific holds the largest share at 31.94% in 2025, driven by high food-processing activity and abundant maize and cassava supplies.
What source dominates native starch production?
Maize accounts for 78.62% of global market owing to well-established wet-milling infrastructure and competitive raw-material pricing.
What technological advances are shaping the market?
Ultrasound-assisted extraction, annealing, and controlled heat-moisture treatments enhance functional performance while maintaining native status, enabling expansion into premium applications.
Page last updated on:


