
Mobile Phone Insurance Market Size and Share
Market Overview
| Study Period | 2020 - 2031 |
|---|---|
| Market Size (2026) | USD 41.62 Billion |
| Market Size (2031) | USD 63.45 Billion |
| Growth Rate (2026 - 2031) | 8.80 % |
| Fastest Growing Market | North America |
| Largest Market | Asia-Pacific |
| Market Concentration | Low |
Major Players *Disclaimer: Major Players sorted in no particular order Image © Mordor Intelligence. Reuse requires attribution under CC BY 4.0. | |
Mobile Phone Insurance Market Analysis by Mordor Intelligence
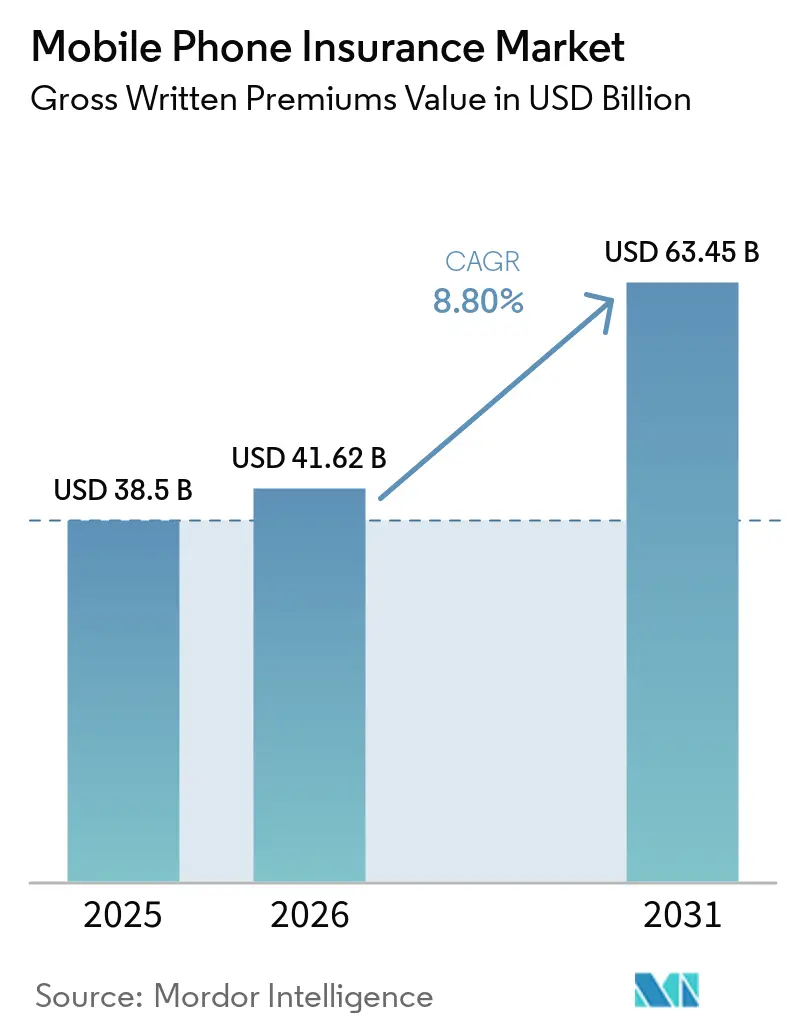
The Mobile Phone Insurance Market size in terms of gross written premiums value is projected to expand from USD 38.5 billion in 2025 and USD 41.62 billion in 2026 to USD 63.45 billion by 2031, registering a CAGR of 8.80% between 2026 and 2031.
Rising repair and replacement costs are making protection more relevant for owners of premium devices, particularly when a screen repair represents a substantial portion of handset value. The mobile phone insurance market is also gaining support from embedded enrollment through carriers and device manufacturers, which places coverage within the activation and purchase process. Broader cover packages, certified refurbished devices, and corporate fleet protection are expanding the addressable base beyond traditional new-device policies. Competition is strongest in North America and Western Europe, while certified refurbished protection, small-business fleets, and multi-device household plans remain less developed areas of the mobile phone insurance market. Fraud, high deductibles, exclusions, and repair reforms in the European Union could limit retention if insurers do not show clear value and provide quick claims resolution.
Key Report Takeaways
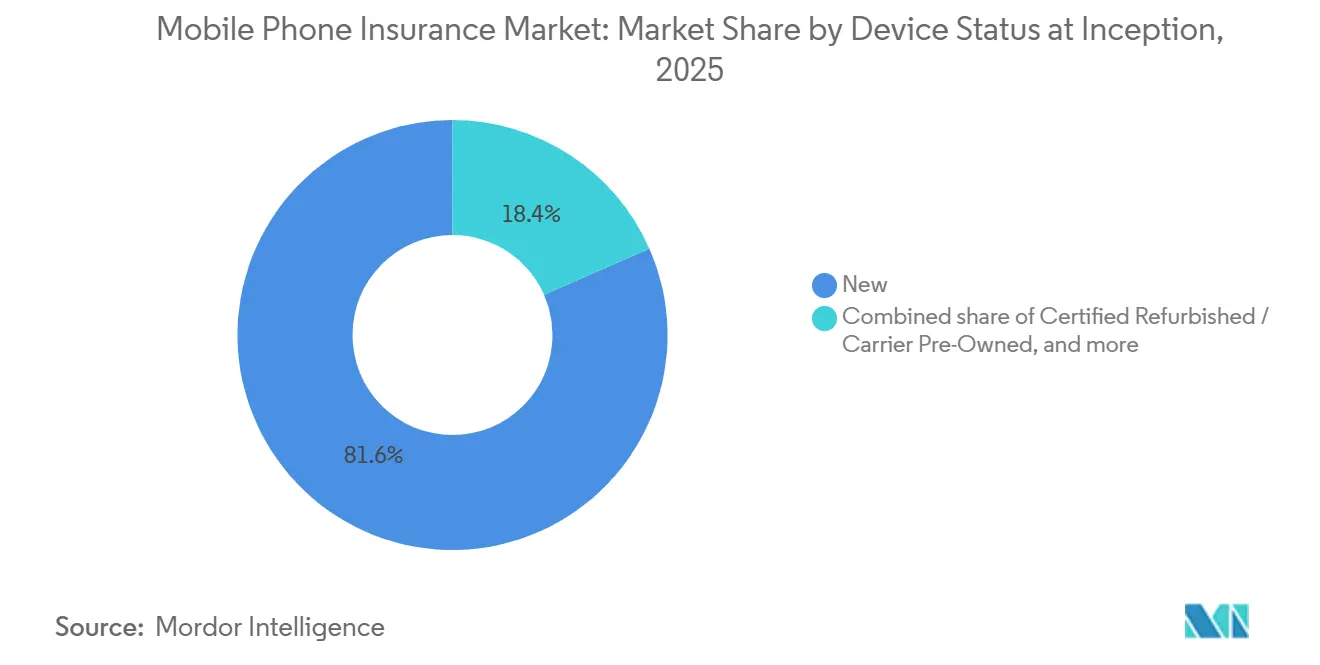
- By device status, new smartphones captured 81.6% of the mobile phone insurance market size in 2025, while certified refurbished and carrier pre-owned devices are projected to grow at 12.1% CAGR through 2031.
- By cover package, comprehensive + breakdown captured 34.6% of the mobile phone insurance market size in 2025, while comprehensive property is projected to grow at 10.2% CAGR through 2031.
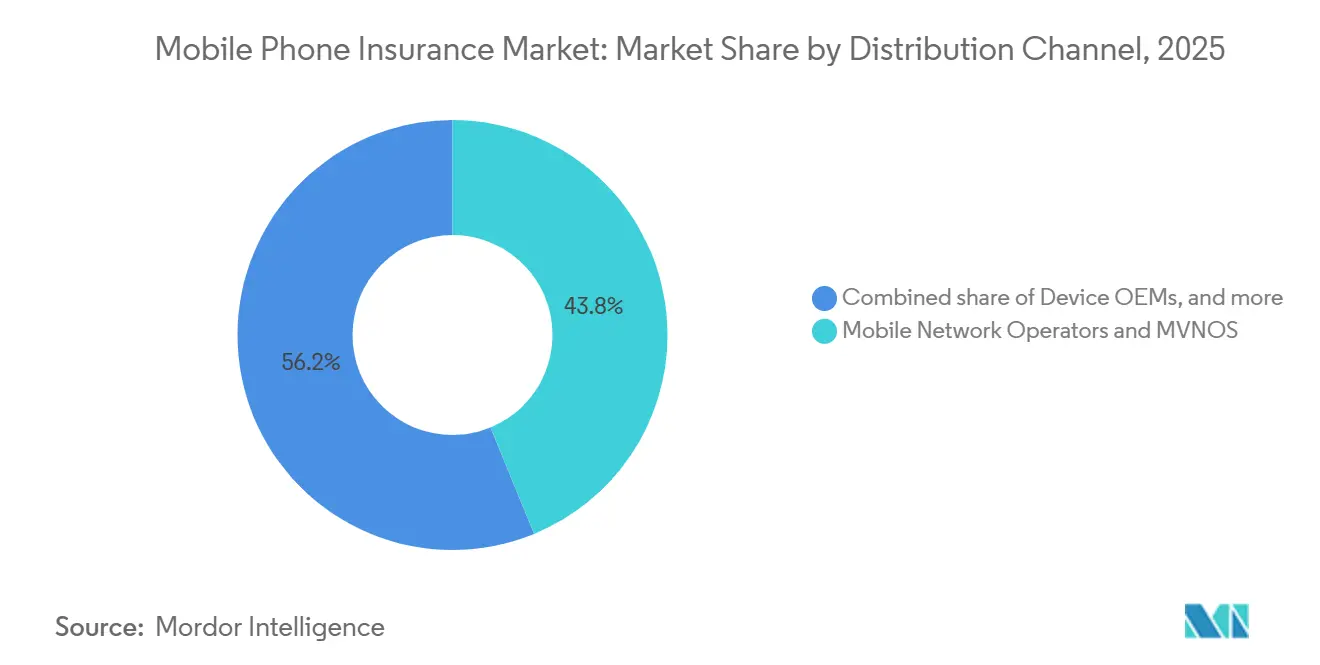
- By distribution channel, mobile network operators and mobile virtual network operators captured 43.8% of the mobile phone insurance market size in 2025, while device original equipment manufacturers are projected to grow at 10.7% CAGR through 2031.
- By end user, personal users captured 85.7% of the mobile phone insurance market size in 2025, while corporate users are projected to grow at 11.4% CAGR through 2031.
- By geography, North America captured 46.8% of the mobile phone insurance market size in 2025, while Asia-Pacific is projected to grow at 11% CAGR through 2031.
Note: Market size and forecast figures in this report are generated using Mordor Intelligence’s proprietary estimation framework, updated with the latest available data and insights as of January 2026.
Global Mobile Phone Insurance Market Trends and Insights
Drivers Impact Analysis*
| Driver | (~) % Impact on CAGR Forecast | Geographic Relevance | Impact Timeline |
|---|---|---|---|
| Rising Smartphone Repair and Replacement Costs | +2.2% | Global, most acute in North America and Western Europe | Short term (≤ 2 years) |
| Accidental Damage, Liquid Damage, Theft, and Loss | +1.9% | Global, elevated in Asia-Pacific and Latin America | Short term (≤ 2 years) |
| Embedded Insurance Through Telecom Operators and Device Manufacturers | +1.5% | Asia-Pacific, with spillover to the Middle East, Africa, and Latin America | Medium term (2-4 years) |
| Smartphone Dependence and Device Downtime Costs | +1% | Global, the highest in North America, the United Kingdom, and East Asia | Medium term (2-4 years) |
| Coverage for New and Refurbished Smartphones | +0.8% | North America, Western Europe, and the Asia-Pacific | Long term (≥ 4 years) |
| Digital Claims Processing and Device Authentication | +0.6% | Global, with early gains in North America and Asia-Pacific | Long term (≥ 4 years) |
| Source: Mordor Intelligence | |||
Rising Smartphone Repair and Replacement Costs Increasing Demand for Financial Protection
Smartphone repair costs are strengthening the case for protection among owners of premium devices. A June 2026 review reported screen replacement prices above EUR 400 (USD 428) across six European Union member states[1]. The same review indicated that this charge could equal 30% of a handset’s retail price before labor costs. A repair bill at that level can make self-funding less attractive when damage occurs. Insurers with certified inventory can provide replacement devices more quickly than a repair process in some cases. That service outcome can support retention in the mobile phone insurance market when policyholders value device continuity as well as reimbursement.
Growing Incidence of Accidental Damage, Liquid Damage, Theft, and Loss
Accidental damage, liquid exposure, theft, and loss remain key reasons consumers consider device protection. Higher handset values increase the financial impact of an incident, especially for users who replace devices without coverage. Liquid damage presents a particular challenge in humid Southeast Asian markets, where policy pricing may not reflect the related claims volume. Theft and loss claims can also increase insurer losses when device ownership and loss circumstances cannot be verified promptly. These risks make claim validation important alongside coverage that addresses routine physical damage. The mobile phone insurance market requires sound underwriting that addresses both common incidents and deliberate misrepresentation.
Expansion of Embedded Insurance Through Telecom Operators and Device OEMs
Embedded insurance is moving protection from a voluntary add-on toward a feature offered during a device or service purchase. In September 2025, Igloo and Telkomsel added gadget insurance and screen protection to the MyTelkomsel app for more than 150 million subscribers in Indonesia[2]. Gadget coverage in that program starts at IDR 1,000 (USD 0.06). SPB Group states that its embedded programs with European telecom operators protect more than 50 million customers. In May 2026, KDDI, Okinawa Cellular, and au Small-Amount Short-Term Insurance launched povo smartphone insurance in Japan from JPY 190 (USD 1.30) per month. This model makes the mobile phone insurance market more accessible for new and used devices because it is not limited to a single carrier or handset maker.
Increasing Smartphone Dependence Raising the Cost of Device Downtime
Device downtime can create operational disruptions for consumers and corporate users. A lost or damaged employee handset can require hardware replacement, create potential data security obligations, and reduce employee productivity. AT&T offers business plans for up to 18 eligible devices per account, with monthly premiums reaching USD 175[3]. Verizon also offers device protection for business mobile plans. Corporate protection products are becoming more relevant as hybrid work connects employee devices to business systems and customer information. Providers that integrate protection with mobile device management can offer replacements before device failures result in prolonged disruptions.
Restraints Impact Analysis*
| Restraint | (~) % Impact on CAGR Forecast | Geographic Relevance | Impact Timeline |
|---|---|---|---|
| High Premiums, Deductibles, and Coverage Exclusions | -0.9% | Global, most acute in price-sensitive Asia-Pacific and Latin American markets | Short term (≤ 2 years) |
| Fraudulent Claims and Device Misrepresentation | -0.7% | Global, concentrated in the United Kingdom, the United States, and South Korea | Medium term (2-4 years) |
| Low-Cost Repair and Self-Payment Alternatives | -0.5% | Global, elevated in right-to-repair legislative markets | Short term (≤ 2 years) |
| Regulatory and Product-Structure Differences | -0.3% | Asia-Pacific, the Middle East, Africa, Latin America, and Europe | Medium term (2-4 years) |
| Source: Mordor Intelligence | |||
High Premiums, Deductibles, and Coverage Exclusions Reducing Consumer Value Perception
Premiums, deductibles, and exclusions can weaken the perceived value of a policy. A 2025 study by the French Environment Agency found that consumers chose repair when the total cost stayed within 20% to 30% of the original product price. Once the cost exceeded that range, consumers were more likely to replace the product instead. A 2026 review of smartphone insurance products in Germany found annual premiums reaching 10% of device value. Policyholders may question whether coverage is preferable to savings when the premium and deductible approach the cost of repair. The mobile phone insurance market needs transparent terms and clearly defined service benefits to limit cancellations after an adverse claims experience.
Fraudulent Claims and Device Misrepresentation Increasing Insurer Losses
Fraudulent claims can raise loss ratios and increase premium pressure for honest policyholders. Cifas found that 19% of respondents believed it was legal to claim for pre-existing damage under a new policy. This misunderstanding can lead to frequent claims that are difficult to identify through document reviews alone. GSMA Open Gateway interfaces can help insurers validate SIM swaps, device swaps, and device identifiers when customers report losses. Better verification is important because fraud controls must prevent losses without delaying legitimate customer claims. This balance affects retention and pricing across the mobile phone insurance market.
*Our forecasts treat driver/restraint impacts as directional, not additive. The impact forecasts reflect baseline growth, mix effects, and variable interactions.
Segment Analysis
By Device Status at Inception: Refurbished Coverage Is Becoming a New Growth Layer
New smartphones accounted for 81.6% of policies in 2025, reflecting the strength of point-of-sale enrollment and handset activation workflows. This group remains the primary base for the mobile phone insurance market because new-device buyers commonly receive protection offers during purchase. Mobile network operator prompts, manufacturer activation steps, and retail checkout systems support this enrollment path. These channels reduce the effort required to add coverage while consumers are already completing a device transaction. This established model gives new smartphones a substantial lead over other device-status categories.
Certified refurbished and carrier pre-owned devices are projected to grow at a CAGR of 12.1% through 2031, the strongest rate within this segmentation. Assurant invested in Plug, a certified pre-owned platform that distributes devices to more than 150 countries, in July 2025. Nearly four in 10 smartphone owners in the United States purchased a previously owned device during the prior period. Trust, rather than price, remains a major barrier to wider adoption. The mobile phone insurance industry can use certification, standardized grading, and warranty coverage to reduce uncertainty for insurers and device buyers.
By Cover Package: Broad Coverage Is Gaining Ground as Exclusion Risk Becomes More Visible
Comprehensive + Breakdown held 34.6% of policies in 2025, leading the cover-package segment. This package combines accidental damage, theft and loss, and mechanical or electrical malfunction. Its scope addresses several events that can create high costs for an uninsured owner. Consumers who have faced repair costs of EUR 200 to EUR 400 (USD 214 to USD 428) in Europe may place greater value on plans with fewer exclusions. Its position shows that consumers consider total loss and malfunction alongside screen damage.
Comprehensive Property is projected to grow at 10.2% CAGR through 2031, making it the fastest-growing package. This coverage responds to demand for full asset protection rather than plans limited by damage type or per-incident caps. Accidental Damage Only policies are losing relative importance as consumers recognize that theft and total loss may fall outside a narrow plan. AppleCare+ combines accidental damage with theft and loss coverage in markets where Apple complies with the United Kingdom Financial Conduct Authority or state insurance requirements. The mobile phone insurance market size for Comprehensive Property is expanding as consumers seek protection that covers a wider range of ownership risks.
By Distribution Channel: Device Manufacturers Are Challenging Carrier Distribution Dominance
Mobile network operators and mobile virtual network operators held 43.8% share in 2025, maintaining the largest distribution position. Their advantage comes from established subscriber billing, upgrade programs, and handset activation journeys. Those processes allow providers to present protection without requiring a separate payment or registration step. This scale gives operators an important role in the mobile phone insurance market, even as other channels develop. It also explains why direct insurers, managing general agents, bancassurance providers, and physical retailers face higher enrollment friction.
Device original equipment manufacturers are projected to grow at 10.7% CAGR through 2031, the fastest pace among distribution channels. Apple and Samsung control the protection product and the repair or replacement network within their own ecosystems. In April 2026, Bolt partnered with Associated Carrier Group to provide all-digital protection to more than 2 million wireless subscribers through Tier 2 and Tier 3 United States operators. In May 2026, Associated Carrier Group selected Likewize as its device protection partner, including Apple-authorized service for regional carriers. These partnerships allow regional providers to improve digital enrollment and service quality without building their own insurance infrastructure.
By End User: Corporate Demand Is Formalizing as Hybrid Work Raises Device Risk
Personal end users accounted for 85.7% of revenue in 2025, reflecting the consumer origins of the category. Individual subscription plans sold through carrier channels provide the volume base for the mobile phone insurance market. Consumers usually insure a single device and make decisions at the point of handset purchase or upgrade. This produces a large and recurring pool of policies across carrier and manufacturer channels. These factors continue to make personal users the dominant revenue group.
Corporate users are projected to grow at 11.4% CAGR through 2031, compared with the overall 8.8% market CAGR. Higher device values, hybrid work, and obligations related to employee data support demand for formal fleet protection. An uninsured loss can involve hardware replacement, employee downtime, and potential exposure of business information. AT&T’s Protect Advantage for Business covers up to 18 eligible devices per account at a monthly premium of USD 175. Managed mobility providers can combine device inventories, carrier contracts, expense management, and protection within annual agreements.
Geography Analysis
North America held a 46.8% share in 2025, representing the largest regional position in the mobile phone insurance market. High smartphone selling prices and mature carrier-embedded distribution support mobile phone insurance market adoption in the region. The United States is the largest country market, with Assurant, Asurion, and Allstate Protection Plans serving subscribers through AT&T, Verizon, and T-Mobile billing integrations. Canada is expanding through lifecycle services that combine device access, financing, protection, and trade-in options. In July 2026, Assurant and Cogeco Communications launched a digital-first mobile device solution for Canadian customers.
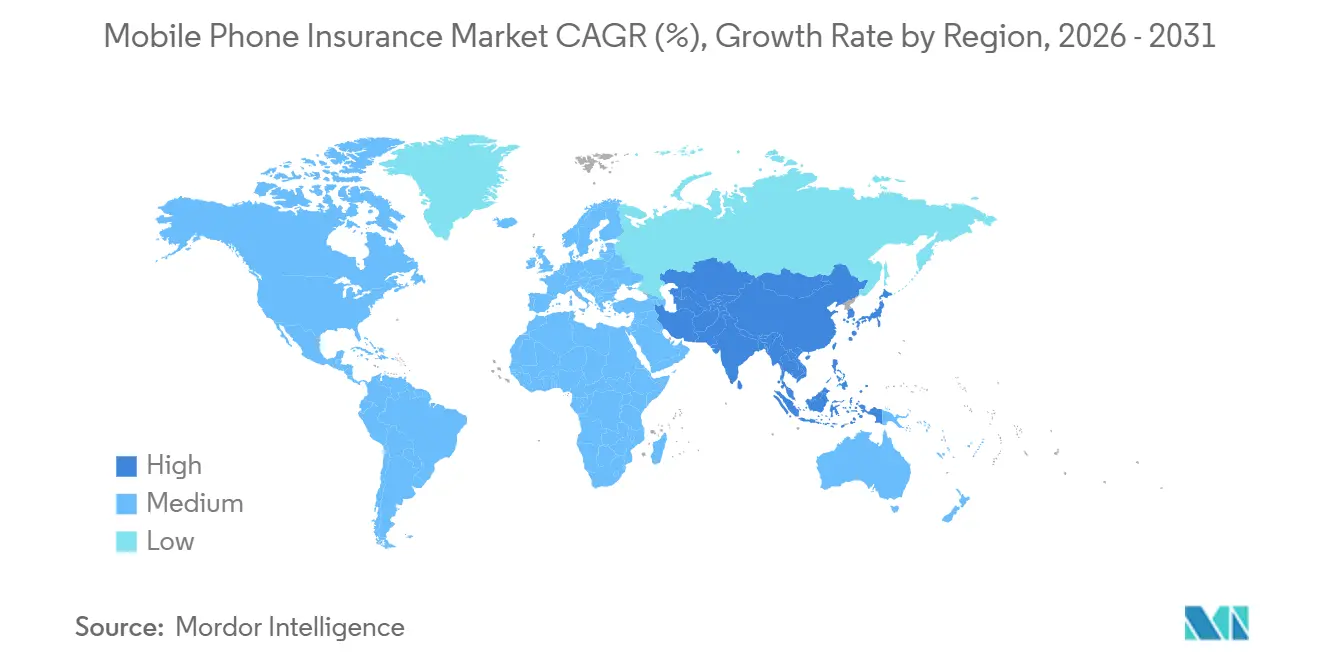
Asia-Pacific is forecast to grow at an 11% CAGR through 2031, the fastest regional rate. China supports regional premium volume through a smartphone base exceeding 900 million users and digital distribution on platforms such as Alipay and WeChat Pay. India is advancing through the Insurance Regulatory and Development Authority of India’s digital-first policy issuance guidelines, which support lower distribution costs and paperless enrollment. Indonesia demonstrated embedded insurance momentum when Igloo and Telkomsel added protection to the MyTelkomsel app for more than 150 million subscribers in September 2025. South Korea, Japan, and Australia represent more mature Asia-Pacific markets with higher average premiums and more moderate growth across the mobile phone insurance market.
Europe has a mid-tier revenue position, with the United Kingdom and Germany serving as regional anchors. Germany leads the European position, while German insurance premiums increased by 6.6% in 2025. The European Union Right to Repair Directive may lower demand for minor-damage coverage by expanding access to parts and repair documentation. The directive may also support the certified refurbished ecosystem, which could widen the base of devices eligible for formal protection. In May 2026, EFGH’s ConnectSure platform added device protection and credit life insurance to smartphone buy-now-pay-later journeys in Nigeria.
Competitive Landscape
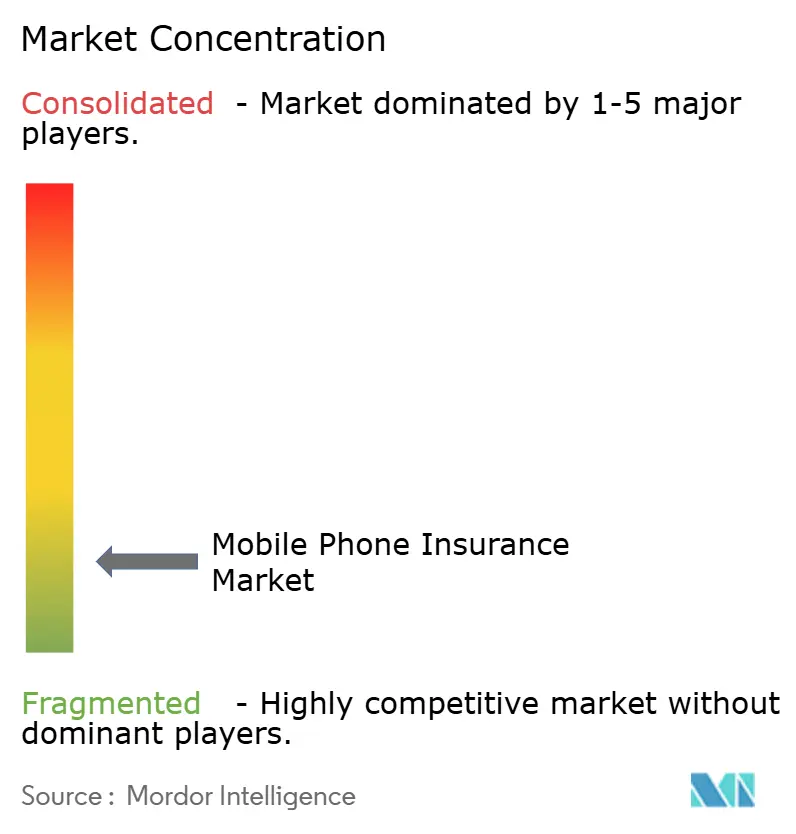
The mobile phone insurance market is fragmented. No single company holds a dominant position across every geography. In North America, carrier distribution has near-duopoly characteristics around Assurant and Asurion. Competition is increasing among regional operators as technology platforms lower the infrastructure requirements for digital device protection. The mobile phone insurance market, therefore, combines established carrier relationships with opportunities for providers that can support smaller operators. Certified refurbished coverage, small and medium-sized enterprise fleets, and multi-device household plans remain areas where no provider holds a leading global position.
Europe includes embedded insurance specialists such as Bolttech, SPB Group, and Allianz Partners, which work across several telecom relationships. In September 2025, AXA Partners and bolttech entered a long-term partnership to offer embedded insurance across the European Union, the United Kingdom, and Switzerland. The partnership combines AXA Partners’ EUR 3 billion (USD 3.21 billion) B2B2C portfolio with bolttech’s technology-enabled protection platform. In June 2026, Bolttech and ING Bank announced an embedded insurance partnership operating in the Netherlands, Italy, Poland, and Belgium. These moves show how insurers and distribution platforms are combining their capabilities instead of creating each part of the service internally.
Technology is a key source of differentiation because it affects enrollment, claims processing, repair, and fraud control. Apple and Samsung have a structural advantage through control of both the protection product and repair or replacement services in their original equipment manufacturer programs. Servify provides device management technology linked to manufacturer service networks for after-sales fulfillment and claims delivery. GSMA Open Gateway interfaces support claim checks through SIM swap, device swap, and device identifier signals. Regulations such as the United Kingdom Financial Conduct Authority Consumer Duty, India’s digital issuance standards, and data requirements for digital claims raise the operating requirements for new entrants. In the mobile phone insurance market, firms with claims technology, certified repair networks, and reliable device inventory are better positioned to provide quick service.
Mobile Phone Insurance Industry Leaders
-
Asurion, LLC
-
Apple Inc.
-
Allianz SE
-
Allstate Protection Plans
-
AmTrust Financial Services, Inc.
- *Disclaimer: Major Players sorted in no particular order
Recent Industry Developments
- July 2026: Assurant and Cogeco Communications launched a digital-first mobile device solution for Canadian customers, integrating device access, flexible financing, protection, and trade-in capabilities into a single lifecycle journey, extending Assurant's reach beyond its United States carrier base.
- June 2026: Bolttech and ING Bank announced a strategic embedded insurance partnership live across the Netherlands, Italy, Poland, and Belgium, with additional European markets in the pipeline, leveraging ING's banking network to scale device protection through bancassurance.
- May 2026: Associated Carrier Group (ACG) selected Likewize as its device protection partner to support regional operators and MVNOs with customizable protection programs, digital device care, analytics, repair, and replacement services. The partnership is designed to enhance customer loyalty, optimize device protection offerings, and adapt to evolving customer and device needs.
- May 2026: KDDI, Okinawa Cellular, and au Small-Amount Short-Term Insurance launched povo Smartphone Insurance in Japan, offering carrier- and device-agnostic coverage from JPY 190 (USD 1.30) per month for new and used smartphones.
Global Mobile Phone Insurance Market Report Scope
| New |
| Certified Refurbished / Carrier Pre-Owned |
| Other Used |
| Accidental Damage Only |
| Damage + Theft (No Accidental Loss) |
| Comprehensive Property |
| Comprehensive + Breakdown |
| Mobile Network Operators and MVNOS |
| Device OEMs |
| Physical Retail (Non-MNO, Non-OEM) |
| Direct Insurer / MGA / Comparison |
| Bancassurance, Packaged Account, Affinity |
| Other Distribution Channels |
| Personal |
| Corporate |
| North America | United States |
| Canada | |
| Mexico | |
| South America | Brazil |
| Argentina | |
| Rest of South America | |
| Europe | United Kingdom |
| Germany | |
| France | |
| Italy | |
| Spain | |
| Rest of Europe | |
| Asia-Pacific | China |
| Japan | |
| India | |
| South Korea | |
| Australia | |
| Indonesia | |
| Thailand | |
| Malaysia | |
| Singapore | |
| Vietnam | |
| Rest of Asia-Pacific | |
| Middle East and Africa | Saudi Arabia |
| United Arab Emirates | |
| Turkey | |
| South Africa | |
| Egypt | |
| Rest of Middle East and Africa |
| By Device Status at Inception | New | |
| Certified Refurbished / Carrier Pre-Owned | ||
| Other Used | ||
| By cover package | Accidental Damage Only | |
| Damage + Theft (No Accidental Loss) | ||
| Comprehensive Property | ||
| Comprehensive + Breakdown | ||
| By Distribution Channel | Mobile Network Operators and MVNOS | |
| Device OEMs | ||
| Physical Retail (Non-MNO, Non-OEM) | ||
| Direct Insurer / MGA / Comparison | ||
| Bancassurance, Packaged Account, Affinity | ||
| Other Distribution Channels | ||
| By End User | Personal | |
| Corporate | ||
| By Geography | North America | United States |
| Canada | ||
| Mexico | ||
| South America | Brazil | |
| Argentina | ||
| Rest of South America | ||
| Europe | United Kingdom | |
| Germany | ||
| France | ||
| Italy | ||
| Spain | ||
| Rest of Europe | ||
| Asia-Pacific | China | |
| Japan | ||
| India | ||
| South Korea | ||
| Australia | ||
| Indonesia | ||
| Thailand | ||
| Malaysia | ||
| Singapore | ||
| Vietnam | ||
| Rest of Asia-Pacific | ||
| Middle East and Africa | Saudi Arabia | |
| United Arab Emirates | ||
| Turkey | ||
| South Africa | ||
| Egypt | ||
| Rest of Middle East and Africa | ||
Key Questions Answered in the Report
What is driving demand for mobile phone insurance?
Higher repair costs, accidental damage, theft, loss, and embedded enrollment through carriers and device manufacturers are supporting demand.
How large is the mobile phone insurance market?
The mobile phone insurance market was valued at USD 38.5 billion in 2025 and is forecast to reach USD 63.5 billion by 2031 at an 8.8% CAGR.
Which device category is growing fastest?
Certified refurbished and carrier pre-owned devices are forecast to grow at 12.1% CAGR through 2031.
Which distribution channel is expanding fastest?
Device original equipment manufacturers are forecast to grow at 10.7% CAGR through 2031 as they combine protection with repair and replacement services.
Which region is growing fastest?
Asia-Pacific is projected to grow at 11% CAGR through 2031, supported by digital distribution and embedded protection offers.
What is the main challenge for insurers?
Fraud, high premiums, deductibles, and exclusions can weaken consumer value perception and increase claims costs.