Market Overview
| Study Period | 2019 - 2030 |
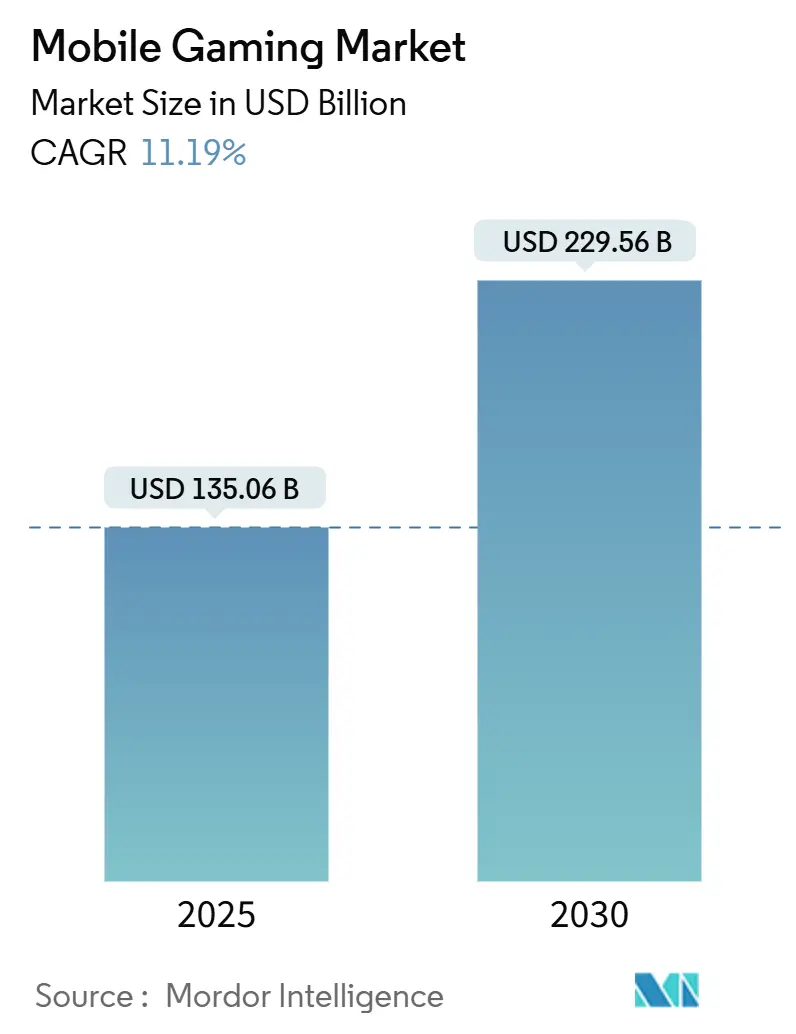
| Market Size (2025) | USD 135.06 Billion |
| Market Size (2030) | USD 229.56 Billion |
| Growth Rate (2025 - 2030) | 11.19% CAGR |
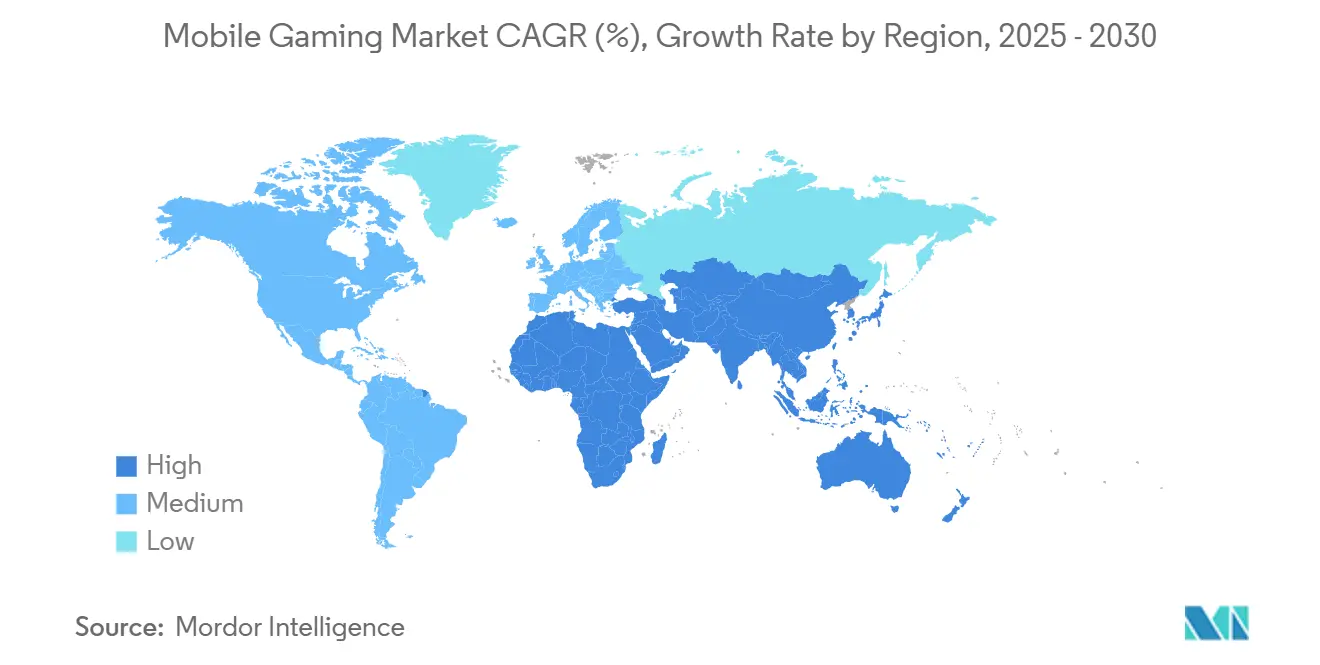
| Fastest Growing Market | Asia Pacific |
| Largest Market | Asia Pacific |
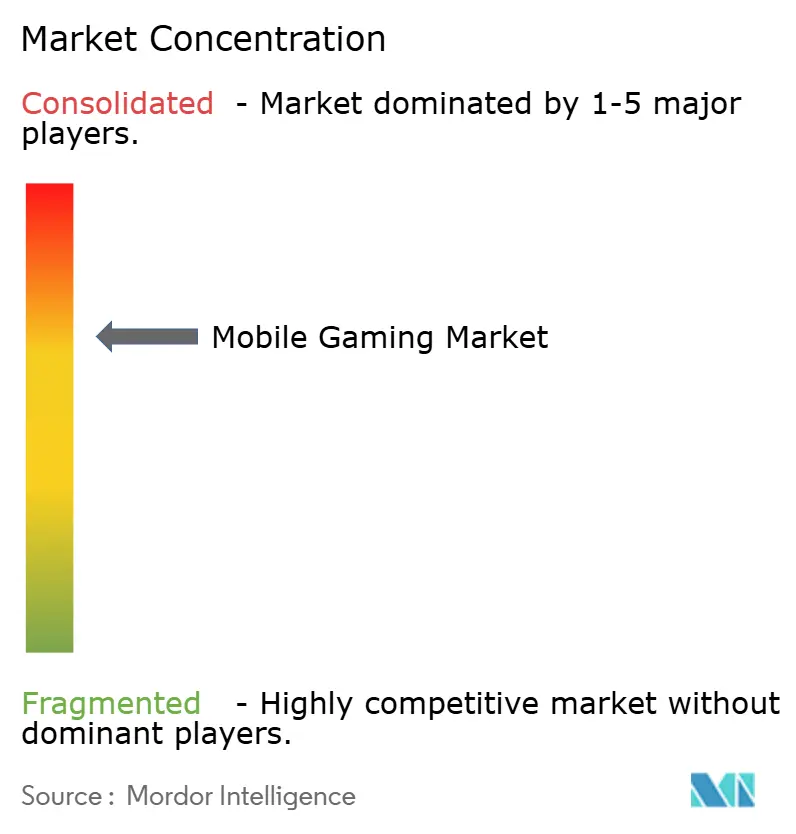
| Market Concentration | Medium |
Major Players*Disclaimer: Major Players sorted in no particular order Image © Mordor Intelligence. Reuse requires attribution under CC BY 4.0. |
|
Mobile Gaming Market Analysis by Mordor Intelligence
The mobile gaming market size is estimated at USD 135.06 billion in 2025 and is forecast to reach USD 229.56 billion by 2030, expanding at an 11.19% CAGR. Growth rests on deep smartphone penetration, improving network speeds, and diversified monetization mixes. Asia-Pacific leads with 54% revenue share and the region is expanding at 12% CAGR, indicating that scale and momentum now converge there. In-app purchases dominate 61% of global revenue, yet advertising income is gaining fastest with a 15% CAGR as privacy rules reshape targeting. Competitive pressure is edging up because established publishers widen their footprints while new studios adopt AI-assisted development to shorten release cycles. Telecom-driven cloud-gaming bundles, especially in Europe, demonstrate fresh partnership routes that raise ARPDAU and lengthen play sessions.
Key Report Takeaways
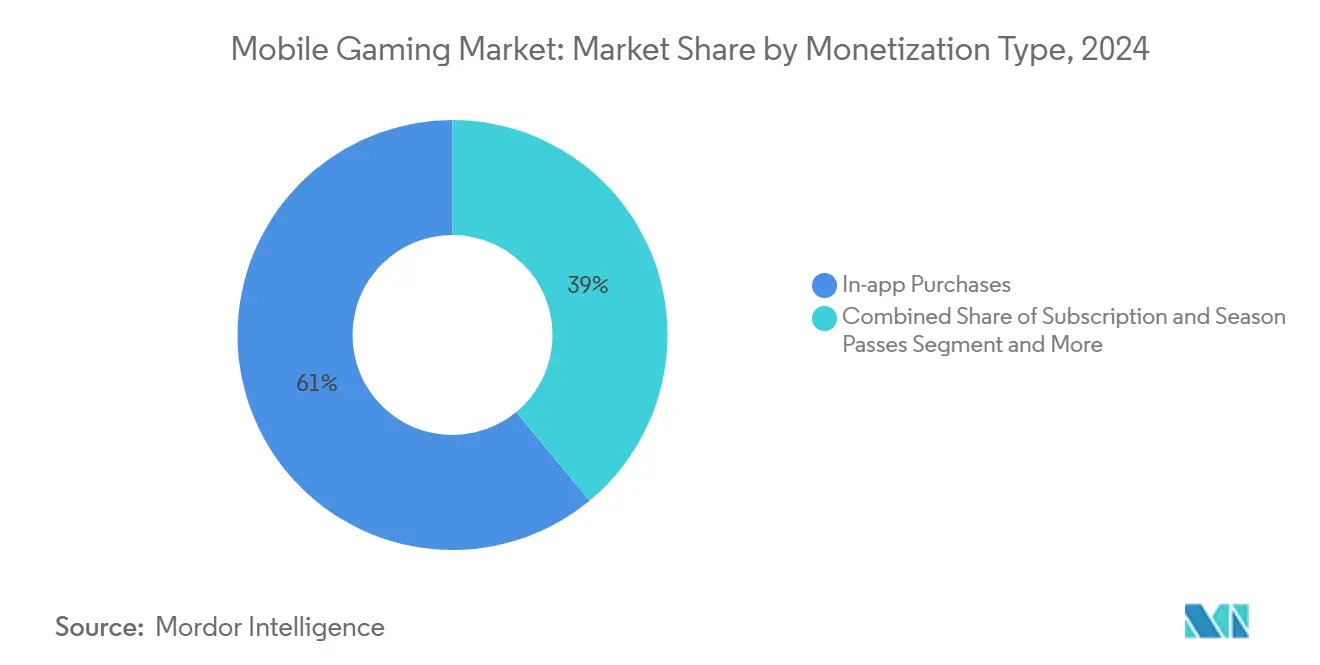
- By monetization type, in-app purchases held 61% of the mobile gaming market share in 2024, while advertising is forecast to post the quickest 15% CAGR to 2030.
- By platform, Android accounted for 65% of revenue in 2024, whereas iOS is projected to register the highest 11% CAGR through 2030.
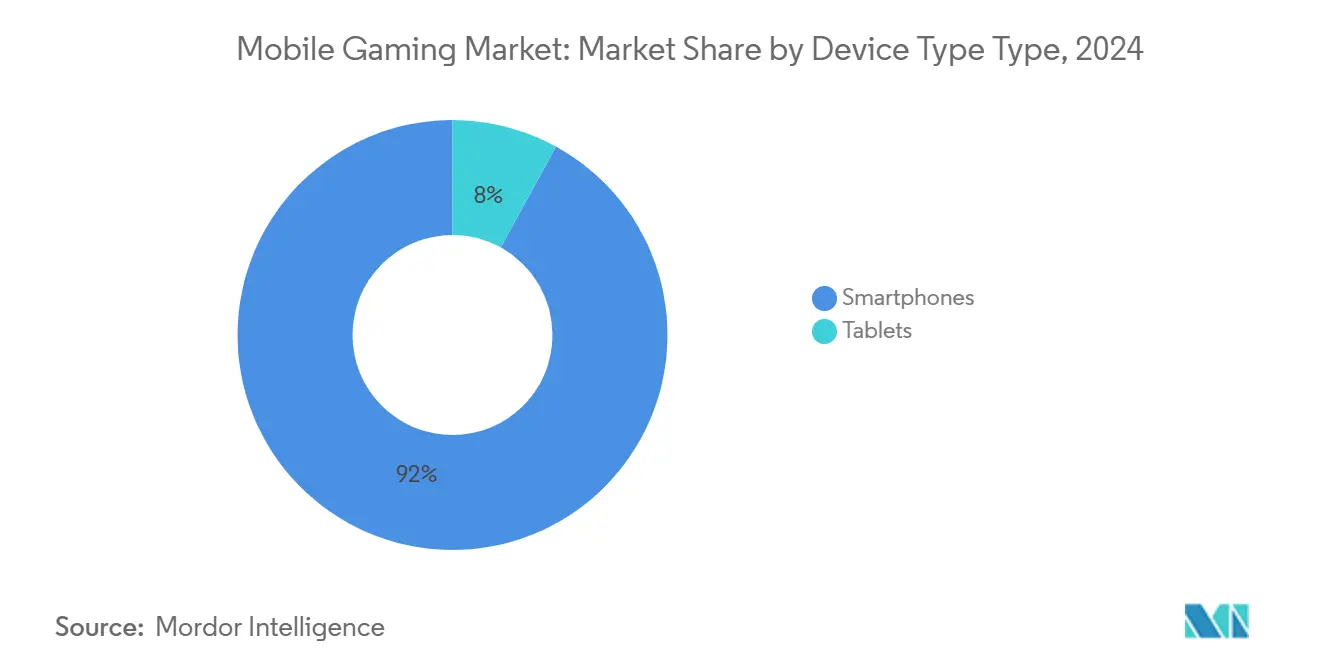
- By device type, smartphones commanded 92% share of the mobile gaming market size in 2024, and tablets are anticipated to advance at the fastest pace through 2030.
- By game genre, casual and hyper-casual titles took a 34% revenue share in 2024; role-playing games are on track for a robust 14% CAGR to 2030.
- By geography, Asia-Pacific led with 54% revenue share in 2024 and is also the quickest-growing region at 12% CAGR to 2030.
Global Mobile Gaming Market Trends and Insights
Drivers Impact Analysis
| Driver | (~) % Impact on CAGR Forecast | Geographic Relevance | Impact Timeline |
|---|---|---|---|
| 5G roll-outs lowering latency | +2% | Global, led by Asia and Europe | Long term (≥ 4 years) |
| Contextual-first advertising post-IDFA | +1% | North America | Medium term (2-4 years) |
| Telco-led cloud gaming bundles | +0.8% | Europe | Medium term (2-4 years) |
| Gen Z preference for hyper-casual gameplay | +1.5% | Global | Long term (≥ 4 years) |
Source: Mordor Intelligence
5G Roll-outs Lowering Latency
End-to-end lag on 5G networks often falls below 10 milliseconds, a 75% improvement over 4G, enabling real-time multiplayer and cloud streaming previously impractical on mobile devices [1]Qualcomm Technologies, “5G Mobile Gaming Study,” qualcomm.com . Multi-Access Edge Computing places processing closer to players, and T-Mobile’s 5G gaming traffic rose 43% in 2024 as latency-sensitive titles gained traction[2]T-Mobile USA, “5G Network Performance Report 2024,” t-mobile.com . Lower wait times encourage competitive esports on phones and extend average cloud-gaming sessions by 34% relative to 4G T-Mobile. Publishers now optimise frame pacing for 120 Hz screens, and telecom firms leverage performance metrics in premium subscription bundles. As 5G coverage spreads, real-time cooperative play is expected to reinforce stickiness and raise time-in-app, supporting long-run revenue gains for the mobile gaming market.
Contextual-First Advertising Revenues Surging Post-IDFA
Apple’s ATT framework eroded user-level targeting, prompting developers to place ads against gameplay moments rather than identity signals. Engagement rates for contextual placements are 23% higher than traditional behavioural ads, lifting ad spend to USD 12.2 billion in North America during 2024 AdInMo. Reward-based formats in casual titles are especially effective, boosting ARPDAU by 0.8 cents between Q4 2023 and Q1 2024 GameBizConsulting. Advertisers appreciate brand-safe environments and measurable lift from moment-based creatives, while players benefit from non-intrusive rewards. Over the next three years, contextual uplift is projected to counterbalance iOS CPI inflation for publishers that have strong analytics stacks. Rising ad CPMs tied to higher engagement will support blended monetization strategies across the mobile gaming market.
Telco-Led Cloud Gaming Bundles in Europe Stimulating ARPDAU
European telecom operators routinely include premium cloud gaming libraries with 5G data plans. Deutsche Telekom’s 5G+ Gaming package offers 100 titles via the Sora Stream platform, increasing customer retention 14% and extending sessions by an average of 22 minutes [3]Deutsche Telekom, “5G+ Gaming Launch Announcement,” telekom.com . Network slicing allocates dedicated bandwidth to gaming traffic, trimming latency by 35% and enhancing visual fidelity. Analysts forecast telco-bundled services to generate EUR 2.3 billion revenue by 2026, with participating users’ ARPDAU higher by EUR 0.17 than non-bundle users [4]GSMA Intelligence, “Mobile Economy Asia Pacific 2024,” gsma.com . For publishers, bundling converts distribution costs into guaranteed inflows and unlocks new user segments. The trend points to recurring subscription revenue that will lift the broader mobile gaming market over the medium term.
Gen-Z Preference for Hyper-Casual Gameplay
Players aged 13-28 clock 7.2 hours a week on mobile games, 1.8 hours ahead of millennials, and 73% prefer sessions shorter than 10 minutes CTA. Hyper-casual installs accounted for 30% of all downloads in Q1 2023 although the mix is shifting toward “hybrid-casual,” which adds progression depth. Smartphones remain the primary device for 96% of Gen Z, yet 58% also own dedicated consoles, reinforcing cross-platform tastes CTA. Publishers experiment with seasonal content drops, influencer-driven Level Design contests and deeper cosmetic progression to extend lifetime value. Gen Z’s appetite for social sharing further amplifies organic reach, offering cost-efficient acquisition. As this cohort moves into peak earning years, its preferences should provide a long-term uplift to the mobile gaming market.
Restraints Impact Analysis
| Restraint | (~) % Impact on CAGR Forecast | Geographic Relevance | Impact Timeline |
|---|---|---|---|
| Loot-box regulations in Europe | -1% | Europe | Medium term (2-4 years) |
| Rising iOS user-acquisition CPI | -1.2% | North America, Global iOS | Short term (≤ 2 years) |
Source: Mordor Intelligence
Country-Level Loot-Box Regulations in Europe Dampening IAP
Belgium’s ban has forced publishers either to strip loot boxes or withdraw titles, and Netherlands permits the mechanic only under strict guidelines Xiao. EU principles published in March 2025 mandate transparent dual-currency pricing, reducing conversion where perceived costs rise Breen. In 2024, loot-box revenue fell 9% year-on-year across EU markets BEUC. Compliance adds localisation overhead and prolongs update cycles, discouraging new gachabased titles. Studios therefore pivot toward battle passes, direct item sales and cosmetic bundles to protect cash flows. The shift may temper short-term growth in the mobile gaming market while nudging design toward fairer monetization systems.
Rising User-Acquisition CPI on iOS in North America
Average CPI for a casual-game install reached USD 4.83 on iOS in 2024 versus USD 0.65 on Android, creating a 7.4× cost gap Byshonkov. Apple’s ATT cut targeting precision, pushing bidders to compete on broad signals and driving CPIs higher. North America now holds the world’s highest blended CPI at USD 3.59 yet offers a strong Day-7 ROAS of 8.1% Byshonkov. Publishers extend payback windows and lean on cross-promotion across large portfolios. Smaller studios rely on publishing partners or influencer campaigns to remain visible. Elevated marketing costs act as a near-term drag on the mobile gaming market but may encourage consolidation and innovation in acquisition tactics.
Segment Analysis
By Monetization Type: Diversified Revenue Mix Balances Growth and Risk
In-app purchases generated 61% of revenue in 2024, illustrating their continued dominance in the mobile gaming market size. Advertising, though, is expanding faster at 15% CAGR as reward-based and contextual formats improve engagement. Developers increasingly blend ads with purchases, capturing incremental value during non-spend sessions. Rewarded video now contributes 56% of casual-game revenue, showing that ads no longer imply lower player quality Unity. Subscriptions remain niche, but mature markets show promise despite Germany’s gaming subscription revenue softening 1% to EUR 860 million in 2023, Byshonkov.
The diversified mix shields studios from regulatory pressure specific to any single channel. While loot-box scrutiny slows gachabased spend, battle passes and direct cosmetics stabilise yields. Advertising serves as an entry point for non-payers, while item shops and season passes convert engaged users. This layered approach positions the mobile gaming market to absorb economic cycles and platform policy shifts.
Note: Segment shares of all individual segments available upon report purchase
By Platform: Android Scale Meets iOS Spending Power
Android controlled 65% revenue in 2024, giving it the largest mobile gaming market share across devices. Its reach is strongest in India, Brazil, and Indonesia, fueling download volumes. iOS, however, is slated for an 11% CAGR through 2030, outpacing Android because of higher per-capita spend and a premium device base. Japan’s iOS users spend USD 10.76 monthly, whereas South Korea tops Android spending at USD 11.38 Byshonkov. The EU Digital Markets Act now enables alternative iOS stores, evidenced by Fortnite’s 2024 EU comeback Hern.
Developers tailor launch strategies: Android soft-launches for mass UA testing, then iOS rollouts for monetization. Platform dynamics will continue shifting as sideloading becomes viable in the EU and possibly elsewhere. These reforms could compress platform fees and open new payment experiments, energizing competition within the mobile gaming market.
By Device Type: Smartphones Ubiquitous, Tablets Premium
Smartphones represented 92% of 2024 revenue thanks to their omnipresence and constant connectivity. Tablets, only 8% yet expanding, attract mid-core and hardcore audiences seeking larger screens and longer sessions. The GSMA cites 1.8 billion mobile subscribers in Asia-Pacific by end-2023, underpinning the smartphone scale GSMA. Tablets deliver higher ARPDAU and support controller accessories, making them ideal for RPGs and simulation titles.
Usage patterns diverge. Smartphones dominate short bursts during commuting or breaks, prompting design for rapid engagement. Tablet play peaks evenings and weekends, favouring events and longer quest chains. Developers who optimise UI and control schemes by device will better capture both cohorts, further expanding the mobile gaming market size.
Note: Segment shares of all individual segments available upon report purchase
By Game Genre: Casual Rules Reach, RPGs Propel Spend
Casual and hyper-casual games claimed 34% revenue in 2024, reflecting their low learning curves and viral appeal. Role-playing titles, however, are forecast to grow at 14% CAGR, driving premium spend and retention. Seven games cleared USD 1 billion in consumer spend during 2023, highlighting revenue concentration at the top SensorTower. Idle RPG “Legend of Mushroom” amassed USD 270 million soon after launch, with South Korea contributing 39.4% and Japan 30% Ma.
Hybrid-casual is an emerging middle ground blending simple mechanics with light progression, combating genre fatigue. Sports and simulation games also show regional uplift, such as a 39% revenue jump for sports titles in Southeast Asia during 2024 Ma. Genre diversification protects against saturation and extends the mobile gaming market opportunity.
Geography Analysis
Asia-Pacific’s 54% revenue share places it at the epicentre of the mobile gaming market while the region grows 12% CAGR through 2030. China remains the single largest market though regulatory reviews introduce periodic pauses in licence approvals. Japan and South Korea sustain the world’s highest per-capita mobile spend, at USD 10.76 on iOS and USD 11.38 on Google Play respectively Byshonkov. India drives volume growth, topping Google Play downloads but still lags monetization, offering upside as purchasing power rises. Mobile technologies contributed USD 880 billion to APAC GDP in 2023, 5.3% of total GSMA, reinforcing mobile’s economic weight.
North America ranks second by revenue. The United States produced USD 9.2 billion on Android and USD 14.8 billion on iOS in 2023 Byshonkov. The region excels at contextual advertising, mitigating IDFA-related headwinds. Nevertheless, iOS CPI inflation challenges smaller studios, reinforcing a consolidated landscape. Robust ROAS softens acquisition pain, and cross-promotion networks among AAA publishers secure economies of scale. Regulatory discourse on in-app payments and antitrust continues to influence store policies and fee structures that shape the mobile gaming market.
Europe presents mixed growth under heightened regulation. Germany approached EUR 10 billion in 2023 revenue, up 6% year-on-year, with in-game purchases reaching EUR 4.742 billion Byshonkov. Telecom-bundled cloud gaming trials illustrate synergy between 5G rollouts and content demand. Still, fragmented loot-box rules and the EU Consumer Protection guidelines force design changes. Mobile services added EUR 1.1 trillion to European GDP in 2023, or 5% of output GSMA, showing the sector’s macro importance. Success in Europe now hinges on compliance agility and tailored monetization.
Competitive Landscape
The competitive structure shows concentration at the top while a long tail of indie studios fight for discovery. Tencent and NetEase hold leading portfolios and invest aggressively overseas. Western incumbents such as Activision Blizzard and Electronic Arts extend console IPs into mobile, amplifying recognition. Sega’s USD 776 million purchase of Rovio and Savvy Games’ USD 4.9 billion acquisition of Scopely reflect a consolidating pipeline aimed at scale and cross-platform leverage NortonRoseFulbright.
Privacy-driven UA turbulence favors large publishers with first-party data. They cross-promote internally and rely less on paid UA. Smaller studios seek publishing or white-label partners to offset rising iOS CPIs. AI-assisted development compresses asset-creation time and enables quicker iteration cycles. Firms that couple analytics with procedural content gain speed and cost advantages, sharpening competition in the mobile gaming market.
Cloud partnerships add another dimension. Telecom operators, GPU vendors and streaming platforms court developers to populate subscription catalogues. Such alliances exchange guaranteed traffic for exclusivity windows or revenue-share terms. The interplay of infrastructure, IP strength and data science will decide positional shifts over the forecast horizon.
Mobile Gaming Industry Leaders
-
Tencent Holdings Ltd.
-
NetEase Inc.
-
Activision Blizzard Inc.
-
miHoYo Co., Ltd.
-
Electronic Arts Inc.
- *Disclaimer: Major Players sorted in no particular order
Need More Details on Market Players and Competitors?
Download PDF
Recent Industry Developments
- April 2025: The EU Consumer Protection Cooperation Network issued key principles on virtual-currency pricing, mandating transparent dual-price display for mobile games
- December 2024: okémon Trading Card Game Pocket reached 60 million downloads and USD 180 million revenue in six weeks post-launch
- October 2024: Deutsche Telekom introduced “5G+ Gaming” bundle giving six-month access to 100 premium games
- August 2024: Fortnite re-entered EU mobile storefronts through Digital Markets Act provisions
Global Mobile Gaming Market Report Scope
Mobile games are video games designed for electronic devices like smartphones. Consumers access these mobile games through popular platforms like Amazon App Store, Google Play, and Apple's App Store, or opt for direct online streaming.
The mobile gaming market is segmented by monetization type (in-app purchases, paid apps, and advertising), platform (android and iOS), and geography (North America, Europe, Asia-Pacific, Latin America, and Middle East & Africa).
The report offers the market size in value terms in USD for all the abovementioned segments.
| By Monetization Type | In-app Purchases | ||
| Subscription and Season Passes | |||
| Advertising (Rewarded Video, Interstitial, Native) | |||
| Premium Paid Downloads | |||
| By Platform | Android | ||
| iOS | |||
| Third-Party Android Stores | |||
| By Device Type | Smartphones | ||
| Tablets | |||
| By Game Genre | Casual and Hyper-Casual | ||
| Action/Adventure | |||
| Strategy and MOBA | |||
| Role-Playing (RPG) | |||
| Sports and Racing | |||
| Casino and Card | |||
| By Geography | North America | United States | |
| Canada | |||
| Mexico | |||
| South America | Brazil | ||
| Argentina | |||
| Rest of South America | |||
| Europe | Germany | ||
| United Kingdom | |||
| France | |||
| Italy | |||
| Spain | |||
| Rest of Europe | |||
| Asia-Pacific | China | ||
| Japan | |||
| South Korea | |||
| India | |||
| Rest of Asia-Pacific | |||
| Middle East and Africa | United Arab Emirates | ||
| Saudi Arabia | |||
| South Africa | |||
| Rest of Middle East and Africa | |||
By Monetization Type
| In-app Purchases |
| Subscription and Season Passes |
| Advertising (Rewarded Video, Interstitial, Native) |
| Premium Paid Downloads |
By Platform
| Android |
| iOS |
| Third-Party Android Stores |
By Device Type
| Smartphones |
| Tablets |
By Game Genre
| Casual and Hyper-Casual |
| Action/Adventure |
| Strategy and MOBA |
| Role-Playing (RPG) |
| Sports and Racing |
| Casino and Card |
By Geography
| North America | United States |
| Canada | |
| Mexico | |
| South America | Brazil |
| Argentina | |
| Rest of South America | |
| Europe | Germany |
| United Kingdom | |
| France | |
| Italy | |
| Spain | |
| Rest of Europe | |
| Asia-Pacific | China |
| Japan | |
| South Korea | |
| India | |
| Rest of Asia-Pacific | |
| Middle East and Africa | United Arab Emirates |
| Saudi Arabia | |
| South Africa | |
| Rest of Middle East and Africa |
Need A Different Region or Segment?
Customize Now
Key Questions Answered in the Report
What is the current Mobile Gaming Market size?
In 2025, the Mobile Gaming Market size is expected to reach USD 135.06 billion.
Who are the key players in Mobile Gaming Market?
Tencent Holdings Limited, Nintendo Co. Ltd, Activision Blizzard Inc., Zynga Inc. and GungHo Online Entertainment Inc. ( SoftBank Group) are the major companies operating in the Mobile Gaming Market.
Which is the fastest growing region in Mobile Gaming Market?
Asia Pacific is estimated to grow at the highest CAGR over the forecast period (2025-2030).
Which region has the biggest share in Mobile Gaming Market?
In 2025, the North America accounts for the largest market share in Mobile Gaming Market.
What years does this Mobile Gaming Market cover, and what was the market size in 2024?
In 2024, the Mobile Gaming Market size was estimated at USD 99.46 billion. The report covers the Mobile Gaming Market historical market size for years: 2019, 2020, 2021, 2022, 2023 and 2024. The report also forecasts the Mobile Gaming Market size for years: 2025, 2026, 2027, 2028, 2029 and 2030.
Page last updated on: July 7, 2025

