Market Overview
| Study Period | 2020 - 2031 |
|---|---|
| Forecast Data Period | 2026 - 2031 |
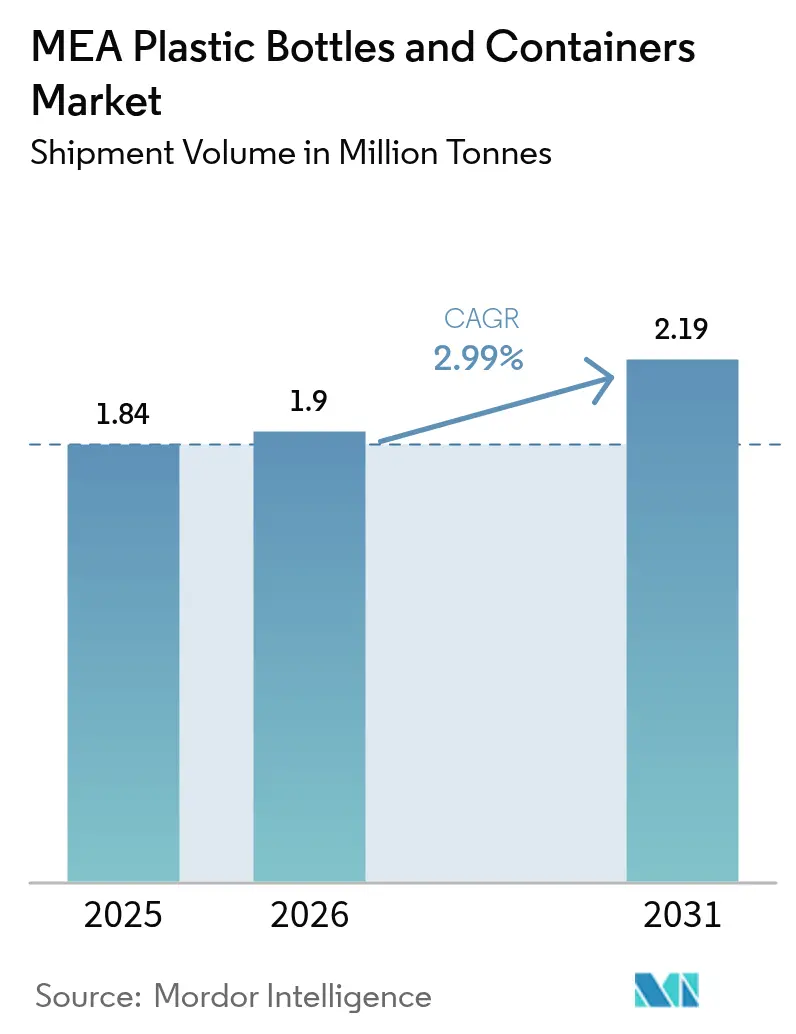
| Base Year Market Size (2025) | 1.84 Million tonnes |
| Market Volume (2026) | 1.9 Million tonnes |
| Market Volume (2031) | 2.19 Million tonnes |
| Growth Rate (2026 - 2031) | 2.99% CAGR |
| Market Concentration | Medium |
Major Players *Disclaimer: Major Players sorted in no particular order Image © Mordor Intelligence. Reuse requires attribution under CC BY 4.0. | |
MEA Plastic Bottles And Containers Market Analysis by Mordor Intelligence
The Middle East and Africa plastic bottles and containers market size is expected to grow from 1.84 million tonnes in 2025 to 1.9 million tonnes in 2026 and is forecast to reach 2.19 million tonnes by 2031 at 2.99% CAGR over 2026-2031. Growth reflects government efforts to reconcile economic diversification with sustainability mandates, particularly across the Gulf Cooperation Council, where large-scale desalination infrastructure keeps bottled-water demand elevated. Momentum is strongest in beverage categories, yet pharmaceuticals are gaining traction as regional healthcare systems upgrade cold-chain logistics and drug-delivery requirements. Investment in advanced injection stretch blow molding lines allows local converters to lower gram weights by up to 20% without compromising barrier performance, helping producers offset resin price swings. Regulatory pushes for food-grade recycled PET (rPET) in Saudi Arabia and the United Arab Emirates, combined with rising consumer preference for refillable formats, are reshaping procurement strategies and opening premium niches for certified materials.
Key Report Takeaways
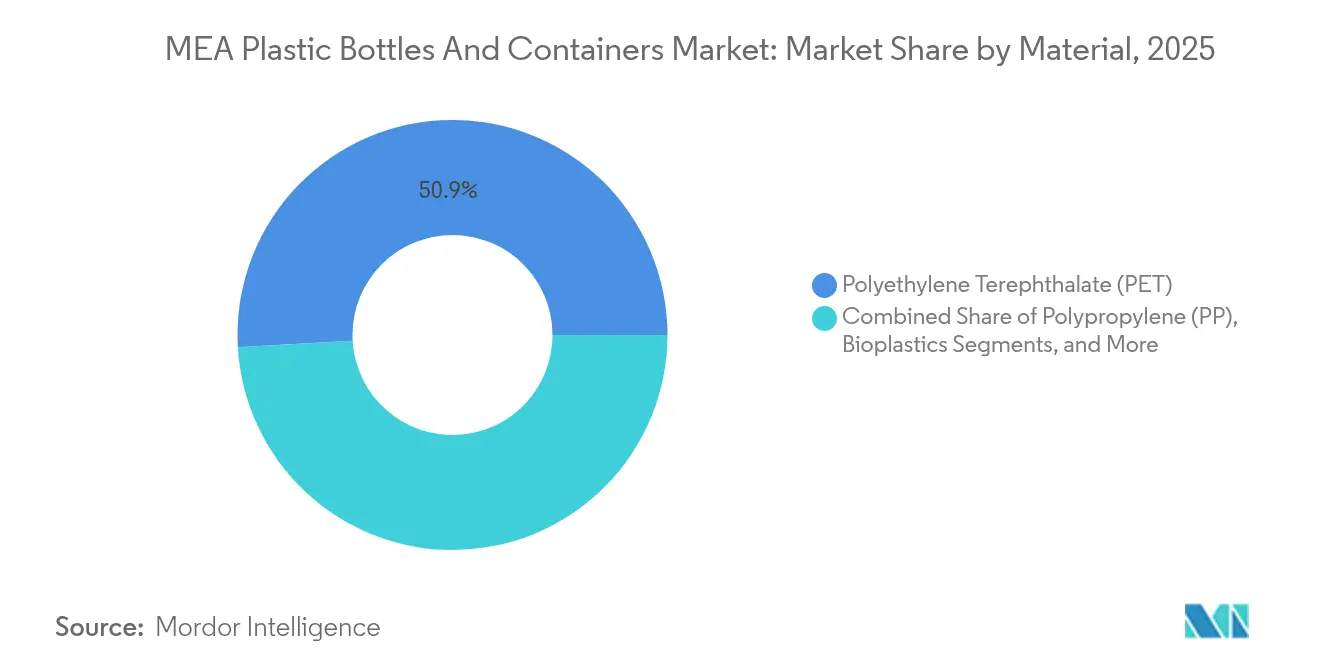
- By material, Polyethylene Terephthalate commanded 50.90% of the Middle East and Africa plastic bottles and containers market share in 2025, while bioplastics are forecast to expand at a 4.78% CAGR through 2031.
- By packaging type, bottles accounted for 48.12% of revenue in 2025; ampoules and vials are projected to grow at a 4.62% CAGR to 2031.
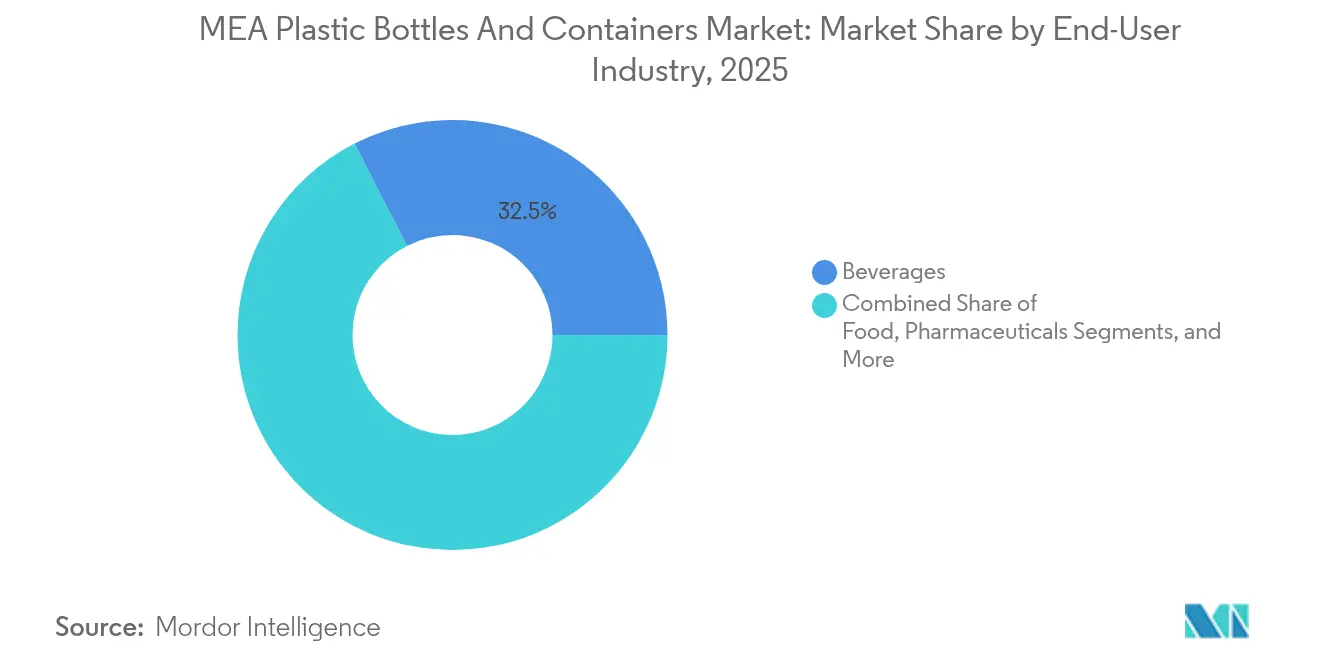
- By end-user, beverages led with 32.53% share in 2025, whereas pharmaceuticals show the fastest trajectory at a 5.37% CAGR to 2031.
- By manufacturing technology, injection stretch blow molding held 29.45% of output in 2025; injection blow molding is on course for a 4.05% CAGR during the outlook period.
- By geography, Saudi Arabia represented 22.32% of the 2025 volume, and South Africa is expected to post a 5.88% CAGR between 2026 and 2031.
Note: Market size and forecast figures in this report are generated using Mordor Intelligence’s proprietary estimation framework, updated with the latest available data and insights as of 2026.
MEA Plastic Bottles And Containers Market Trends and Insights
Drivers Impact Analysis*
| Driver | (~) % Impact on CAGR Forecast | Geographic Relevance | Impact Timeline |
|---|---|---|---|
| Lightweight PET bottle adoption | +0.8% | GCC core expanding to North Africa | Medium term (2-4 years) |
| Packaged-water and soft-drink boom | +0.6% | GCC primary spillover to Levant | Short term (≤2 years) |
| Food-grade rPET regulation | +0.5% | Saudi Arabia and UAE | Long term (≥4 years) |
| Solar-desalination container demand | +0.4% | MENA coastal moving inland | Medium term (2-4 years) |
| E-commerce returnable PET growth | +0.3% | Urban MEA hubs | Long term (≥4 years) |
| Source: Mordor Intelligence | |||
Increasing Adoption of Lightweight PET Bottles
Lightweight PET formats appeal to converters seeking margin protection as paraxylene price swings keep resin costs volatile. Saudi regulators endorse PET for sensitive applications because of its chemical inertness, encouraging similar standards across the rest of the GCC.[1]Saudi Food and Drug Authority, “Food Contact Materials Standards,” sfda.gov.sa Modern stretch-blow molding machines in UAE plants achieve even wall thickness and consistently hit sub-20-gram targets for 500-milliliter water bottles, cutting freight costs on long cross-desert hauls. Design refinements translate into fewer pallets per million units shipped, directly lowering scope 3 emissions. Carbonated soft-drink lines spearhead adoption because high line speeds amplify each gram saved, while smaller dairy producers in Levant markets move more cautiously due to cap-application torque constraints. Continued equipment upgrades suggest a medium-term payoff as brand owners integrate downstream refill programs that lean on robust bottle integrity over multiple life cycles.
Surge in Packaged-Water and Soft-Drink Demand Across GCC
Per-capita water consumption in the Gulf often exceeds 500 liters daily, a figure linked to triple-digit heat indices and desalinated supply ubiquity. UAE retailers report double-digit unit sales growth of 200-milliliter PET bottles catering to tourist demand during peak travel months. Soft-drink bottlers capitalize on year-round refrigeration penetration, positioning single-serve carbonated drinks at service-station forecourts frequented by long-haul drivers moving between economic zones. Despite network upgrades that cut non-revenue water losses to 4.6%, many consumers still favor branded bottles because of taste consistency and mineral add-backs. Harmonized Gulf standards for food-contact plastics reduce border checks, enabling pan-GCC supply chains that leverage shared production hubs in Jebel Ali and Dammam.
Regulatory Push for Food-Grade rPET in Saudi Arabia and UAE
Saudi Arabia’s framework requiring comprehensive decontamination validation before rPET use in food contact creates tiered pricing but promises long-run resilience via local closed-loop models. UAE’s certification program offers tax credits for companies surpassing minimum recycled-content thresholds, directing capital towards depolymerization plants able to produce virgin-equivalent resin. Front-runner resin suppliers lock in offtake contracts with global beverage brands eager to secure supply for premium SKUs. The rules also influence label design; prominent “made with 25% rPET” markers in Arabic and English bolster consumer trust, encouraging higher shelf-price acceptance. Success in these markets is likely to inspire similar legislation in Egypt and Jordan once sufficient reclaim capacity becomes available.
Solar-Desalination Boom Driving Bulk-Water Container Uptake
Photovoltaic-powered desalination slashes water production costs to as low as USD 0.40 per cubic meter, broadening the economic case for agricultural irrigation and industrial cooling. Modular plant footprints mean distribution often relies on 5,000-liter HDPE tanks trucked to greenhouse clusters rather than permanent pipelines. Polyolefin suppliers develop UV-stabilized grades rated for 25-year desert exposure, ensuring containers outlast consecutive maintenance cycles. Kenya’s coastal counties study similar installations to reduce drought risk, signaling that container demand will rise in non-oil African states as capital costs fall. Container manufacturers respond by adding rotational molding halls adjacent to ports to reduce raw material import freight.
Restraints Impact Analysis*
| Restraint | (~) % Impact on CAGR Forecast | Geographic Relevance | Impact Timeline |
|---|---|---|---|
| Anti-plastic legislation and consumer backlash | -0.7% | UAE, Oman, Ethiopia | Short term (≤2 years) |
| Volatile crude-linked resin pricing | -0.5% | Global impact acute in MEA | Medium term (2-4 years) |
| rPET supply–quality gap | -0.4% | Advanced regional markets | Medium term (2-4 years) |
| Water-scarcity policies curbing single use | -0.3% | Water-stressed zones | Long term (≥4 years) |
| Source: Mordor Intelligence | |||
Intensifying Anti-Plastic Legislation and Consumer Backlash
UAE will enact a comprehensive single-use plastic ban in 2026, forcing restaurants to pivot toward fiber-based cups and aluminum cans.[2]UAE Government, “Single-Use Plastic Ban Implementation,” government.ae Oman and Ethiopia have similar measures scheduled for 2025, compressing the compliance horizon for import-heavy SMEs. Surveys show 92% of UAE shoppers are prepared to pay more for eco-friendly packaging, up four points from 2023, intensifying brand-reputation risks for laggards. Regional fast-food chains fast-track pilot programs with molded-pulp cold-drink cups in anticipation of rule extensions. Distributors managing multi-country portfolios struggle with differing phase-out calendars, complicating inventory management and costing models.
Volatile Crude-Linked Resin Pricing
Spot paraxylene prices can swing by 20% quarter-to-quarter, translating directly into PET resin cost spikes that compress converter margins when beverage contracts are fixed. SABIC’s Q1 2025 results reveal that dynamic pricing tactics are essential to maintain specialty chemical profitability during these swings. Smaller bottle producers lacking hedging arrangements often carry only two weeks of resin inventory, exposing them to sudden cash-flow shocks. Currency depreciation in non-oil African economies amplifies volatility as resin feedstock purchases are denominated in USD. Converters counteract risk by advancing lightweight initiatives and negotiating tolling agreements with petrochemical majors to smooth price transfer.
*Our forecasts treat driver/restraint impacts as directional, not additive. The impact forecasts reflect baseline growth, mix effects, and variable interactions.
Segment Analysis
By Material: PET Dominates While Bioplastics Accelerate
PET accounts for 50.90% of the Middle East and Africa plastic bottles and containers market share in 2025, underscoring its compatibility with beverage carbonation pressures and desert-climate temperature swings. The polymer’s clarity and cost efficiency keep it the default for branded water, soft drinks, and many edible-oil formats. Bioplastics, though just a niche, are forecast to grow at 4.78% as pharmaceutical buyers respond to both patient-safety and carbon-footprint metrics. UPM’s wood-based bottle project with Bormioli Pharma shows potential for drop-in solutions requiring only minor line adjustments.
The Middle East and Africa plastic bottles and containers market benefits from HDPE’s chemical resilience, making it indispensable for jerrycans transporting lubricants and cleaning fluids. LDPE retains relevance for squeeze bottles found in condiment aisles, while polypropylene’s thermal resistance suits autoclave-sterilized ampoules. Specialty resins such as PEN serve ultra-high-barrier medical nutrition products. As recycling streams mature, converters will likely blend rPET with virgin to meet mandatory content thresholds while retaining mechanical strength, protecting brand owners from feedstock price shocks.


By Packaging Type: Bottles Lead, Vials Surge
Bottles captured 48.12% of adoption in 2025, illustrating the format’s universality across consumer beverages, cooking oils, and personal-care refills. Their straightforward geometry aligns with high-speed filling lines, allowing operators to pivot SKUs without extensive tooling revisions. Ampoules and vials, by contrast, are poised for a 4.62% CAGR as governments court pharmaceutical contract manufacturing through tax holidays and export incentives. Gerresheimer’s expanded vial lines in Italy will funnel capacity into emerging Gulf injectable-drug hubs, reinforcing supply reliability.
The Middle East and Africa plastic bottles and containers market finds growth levers in jars for premium skin-care creams and in canisters for powdered nutrition. Jerrycans keep a foothold in rural fertilizer distribution, where gravitational dispensing is favored over pumps. Custom dropper and spray formats, though low in tonnage, command notable margins due to child-resistance requirements and tamper-evident features.
By End-User Industry: Beverage Dominance, Pharmaceutical Momentum
Beverage fillers account for 32.53% of 2025 volume, anchored by the perennial bottled-water segment that flourishes in arid geographies. Soft-drink bottlers, though subject to sugar-tax pressures, continue to introduce smaller portion sizes to defend per-capita consumption. Pharmaceutical demand, however, is on track for a 5.37% CAGR as local plants scale generic injectables and insulin products under incentivized free-zone schemes.
The Middle East and Africa plastic bottles and containers industry also services food processors moving into value-added sauces and spreads, boosting requirements for oxygen-barrier multilayer bottles. Cosmetics brands tap premium PET containers with metallic finishes to stand out on congested e-commerce screens. Industrial chemical players remain stable buyers of high-density formats that protect against corrosive loads, ensuring a diversified revenue base for converters.
By Manufacturing Technology: Stretch-Blow Pre-eminence, Injection-Blow Upside
Injection stretch blow molding underpins 29.45% of 2025 output thanks to its ability to merge clarity, weight reduction, and neck-finish precision at scale. FlexBlow machines running in UAE plants achieve sub-0.08-millimeter wall-thickness tolerances, enabling confident downgauging. Meanwhile, injection blow molding is forecast for a 4.05% CAGR as its inherent cavity-to-cavity consistency attracts pharmaceutical vial producers keen on particulate-free interiors.
Extrusion blow molding still commands the large-format container niche where tactile strength trumps optical aesthetics. Compression blow alternatives remain confined to highly specialized chemical-resistant containers. Digital twin monitoring across molding assets is becoming standard practice, allowing predictive maintenance schedules that limit unplanned downtime and safeguard customer service levels.
Geography Analysis
Saudi Arabia’s market gains momentum from mega-projects such as NEOM, which include on-site pharmaceutical plants requiring sterile containment. High per-capita income supports premium mineral-water lines that use sleeker, lightweight bottles, reinforcing domestic PET resin offtake. UAE acts as a testing ground for rPET adoption; ESMA-certified reclaim grades already appear in leading water brands, validating closed-loop economics for the broader Gulf. Turkey’s customs union with Europe keeps converters aligned with EN 13428 packaging directives, ensuring quick certifications for export-approved formats.
Across North Africa, Morocco and Egypt aim to leverage AfCFTA to funnel filled beverages into sub-Saharan markets, heightening the need for robust packaging resilient to multi-day trucking at 40 °C ambient. Algeria’s subsidy structure for staple foods sustains HDPE jerrycan demand in government-procured cooking-oil programs. East African coastal states court desalination investments that promise downstream container pull-through, especially for irrigation cooperatives reliant on mobile water tanks.
Southern Africa’s regulatory clarity, particularly South Africa’s recycling targets, attracts multinational pharmaceutical fillers who view stable compliance frameworks as a prerequisite for biologic-drug launches. Botswana and Namibia piggy-back on regional distribution hubs in Johannesburg by adopting similar packaging standards, easing pallet reuse across borders. West Africa’s prospects hinge on infrastructure; Ghana’s dual-carriageway upgrades lower transport costs enough to make bottled-water exports into landlocked Burkina Faso economically viable.
Regulatory Landscape
The regulatory environment across the Middle East and Africa is tightening around food-contact safety and circularity obligations. In the GCC, Gulf Standardization Organization Technical Regulation GSO 1863:2021 sets baseline requirements for plastic packages intended for food contact, while Saudi Arabia adds SFDA food-contact suitability expectations with SASO technical regulations and SABER product certification via SASO-notified bodies.
Policy instruments are also moving from general standards to format restrictions and EPR. Dubai Executive Council Resolution No. (124) of 2023 restricts specific single-use items and prohibits single-use plastic beverage cups, lids, plates, food containers, and tableware effective 1 January 2026, which accelerates redesign and material substitution in food-service packaging. In the UAE, MoIAT permits rPET in food-contact packaging subject to conformity certification, while Kenya is strengthening packaging-waste governance through EPR requirements administered by NEMA, including take-back scheme expectations and reporting obligations for plastic packaging producers and importers.
Value Chain Analysis
The regional value chain runs from petrochemical feedstocks and resin production (including integrated players such as SABIC in Saudi Arabia, Borouge in the UAE, and Sasol in Southern Africa) into conversion for preforms and containers using injection stretch blow molding, injection blow molding, extrusion blow molding, and rotational molding. It then connects to downstream filling, distribution, and retail across beverage, food, pharmaceutical, personal care, and industrial chemical end users. Cross-border trade and hub-based manufacturing are particularly important for pan-regional supply of high-volume beverage bottles, as well as for regulated pharmaceutical packs.
Circularity and compliance layers are shifting activities across the chain, with EPR pilots and single-use restrictions pushing converters and brand owners to integrate recovery pathways such as collection, MRF sorting, and mechanical recycling. Companies are also building traceability and certification readiness for food-grade recycled content. Industry bodies such as the GPCA have flagged the transition phase between mechanical and chemical recycling models in the GCC, and continued investments, including the USD 16 million PlastikPack plant inaugurated in Morocco (July 2026), point to ongoing efforts to localize conversion and shorten supply lines.
Competitive Landscape
The Middle East and Africa plastic bottles and containers market features moderate fragmentation as global resin majors, integrated converters, and agile local firms jockey for share. SABIC supplies PET resin, preforms, and downstream packaging design support, leveraging captive feedstock in Jubail to control margins across the chain. Indorama Ventures applies a similar model, complementing resin output with recycling partnerships that guarantee rPET feed, giving beverage brands a ready compliance path for recycled-content mandates.
Gerresheimer’s USD 904 million purchase of Bormioli Pharma in 2024 elevates its portfolio of ready-to-fill vials and cartridges, cementing a first-mover advantage in biologics packaging.[3]Gerresheimer AG, “Gerresheimer Makes Solid Start to the Financial Year 2024,” gerresheimer.com Regional incumbents react by upgrading clean-room capacity to meet ISO 15378 requirements. Digitization also differentiates: Coca-Cola’s GS1 QR codes on returnable PET help track bottle life cycles, enhancing transparency that regulators increasingly request.
Price competition remains fiercest in commodity water bottles, where scale rules, while specialty niches such as child-resistant ophthalmic dropper bottles enjoy double-digit margins. Barriers to entry rise as Extended Producer Responsibility fees escalate; firms that integrate collection and washing assets shield customers from escalating post-consumer packaging levies. Mergers and joint ventures will likely continue, particularly in markets where local capacity falls short of rPET certification thresholds, suggesting a gradual uptick in concentration through 2030.
MEA Plastic Bottles And Containers Industry Leaders
Amcor plc
ALPLA Werke Alwin Lehner GmbH & Co KG
Nampak Ltd
Gerresheimer AG
Mpact Ltd
- *Disclaimer: Major Players sorted in no particular order


Market Opportunities and Future Outlook
Regulatory enforcement around single-use formats and the rollout of EPR mechanisms are creating whitespace for converters that can supply recyclable designs, certified recycled-content packaging, and reuse-ready bottle formats at scale. The UAE EPR pilot launched in July 2025 with Tadweer Group and 26 corporate signatories outlines a path for packaging waste collection and recycling frameworks, which supports demand for compliant bottle and container designs and for suppliers able to participate in take-back and reporting requirements.
Upstream and midstream investments are also expanding the addressable opportunity set for MEA rigid packaging materials and capabilities. TA ZIZ and Alpha Dhabi Holding signed a collaboration agreement in May 2026 for a USD 10 billion industrial chemicals investment in Abu Dhabi, covering inputs used across rigid packaging value chains alongside adhesives and coatings, which underscores efforts to localize materials and improve supply security. In parallel, recycling-adjacent infrastructure is adding capacity, including the BEEAH Group and Greenthesis partnership to develop a PE film recycling facility in Sharjah designed for 7,000 tonnes per year, signaling growing polymer recovery that can complement bottle and container circularity programs, even where food-grade rPET supply remains constrained.
Recent Industry Developments
- June 2026: Nampak committed USD 1.3 million to expansion and replacement projects at its Zimbabwe operations, including Megapak and CarnaudMetalbox units. This improves local packaging supply reliability and operational efficiency in a market where import dependence and currency pressures can disrupt resin and packaging availability.
- December 2025: Nampak disclosed capacity advancements across Beverage South Africa and Beverage Angola, including a planned 2026 relocation of a spare Angolan line to South Africa. This supports faster regional responsiveness for beverage-packaging demand and shifts assets toward higher-throughput corridors in Southern Africa.
- April 2024: ALPLA expanded its footprint in Morocco by acquiring a majority stake in Atlantic Packaging, forming ALPLA Morocco. The transaction strengthens the regional conversion presence and broadens access to local customers seeking standardized, multinational-grade packaging capabilities.


Research Methodology Framework and Report Scope
Market Definition and Coverage
This market covers rigid plastic bottles and plastic containers used to pack and store products across the Middle East and Africa. Demand is counted at the point they are sold into end-use supply chains, regardless of the resin used.
Scope exclusions: Excludes caps and closures, labels and sleeves, secondary packaging like cartons and stretch wrap, and non-plastic formats such as glass and metal.
Segmentation Overview
- By Material
- Polyethylene Terephthalate (PET)
- High-Density Polyethylene (HDPE)
- Polypropylene (PP)
- Low-Density Polyethylene (LDPE)
- Bioplastics
- Other Plastics
- By Packaging Type
- Bottles
- Jars and Canisters
- Jerrycans
- Ampoules and Vials
- Other Packaging Types
- By End-user Industry
- Beverages
- Non-Alcoholic Beverages
- Bottled Water
- Carbonated Soft Drinks
- Dairy and Functional Drinks
- Other Non-Alcoholic Beverages
- Alcoholic Beverages
- Non-Alcoholic Beverages
- Food
- Pharmaceuticals
- Cosmetics and Personal Care
- Industrial Chemicals
- Other End-user Industries
- Beverages
- By Manufacturing Technology
- Extrusion Blow Moulding
- Injection Stretch Blow Moulding
- Injection Blow Moulding
- Compression Blow Moulding
- Other Manufacturing Technologies
- By Geography
- Middle East
- Saudi Arabia
- United Arab Emirates
- Turkey
- Rest of Middle East
- Africa
- South Africa
- Kenya
- Rest of Africa
- Middle East
Data Validation & Update Cycle
Outputs are validated through multiple checks, including whether country totals reconcile with trade direction, whether implied per-capita container use stays realistic, and whether resin mix shifts are consistent with what converters and brand owners report. When variances show up, the assumptions behind weights, penetration, and end-use allocation are reopened, and follow-up calls are triggered to confirm what changed.
Before sign-off, the model is reviewed in steps by another analyst to keep calculation logic, unit conversions, and country rollups consistent. Reports are refreshed annually, with interim updates when a material event occurs, such as a major capacity start-up, a policy change affecting packaging, or a visible demand shock. Right before delivery, a final pass is completed so clients receive the most current view available.
Mordor Intelligence's Middle East and Africa Plastic Bottles Containers Market Size Measured Against Other Published Estimates
Published market sizes for plastic bottles and containers in MEA often do not align because publishers mix different units, different channel points (factory gate vs wholesale), and different product boundaries, then update assumptions at different times. The result is that even when the geography sounds the same, the counted revenue or volume can reflect a slightly different basket.
Caps and closures are a common add-on in packaging numbers, but they sit outside Mordor Intelligence's scope here, keeping the total focused on the rigid bottle and container body only. Some estimates also present value using nominal wholesale prices and fold in broader container categories across narrower geographies, and these differences can shift totals relative to a volume-led model anchored to end-use demand and weight assumptions.
Benchmark comparison
| Source | Market Size | Gaps in Research Methodology |
|---|---|---|
| Mordor Intelligence | USD 1.84 M (2025) | |
| Regional Consultancy A | USD 8.70 B (2026) | Uses a value-based frame with a different base year, and the scope language suggests a wider packaged-goods container pool where pricing and channel point are not clearly stated. |
| Trade Data Publisher B | USD 6.20 B (2035) | Targets MENA rather than all MEA and values are stated at nominal wholesale prices, which can shift totals versus a volume-led model that is anchored to end-use demand and weight assumptions. |
Taken together, the spread is mainly explained by what is counted within the container body, the pricing layer used for value, and the exact regional cut. By keeping inputs tied to end-use demand signals, realistic gram weights, and repeatable cross-checks, the estimate remains easier to audit and update when conditions change.


Key Questions Answered in the Report
What size will the Middle East and Africa plastic bottles and containers market reach by 2031?
Volume is projected to total 2.19 million tonnes by 2031, reflecting a 2.99% CAGR during 2026-2031.
Which material currently dominates regional bottle applications?
PET accounts for 50.90% of 2025 demand thanks to its clarity, strength-to-weight ratio, and recyclable nature.
Where is the fastest growth expected geographically?
South Africa is set for a 5.88% CAGR as pharmaceutical expansion and recycling mandates stimulate packaging upgrades.
How are rPET regulations shaping supply strategies?
Saudi Arabia and UAE now require certified food-grade rPET, prompting investments in advanced recycling plants and long-term offtake contracts.
What technology holds the largest share of container production?
Injection stretch blow molding contributes 29.45% of output due to its efficiency in producing lightweight, high-clarity bottles.
Page last updated on:


