Market Overview
| Study Period | 2020 - 2031 |
|---|---|
| Forecast Data Period | 2026 - 2031 |
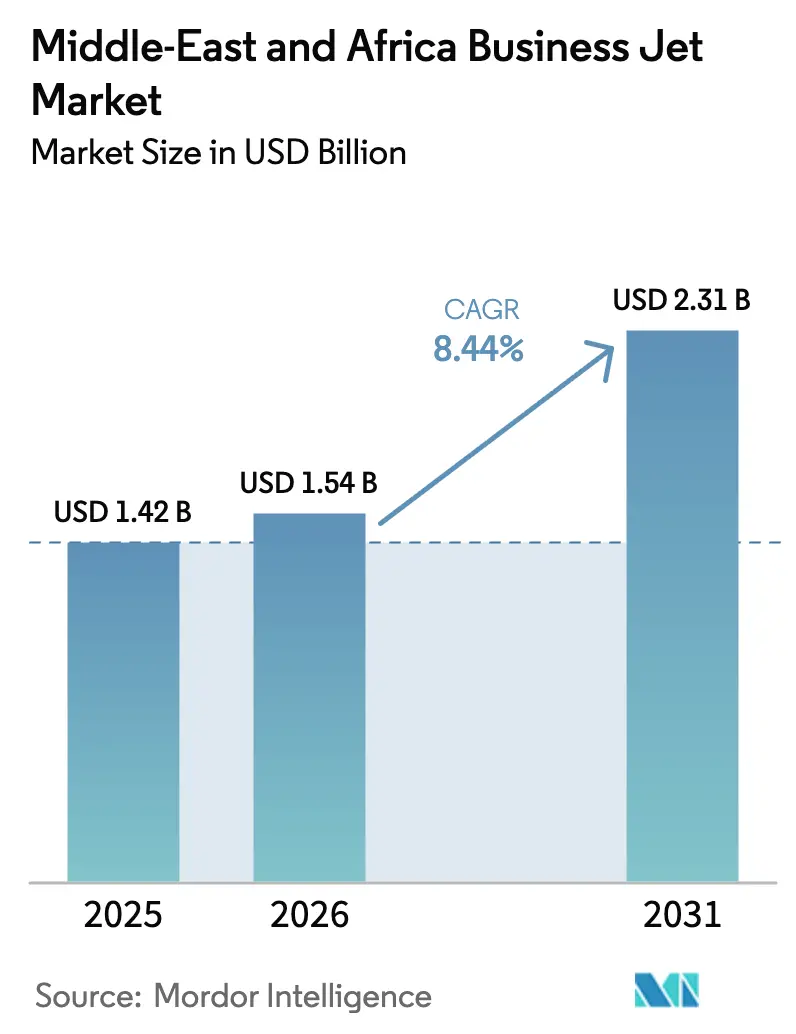
| Base Year Market Size (2025) | USD 1.42 Billion |
| Market Size (2026) | USD 1.54 Billion |
| Market Size (2031) | USD 2.31 Billion |
| Growth Rate (2026 - 2031) | 8.44% CAGR |
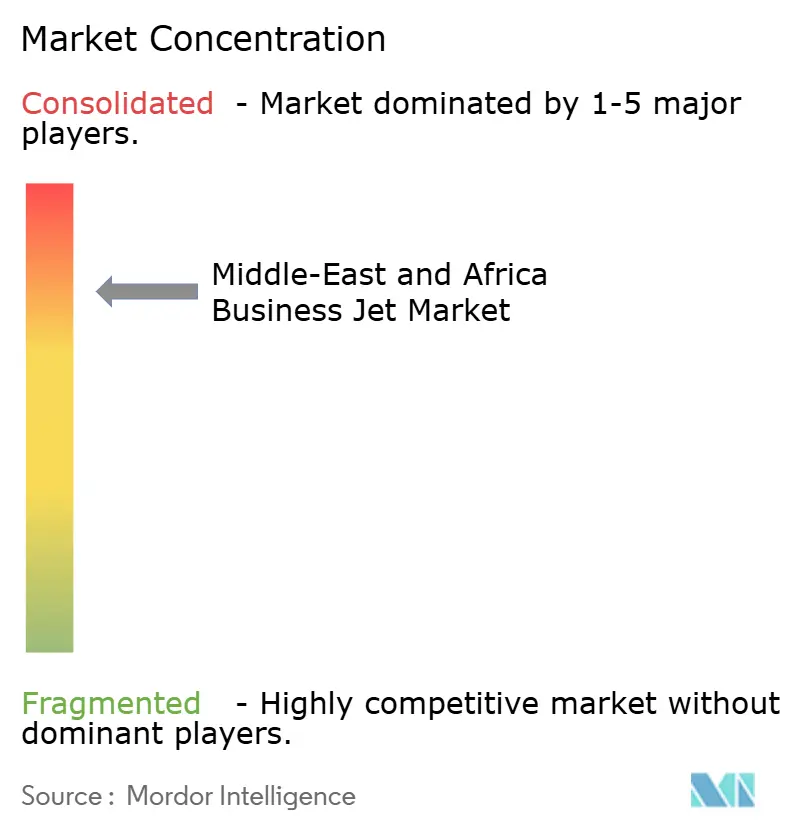
| Market Concentration | High |
Major Players *Disclaimer: Major Players sorted in no particular order Image © Mordor Intelligence. Reuse requires attribution under CC BY 4.0. | |
Middle-East And Africa Business Jet Market Analysis by Mordor Intelligence
The Middle East and Africa business jet market size in 2026 is estimated at USD 1.54 billion, growing from 2025 value of USD 1.42 billion with 2031 projections showing USD 2.31 billion, growing at 8.44% CAGR over 2026-2031. Rising ultra-high-net-worth migration into Gulf Cooperation Council economies, sovereign wealth fund-backed airport investments, and regulatory reforms that allow foreign operators to fly domestic legs across Saudi Arabia are set to reinforce double-digit demand momentum. Large-cabin aircraft platforms capable of nonstop Dubai-Cape Town or Doha-Singapore missions dominate fleet acquisition plans. At the same time, on-demand charter apps broaden market access for younger entrepreneurs and portfolio managers. Operators are accelerating fleet renewal to meet ICAO CORSIA Phase-2 fuel-burn limits, which favors new-generation jets able to fly on 35% sustainable aviation fuel blends. Meanwhile, tax-free aircraft registries inside UAE free zones pull regional fleet basing away from legacy offshore jurisdictions.
Key Report Takeaways
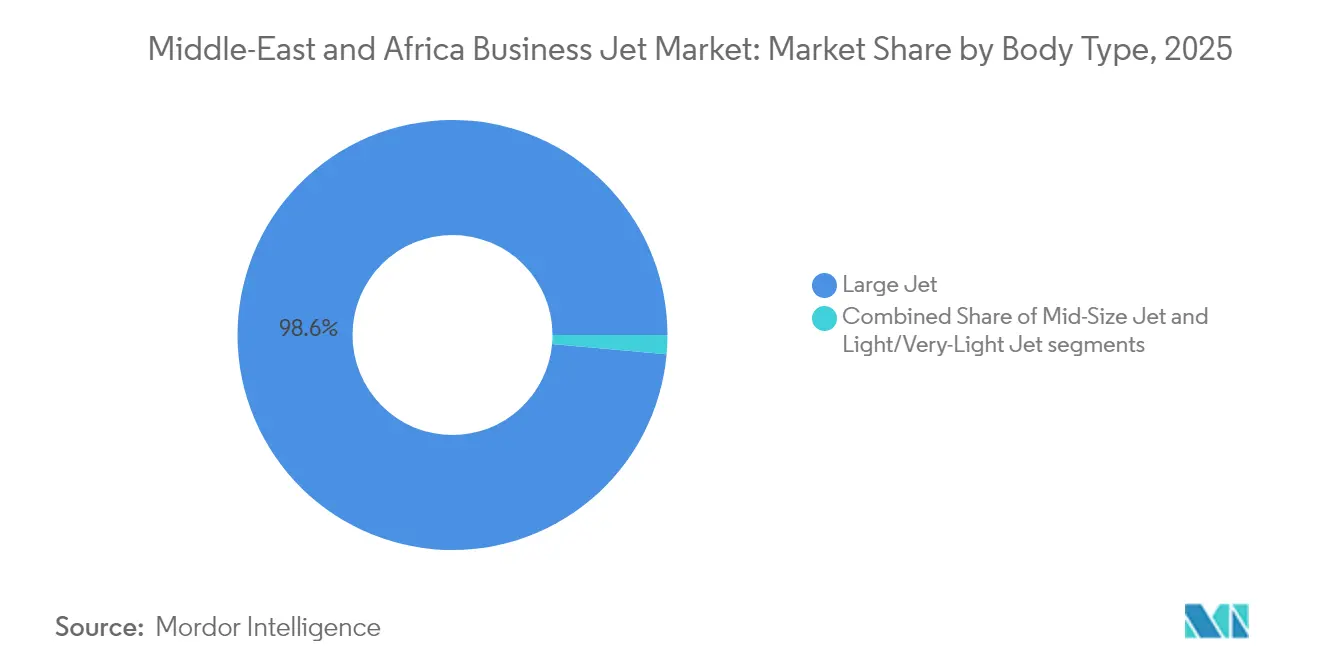
- By body type, large jets commanded 98.58% of the Middle East and Africa business jet market share in 2025, and the market is projected to advance at an 8.25% CAGR through 2031.
- By end user, individual ownership accounted for 54.72% of the market share in 2025, while charter and air-taxi services are projected to expand at a 9.47% CAGR through 2031.
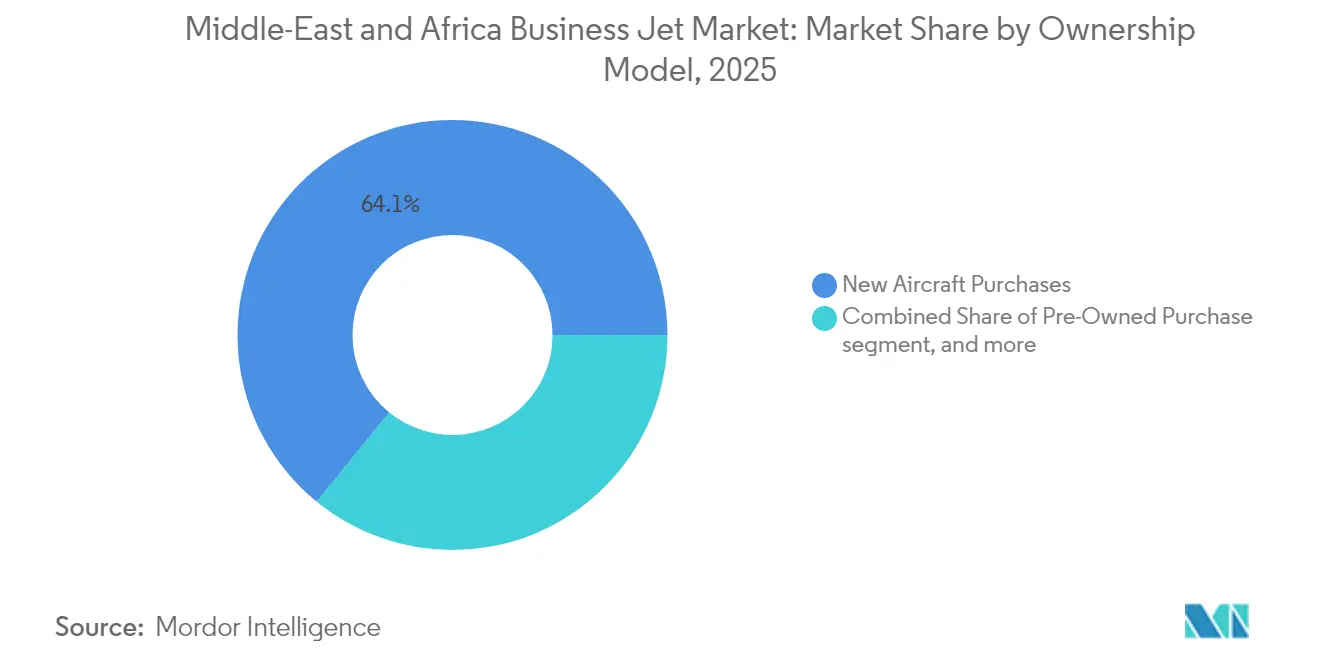
- By ownership model, new-aircraft purchases captured 64.12% share of the Middle East and Africa business jet market size in 2025, while jet cards and membership programs are forecasted to grow at a 10.02% CAGR through 2031.
- By country, Qatar held 28.21% revenue share in 2025, while its market is projected to grow at a 7.28% CAGR to 2031.
Note: Market size and forecast figures in this report are generated using Mordor Intelligence’s proprietary estimation framework, updated with the latest available data and insights as of 2026.
Middle-East And Africa Business Jet Market Trends and Insights
Drivers Impact Analysis*
| Driver | (~) % Impact on CAGR Forecast | Geographic Relevance | Impact Timeline |
|---|---|---|---|
| Escalating UHNW population in GCC | +2.1% | GCC states, spillover to Egypt and South Africa | Medium term (2-4 years) |
| Sovereign-fund investment in regional FBO networks | +1.8% | GCC core, expanding to Kenya and Nigeria | Long term (≥ 4 years) |
| Fleet-renewal wave ahead of ICAO CORSIA Phase-2 | +1.3% | Global, concentrated in UAE and Saudi Arabia | Short term (≤ 2 years) |
| Tax-free aircraft registration in UAE free zones | +0.9% | UAE, competitive pressure on Qatar and Bahrain | Medium term (2-4 years) |
| eVTOL ecosystem spill-over to very light jet demand | +0.7% | Saudi Arabia and UAE early adoption markets | Long term (≥ 4 years) |
| Relaxed foreign-ownership caps under Saudi Vision 2030 | +0.6% | Saudi Arabia, potential regional harmonization | Medium term (2-4 years) |
| Source: Mordor Intelligence | |||


Escalating UHNW Population in GCC
Gulf economies continue adding new millionaires at a pace unmatched outside the US, with the UAE welcoming 6,700 arrivals in 2024, a 68% gain over 2019.[1]Henley & Partners, “UAE Attracts 6,700 Millionaires in 2024,” henleyglobal.com Family offices that manage cross-border assets require point-to-point access into secondary African and Asian markets not covered by commercial airlines. Wealth migration also lifts corporate flight activity, as investment-arm executives need short-fuse site visits to mining concessions, equity targets, and infrastructure projects. The corresponding rise in private banking and legal advisory hubs inside Dubai International Financial Centre and Qatar Financial Centre institutionalizes business aviation demand, ensuring a resilient revenue floor despite cyclical oil-price swings. As these UHNW households benchmark global lifestyle standards, owning or chartering intercontinental jets becomes a mainstream mobility tool rather than a conspicuous luxury. The effect creates a structural lift for the Middle East and Africa business jet market long after the peak of first-time aircraft deliveries.
Sovereign-Fund Investment in Regional FBO Networks
GCC wealth funds that manage more than USD 4 trillion collectively now tag aviation infrastructure as a priority asset class, improving fixed-base operator (FBO) density from Doha to Lagos.[2]SWFI, “GCC Sovereign Wealth Funds Lead Global Infrastructure Investments,” swfinstitute.org Mubadala, PIF, and QIA back purpose-built VIP terminals and maintenance hangars, creating integrated ecosystems where operators can refuel, refurbish cabins, and swap crews on a single parking stand. Each new FBO acts as a network node that extends nonstop mission envelopes into underserved African airfields, effectively enlarging the Middle East and Africa business jet market catchment. The model also anchors skills transfer, as OEMs train local technicians inside these hubs, making the region less dependent on European service centers. Over the long term, sovereign fund-financed infrastructure will compress aircraft turnaround times by up to 35%, translating into better fleet utilization and higher charter revenue yields.
Fleet-Renewal Wave Ahead of ICAO CORSIA Phase-2
CORSIA Phase-2, mandatory from 2027, pushes operators to swap legacy Gulfstream G450 or Falcon 900 variants for new G700, Global 7500, or Falcon 10X models that burn 18% less fuel and can fly on neat sustainable aviation fuel loads.[3]ICAO, “CORSIA Implementation Guidelines,” icao.int Failure to modernize would leave flight departments paying carbon offset fees that could erode 15% of EBITDA on long-haul charter missions. The timeline dovetails with natural replacement cycles, as many Middle East and Africa business jet market fleets acquired between 2010 and 2015 reach 12-year maintenance thresholds. OEMs have advanced order books, with Qatar Executive already inducting two G700s in January 2025.[4]Qatar Airways, “Qatar Executive Takes Delivery of First Gulfstream G700,” qatarairways.com This renewal wave will inject USD 720 million of factory-new aircraft spending into the regional supply chain by 2028.
Tax-Free Aircraft Registration in UAE Free Zones
Dubai South Aviation District and Abu Dhabi Global Market waive import duties, VAT, and profit taxes on qualifying aircraft, trimming total acquisition outlays by 18% versus traditional flag states.[5]UAE GCAA, “Aircraft Registration Guidelines,” gcaa.gov.ae Operators gain from 24-hour one-stop issuance of airworthiness certificates, while owners enjoy straightforward financing structures governed by English common-law frameworks. These advantages nudge fleet relocation decisions toward Emirates-controlled airfields, boosting line-maintenance workloads and charter traffic. Competitive ripple effects press Bahrain and Qatar to enhance their registry offerings, pointing to a region-wide race to zero on aircraft transaction friction. Over the medium term, the policy is expected to anchor more than 150 additional aircraft within UAE airspace, cementing its role as the administrative domicile of the Middle East and Africa business jet market.
Restraints Impact Analysis*
| Restraint | (~) % Impact on CAGR Forecast | Geographic Relevance | Impact Timeline |
|---|---|---|---|
| Jet-A1 supply bottlenecks at secondary airports | -1.4% | Sub-Saharan Africa, secondary Gulf airports | Short term (≤ 2 years) |
| Volatile oil-price swings curbing government jet purchases | -0.8% | Oil-dependent economies across MEA region | Medium term (2-4 years) |
| Lengthy traffic-rights clearance for charter operations | -0.6% | Sub-Saharan Africa, bilateral agreement gaps | Medium term (2-4 years) |
| Import-duty waiver review creating purchase-price uncertainty | -0.4% | African markets, excluding GCC free zones | Short term (≤ 2 years) |
| Source: Mordor Intelligence | |||
Jet-A1 Supply Bottlenecks at Secondary Airports
The January 2025 outage at South Africa’s OR Tambo hub after the NATREF refinery fire forced reroutes that inflated charter trip times by 90 minutes on average. Similar kerosene scarcities in Mali and the Central African Republic triggered unscheduled tech stops in Accra, denting customer confidence in pan-African charter reliability. Many sub-Saharan strips rely on single-truck overland delivery instead of pipeline feeds, leaving inventories one bad road accident away from empty. Operators have begun wet-leasing portable fuel bladders, yet these temporary fixes raise insurance premiums and erode payload margins. Until storage terminals and supply logistics are modernized, the fuel bottleneck will weigh on the short-haul charter calculus that underpins part of the Middle East and Africa business jet market growth.
Volatile Oil-Price Swings Curbing Government Jet Purchases
When Brent collapsed below USD 70 in late 2024, finance ministries in Angola and Algeria froze discretionary capital budgets, postponing Dassault Falcon and Embraer Legacy tenders. IMF researchers link every USD 10 crude decline to a 1.2-point drop in hydrocarbon-exporter fiscal balances, compressing fleet modernization funds. Public backlash against perceived luxury spending adds political friction, as seen in Nigeria’s debate over a new presidential jet. State procurement deferrals reverberate across local maintenance providers who depend on government hangar work to sustain technician rosters. While high-net-worth private orders can soften revenue dips, the constraint trims headline demand cycles and complicates supply-chain planning for OEM field offices.
*Our forecasts treat driver/restraint impacts as directional, not additive. The impact forecasts reflect baseline growth, mix effects, and variable interactions.
Segment Analysis
By Body Type: Dominance of Intercontinental Cabins Continues
Large jets controlled 98.58% of the Middle East and Africa business jet market in 2025, reflecting the core requirement for 4,000-plus nautical-mile stage lengths on Dubai–Cape Town or Doha–São Paulo rotations. Their segment is projected to expand at an 8.25% CAGR, which implies large-cabin deliveries worth roughly USD 6.15 billion between 2026 and 2031. The Middle East and Africa business jet market size attached to large jets reached USD 1.4 billion in 2025 and is forecast to widen as sovereign wealth funds and multi-family offices anchor fleet plans around aircraft with a 7,500-nautical-mile range. Operators also value the type’s high-thrust engines that cope with 40 °C ramp temperatures typical in Gulf summers.
Mid-size and super-mid platforms enjoy niche uptake on Riyadh–Cairo or Abu Dhabi–Muscat circuits, where overnight stopover flexibility outweighs cabin volume. However, eVTOL back-of-house logistics now feed very-light-jet demand for 30-minute feeder hops into secondary Saudi economic zones. Gulfstream’s inbound G800 and Dassault’s Falcon 10X lines will keep the spotlight on large-cabin innovation, embedding broadband Ka-band connectivity and low-EMS cabin architecture that attract Fortune Global 500 boardrooms. These features turn the large-cabin class into a mobile headquarters, reinforcing its supremacy inside the Middle East and Africa business jet market.


By End User: Charter Ascends as Corporates Seek Agility
Full private ownership still accounted for 54.72% of 2025 deliveries, but charter and air-taxi services are on pace for a 9.47% CAGR through 2031. The Middle East and Africa business jet market size attributable to on-demand models is projected to climb from USD 497 million in 2026 to USD 780 million by 2031. Saudi Arabia’s elimination of cabotage walls and the rise of app-based pricing engines shorten booking touchpoints and democratize access beyond traditional royal-family patrons. Mining conglomerates in Zambia and fintech start-ups in Kenya now rent flight hours instead of capital-intensive assets, echoing global asset-light trends.
Fractional shares, though embryonic, attract investment trusts that bundle aircraft time with other alternative assets. Charter providers pivot by packaging multi-sector flight passes that pool volume discounts across client cohorts, flattening seasonal demand spikes. Meanwhile, government and humanitarian users maintain baseline flight activity for medevac and diplomatic runs, insulating charter operators from purely luxury-driven cycles and adding resilience to the Middle East and Africa business jet market.
By Ownership Model: Membership Programs Gain Ground
New-build deliveries represented 64.12% of aircraft intake in 2025, yet jet-card and pay-as-you-fly memberships are growing fastest at 10.02% CAGR. The shift lowers commitment thresholds, allowing wealth-management millennials to lock in hourly rates without asset-depreciation exposure. In revenue terms, membership plans contributed USD 207 million to the Middle East and Africa business jet market size in 2026 and may top USD 333 million by 2031. Operators hedge empty-leg risk through algorithmic scheduling that clusters members with overlapping itineraries, raising dispatch efficiency.
Pre-owned aircraft supply, a by-product of CORSIA-driven upgrades, finds takers among upstart charter brands that refurbish cabins with sustainable textiles to appeal to ESG-minded passengers. Leasing houses offers operating leases pegged to LIBOR-successor rates, enabling fleet expansion without balance-sheet strain. Over the forecast horizon, hybrid structures combining guaranteed-availability cards with residual-value guarantees will likely proliferate and further diversify the ownership mix in the Middle East and Africa business jet market.
Geography Analysis
Gulf Cooperation Council states account for roughly 64.80% of the Middle East and Africa business jet market value, backed by tax-incentivized registries and sovereign-fund infrastructure pipelines. Qatar’s 28.21% 2025 share underscores the efficacy of a focused hub-and-spoke strategy that funnels high-net-worth passengers through Hamad’s purpose-built VIP terminal. The UAE continues to attract fleet basings through Dubai South’s streamlined registration, while Abu Dhabi leverages government mission flying to maintain year-round slot occupancy. Saudi Arabia is pivoting from import-substitution to export-oriented tourism, a move expected to bolster intra-GCC charter demand by 10.68% annually through 2031.
Although smaller, Africa’s contribution represents the fastest CAGR component of the broader Middle East and Africa business jet market. South Africa leads with established MRO centers at OR Tambo and Lanseria, receiving a ZAR 1.34 billion (USD 75 million) expansion in 2024. Nigeria’s charter ecosystem benefits from oil-major shuttle flights but suffers from currency mismatches that inflate parts-procurement costs. Egypt and Kenya leverage geographic crossroads positions for Red Sea tourism and East-African mining corridors. Cross-border trade pacts such as the African Continental Free Trade Area elevate city-pair demand beyond historic colonial routing patterns. However, infrastructure gaps fuel depot scarcities, night-landing restrictions, and congested air-traffic corridors continue to pull traffic back to Gulf hubs for tech stops, reinforcing those hubs’ centrality in the Middle East and Africa business jet market network map.
Competitive Landscape
Western OEMs dominate airframe technology, yet regional operators shape service-quality benchmarks inside the Middle East and Africa business jet market. Gulfstream leads with more than 120 aircraft domiciled in GCC territories, leveraging ultra-long-range cabins that align with trans-continental mission logic. Bombardier advances its competitive stance via Global 8000 development pledges and by certifying ExecuJet’s Dubai workshop to perform Global 7500 heavy checks. Dassault positions the Falcon 10X as a fuel-efficient alternative with a 7,500-nautical-mile runway performance suited to short African strips.
Regional service brands use aggressive fleet-modernization timelines to capture high-yield charter clientele. Qatar Executive’s induction of G700s, RoyalJet’s Airbus ACJ320neo order, and Saudia’s eVTOL memorandum illustrate a differentiated fleet strategy. Maintenance, repair, and overhaul incumbents such as Gama Aviation and ExecuJet double hangar footprints, betting on a compound 7% growth in engine-shop visit volumes through 2030. Competitive intensity stays moderate, yet rising charter-app penetration lowers switching costs for passengers, forcing operators to escalate loyalty perks, from guaranteed slot access during Hajj periods to carbon-neutral flight certificates.
Collaborations with local universities on pilot and technician pathways address the talent bottleneck that could otherwise constrain the expansion of the Middle East and Africa business jet market. OEMs co-fund simulator bays inside Emirates Flight Training Academy and Ethiopian Aviation University, ensuring type-rating throughput aligns with delivery peaks. Market rivalry focuses more on ecosystem depth, registries, financing, and sustainable fuel logistics than price wars, maintaining healthy margins even as fleet counts climb.
Middle-East And Africa Business Jet Industry Leaders
Airbus SE
Bombardier Inc.
Textron Inc.
Gulfstream Aerospace Corporation (General Dynamics Corporation)
Dassault Aviation SA
- *Disclaimer: Major Players sorted in no particular order

Recent Industry Developments
- October 2025: The General Authority of Civil Aviation (GACA) of Saudi Arabia granted business jet operator VistaJet approval to conduct domestic flights within the country, making it the first international private jet operator to receive such permission.
- August 2025: Alliance Aviation inaugurated Saudi Arabia's first purpose-built general aviation hangar in AlUla. This new facility enhances AlUla's status as a prominent destination for private and business aviation.
- January 2025: Qatar Executive (QE), the private jet charter division of Qatar Airways Group, received two Gulfstream G700 aircraft, expanding its fleet to 24 aircraft.
- May 2024: Embraer signed a Memorandum of Understanding (MoU) with Saudi Arabia's National Industrial Development Center (NIDC) to develop the country's aerospace industry.


Middle-East And Africa Business Jet Market Report Scope
By Body Type
| Large Jet |
| Mid-Size Jet |
| Light/Very-Light Jet |
By End User
| Individual Owners |
| Businesses and Corporate Entities |
| Charter/Air-Taxi Operators |
| Training and Academic Institutions |
| Government and Special-Mission Operators |
By Ownership Model
| New Aircraft Purchase |
| Pre-Owned Purchase |
| Fractional Ownership |
| Jet Cards/Membership |
By Geography
| Saudi Arabia |
| United Arab Emirates |
| Qatar |
| Algeria |
| Egypt |
| Turkey |
| South Africa |
| Rest of Middle East and Africa |
| By Body Type | Large Jet |
| Mid-Size Jet | |
| Light/Very-Light Jet | |
| By End User | Individual Owners |
| Businesses and Corporate Entities | |
| Charter/Air-Taxi Operators | |
| Training and Academic Institutions | |
| Government and Special-Mission Operators | |
| By Ownership Model | New Aircraft Purchase |
| Pre-Owned Purchase | |
| Fractional Ownership | |
| Jet Cards/Membership | |
| By Geography | Saudi Arabia |
| United Arab Emirates | |
| Qatar | |
| Algeria | |
| Egypt | |
| Turkey | |
| South Africa | |
| Rest of Middle East and Africa |


Market Definition
- Aircraft Type - General Aviation includes aircraft used for corporate aviation, business aviation and other aerial works.
- Sub-Aircraft Type - Business Jets which are private jets and are designed to carry small groups of people and are used for various roles are included in this study.
- Body Type - Light Jets, Mid-Size Jets, and Large Jets according to their ability to carry passengers and flying distance ranges have been included under this study.
| Keyword | Definition |
|---|---|
| IATA | IATA stands for the International Air Transport Association, a trade organization composed of airlines around the world that has an influence over the commercial aspects of flight. |
| ICAO | ICAO stands for International Civil Aviation Organization, a specialized agency of the United Nations that supports aviation and navigation around the globe. |
| Air Operator Certificate (AOC) | A certificate granted by a National Aviation Authority permitting the conduct of commercial flying activities. |
| Certificate Of Airworthiness (CoA) | A Certificate Of Airworthiness (CoA) is issued for an aircraft by the civil aviation authority in the state in which the aircraft is registered. |
| Gross Domestic Product (GDP) | Gross domestic product (GDP) is a monetary measure of the market value of all the final goods and services produced in a specific time period by countries. |
| RPK (Revenue Passenger Kilometres) | The RPK of an airline is the sum of the products obtained by multiplying the number of revenue passengers carried on each flight stage by the stage distance - it is the total number of kilometers traveled by all revenue passengers. |
| Load Factor | The load factor is a metric used in the airline industry that measures the percentage of available seating capacity that has been filled with passengers. |
| Original Equipment Manufacturer (OEM) | An original equipment manufacturer (OEM) traditionally is defined as a company whose goods are used as components in the products of another company, which then sells the finished item to users. |
| International Transportation Safety Association (ITSA) | International Transportation Safety Association (ITSA) is an international network of heads of independent safety investigation authorities (SIA). |
| Available Seats Kilometre (ASK) | This metric is calculated by multiplying Available Seats (AS) in one flight, defined above, multiplied by the distance flown. |
| Gross Weight | The fully-loaded weight of an aircraft, also known as “takeoff weight,” which includes the combined weight of passengers, cargo, and fuel. |
| Airworthiness | The ability of an aircraft, or other airborne equipment or system, to operate in flight and on the ground without significant hazard to aircrew, ground crew, passengers or to other third parties. |
| Airworthiness Standards | Detailed and comprehensive design and safety criteria applicable to the category of aeronautical product (aircraft, engine or propeller). |
| Fixed Base Operator (FBO) | A business or organization that operates at an airport. An FBO provides aircraft operating services like maintenance, fueling, flight training, charter services, hangaring, and parking. |
| High Net worth Individuals (HNWIs) | High Net worth Individuals (HNWIs) are individuals with over USD 1 million in liquid financial assets. |
| Ultra High Net worth Individuals (UHNWIs) | Ultra High Net worth Individuals (UHNWIs) are individuals with over USD 30 million in liquid financial assets. |
| Federal Aviation Administration (FAA) | The division of the Department of Transportation is concerned with aviation. It operates Air Traffic Control and regulates everything from aircraft manufacturing to pilot training to airport operations in the United States. |
| EASA (European Aviation Safety Agency) | The European Aviation Safety Agency is a European Union agency established in 2002 with the task of overseeing civil aviation safety and regulation. |
| Airborne Warning and Control System (AW&C) aircraft | Airborne Warning and Control System (AEW&C) aircraft is equipped with a powerful radar and on-board command and control center to direct the armed forces. |
| The North Atlantic Treaty Organization (NATO) | The North Atlantic Treaty Organization (NATO), also called the North Atlantic Alliance, is an intergovernmental military alliance between 30 member states – 28 European and two North American. |
| Joint Strike Fighter (JSF) | Joint Strike Fighter (JSF) is a development and acquisition program intended to replace a wide range of existing fighter, strike, and ground attack aircraft for the United States, the United Kingdom, Italy, Canada, Australia, the Netherlands, Denmark, Norway, and formerly Turkey. |
| Light Combat Aircraft (LCA) | A light combat aircraft (LCA) is a light, multirole jet/turboprop military aircraft, commonly derived from advanced trainer designs, designed for engaging in light combat. |
| Stockholm International Peace Research Institute (SIPRI) | Stockholm International Peace Research Institute (SIPRI) is an international institute that provides data, analysis, and recommendations for armed conflict, military expenditure, and arms trade as well as disarmament and arms control. |
| Maritime Patrol Aircraft (MPA) | A maritime patrol aircraft (MPA), also known as maritime reconnaissance aircraft is a fixed-wing aircraft designed to operate for long durations over water in maritime patrol roles, in particular, anti-submarine warfare (ASW), anti-ship warfare (AShW), and search and rescue (SAR). |
| Mach Number | The Mach number is defined as the ratio of true airspeed to the speed of sound at the altitude of a given aircraft. |
| Stealth Aircraft | Stealth is a Common term applied to low observable (LO) technology and doctrine, that makes an aircraft near invisible to radar, infrared or visual detection. |


Research Methodology
Mordor Intelligence follows a four-step methodology in all our reports.
- Step-1: Identify Key Variables: In order to build a robust forecasting methodology, the variables and factors identified in Step-1 are tested against available historical market numbers. Through an iterative process, the variables required for market forecast are set and the model is built on the basis of these variables.
- Step-2: Build a Market Model: Market-size estimations for the historical and forecast years have been provided in revenue and volume terms. For sales conversion to volume, the average selling price (ASP) is kept constant throughout the forecast period for each country, and inflation is not a part of the pricing.
- Step-3: Validate and Finalize: In this important step, all market numbers, variables and analyst calls are validated through an extensive network of primary research experts from the market studied. The respondents are selected across levels and functions to generate a holistic picture of the market studied.
- Step-4: Research Outputs: Syndicated Reports, Custom Consulting Assignments, Databases & Subscription Platforms


