Market Overview
| Study Period | 2020 - 2031 |
|---|---|
| Forecast Data Period | 2026 - 2031 |
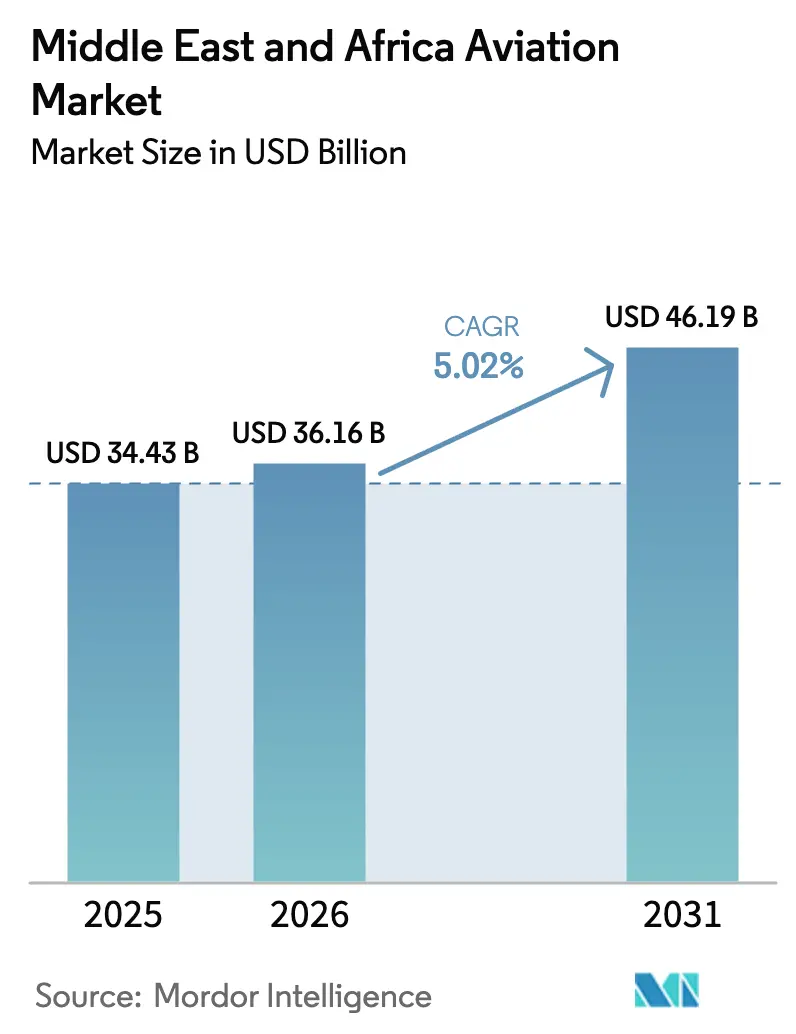
| Base Year Market Size (2025) | USD 34.43 Billion |
| Market Size (2026) | USD 36.16 Billion |
| Market Size (2031) | USD 46.19 Billion |
| Growth Rate (2026 - 2031) | 5.02% CAGR |
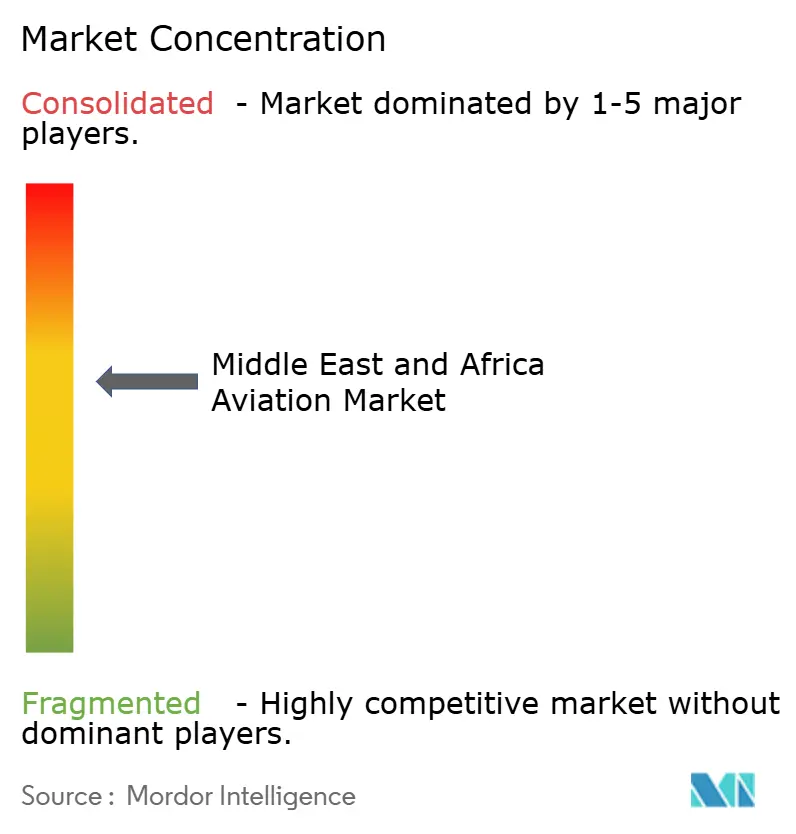
| Market Concentration | Medium |
Major Players *Disclaimer: Major Players sorted in no particular order Image © Mordor Intelligence. Reuse requires attribution under CC BY 4.0. | |
Middle East And Africa Aviation Market Analysis by Mordor Intelligence
The Middle East and Africa (MEA) aviation market size is expected to grow from USD 34.43 billion in 2025 to USD 36.16 billion in 2026 and is forecast to reach USD 46.19 billion by 2031 at 5.02% CAGR over 2026-2031. Fleet-modernization programs backed by sovereign wealth funds, record airport‐infrastructure spending, and the rapid scale-up of low-cost carriers (LCCs) combine to accelerate passenger and cargo flows across the region. Demand for fuel-efficient narrowbody jets, growth in specialized turboprop services, and a rising backlog of maintenance work underscore a shift toward cost-optimized operations and localized aerospace manufacturing. Competitive intensity is building as Saudi Arabia positions new hubs to rival Dubai and Doha, while technology partnerships on sustainable aviation fuel (SAF) and digital MRO solutions strengthen operational economics. Structural tailwinds from tourism diversification agendas, intra-Africa open-skies policies, and government-supported pilot-training pipelines reinforce a positive long-term outlook for the MEA aviation market.
Key Report Takeaways
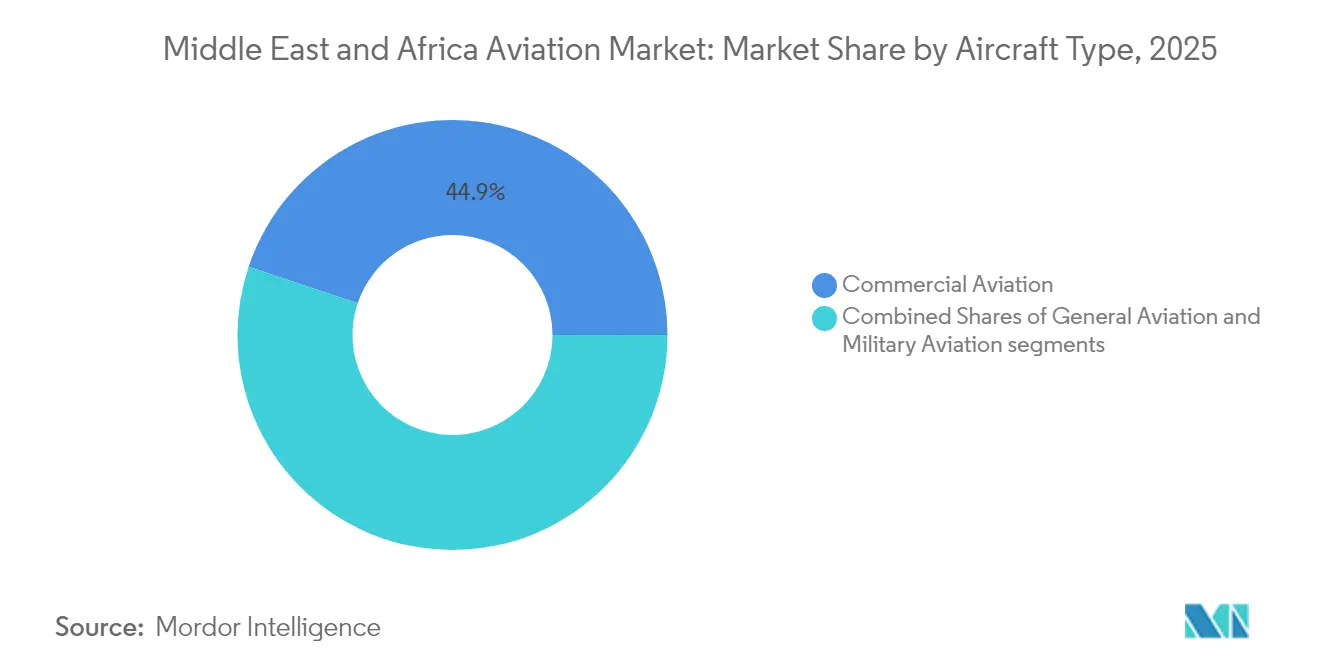
- By aircraft type, commercial aviation held 44.85% of the MEA aviation market in 2025, while general aviation is advancing at a 6.87% CAGR to 2031.
- By propulsion technology, turbofan engines accounted for 48.73% of the MEA aviation market in 2025, whereas turboprop technology is expanding at a 7.44% CAGR through 2031.
- By end user, civil and commercial operators captured 67.61% of the MEA aviation market in 2025; government and defense agencies posted the fastest growth with a 6.08% CAGR.
- By geography, the UAE commanded 45.63% of the MEA aviation market in 2025, yet Saudi Arabia leads expansion with a 5.95% CAGR through 2031.
Note: Market size and forecast figures in this report are generated using Mordor Intelligence’s proprietary estimation framework, updated with the latest available data and insights as of 2026.
Middle East And Africa Aviation Market Trends and Insights
Drivers Impact Analysis*
| Driver | (~) % Impact on CAGR Forecast | Geographic Relevance | Impact Timeline |
|---|---|---|---|
| Rapid growth of low-cost carriers (LCCs) post-COVID | +1.2% | UAE, Saudi Arabia, Egypt | Medium term (2-4 years) |
| Expansion of Gulf hub airports and mega-projects | +1.8% | UAE, Qatar, Saudi Arabia | Long term (≥ 4 years) |
| Sovereign wealth-backed fleet modernization programs | +1.5% | Gulf states, spill-over to Africa | Long term (≥ 4 years) |
| Intra-Africa Open Skies Agreements implementation | +0.7% | Core Africa, limited Gulf impact | Medium term (2-4 years) |
| Demand for specialized mission aircraft | +0.4% | Gulf states, West Africa | Short term (≤ 2 years) |
| Scaling of urban air mobility (UAM) demonstrations | +0.2% | UAE, Saudi Arabia | Long term (≥ 4 years) |
| Source: Mordor Intelligence | |||
Rapid Growth of LCCs post-COVID
LCCs have rebuilt networks faster than legacy rivals, lifting narrowbody demand and spawning point-to-point routes that bypass traditional hubs. Flydubai’s fleet expansion to 119 aircraft by 2024 and Riyadh Air’s target for more than 100 aircraft by 2030 illustrate the new scale of purely price-driven competition. A sharp focus on fuel-efficient A320neo and B737 MAX models reduces unit costs, supports aggressive fare strategies, and shortens fleet-renewal cycles. Ancillary-revenue models, digital distribution, and lean staffing grant LCCs cost flexibility that legacy carriers must match. The broader effect is visible in accelerated MRO demand for next-generation engines and greater regional turboprop usage on thinner routes where cost discipline still matters.
Expansion of Gulf Hub Airports and Mega-Projects
Dubai’s USD 35 billion Al Maktoum International expansion and Saudi Arabia’s USD 50 billion King Salman International Airport project aim to lift combined annual capacity above 380 million passengers.[1]Reuters Staff, “Dubai Airports $35 Billion Expansion Plan Aims to Double Capacity,” Reuters, reuters.com These mega-projects spark sizable orders for ground-support equipment (GSE), automated baggage systems, and widebody aircraft optimized for long-haul transit flows. Construction timelines stretching to 2033 provide visibility for contractors and financing partners. Competitive positioning among hubs drives ancillary infrastructure such as bonded-cargo zones, aero-tech parks, and adjacent hospitality projects, anchoring non-aeronautical revenue streams. The scale of expansion secures the MEA aviation market’s role as a bridge between Asia, Africa, and Europe.
Sovereign Wealth-backed Fleet Modernization Programs
Capital from Saudi Arabia’s PIF and the UAE’s Mubadala fast-tracks aircraft orders, bypasses traditional leasing models, and inserts local content clauses into OEM contracts.[2]Aaron Clark, “Saudi Arabia’s Riyadh Air Signs Partnerships with Boeing, GE,” Bloomberg, bloomberg.com Bulk-purchase leverage wins price concessions and technology-transfer agreements for composite fabrication and engine maintenance. These deals spur regional aerospace clusters, attract tier-1 suppliers, and add fresh capacity to the MEA aviation market ahead of global demand cycles. Fleet-renewal speed also frees older aircraft for secondary markets, widening the available seating and freight capacity mix across emerging African routes.
Intra-Africa Open Skies Agreements Implementation
Thirty-seven signatories to the Single African Air Transport Market remove ownership caps and route restrictions, allowing carriers such as Ethiopian Airlines to connect 60-plus intra-African destinations.[3]African Union Secretariat, “Single African Air Transport Market (SAATM),” African Union, au.int Liberalized traffic rights increase frequency, unlock city-pair combinations, and drive turboprop and small-jet demand suited to under-served runways. The policy’s momentum encourages new entrant carriers, fosters code-share collaboration, and seeds regional maintenance hubs. Implementation gaps remain, but expanding reciprocity supports a more integrated MEA aviation market, links African economies to Gulf hubs, and broadens the pilot-training pipeline.
Restraints Impact Analysis*
| Restraint | (~) % Impact on CAGR Forecast | Geographic Relevance | Impact Timeline |
|---|---|---|---|
| Volatile jet-fuel price pass-through | −1.1% | Region-wide | Short term (≤ 2 years) |
| Persistent geopolitical risks | −0.8% | Red Sea corridor, Iran-Gulf lanes | Medium term (2-4 years) |
| Pilot and MRO skill shortages | −0.6% | Gulf states, emerging Africa | Medium term (2-4 years) |
| Slow certification of alternative propulsion retrofits | −0.3% | Global, early-adopter markets | Long term (≥ 4 years) |
| Source: Mordor Intelligence | |||
Volatile Jet-fuel Price Pass-through
Fuel accounts for 20-30% of operating expenses for MEA carriers, leaving earnings exposed when Brent crude spikes beyond hedged levels.[4]International Air Transport Association Economics, “Airline Fuel and Labour Cost Share Analysis,” IATA, iata.org Limited ability to raise fares in price-sensitive leisure markets forces airlines to absorb cost shocks, slow fleet-acquisition plans, and stretch maintenance intervals. Refining spreads and supply disruptions translate into higher insurance deposits and working-capital needs, squeezing liquidity for smaller operators. Although new-generation engines curb consumption, high capital outlays and longer lead times dilute immediate relief. Fuel-efficiency retrofits gain traction, yet certification lags, delaying full deployment.
Persistent Geopolitical Risks
Conflict-driven airspace closures along the Red Sea, Gulf, and Iran corridors reroute traffic, increase block times, and inflate insurance premiums. Circuitous routing reduces aircraft utilization and disrupts cargo schedules, eroding yields and complicating fleet-planning assumptions. Tense diplomatic relations restrict parts sourcing and hinder cross-border crew deployment, lengthening maintenance downtimes. Investors demand higher return premiums, raising the discount rate on airport projects and airline valuations. Although carriers diversify route networks, uncertainty persists, requiring flexible capacity allocation and contingency reserves throughout the MEA aviation market.
*Our forecasts treat driver/restraint impacts as directional, not additive. The impact forecasts reflect baseline growth, mix effects, and variable interactions.
Segment Analysis
By Aircraft Type: Commercial Leadership Persists as General Aviation Accelerates
Commercial aviation captured 44.85% of the MEA aviation market share in 2025, buoyed by robust hub traffic and sustained passenger-demand recovery. Load factors surpassed 80% on multiple Gulf carriers, stimulating orders for A350, B787, A320neo, and B737 MAX families to refresh fleets and control per-seat costs. Despite headline dominance, rising operating costs and fare competition pressure margins, compelling airlines to renegotiate supplier contracts and invest in digital revenue optimization. On the cargo side, capacity re-balancing improves yields, yet high fuel prices restrict full freighter deployment.
General aviation is forecasted to post a 6.87% CAGR, underpinned by rising numbers of high-net-worth individuals and corporate executives prioritizing schedule flexibility. Business jets, particularly large-cabin and ultra-long-range models, account for growing order books as Gulf governments promote private-aviation services under economic-diversification agendas. Infrastructure build-outs of dedicated FBOs at Riyadh, Jeddah, Dubai South, and Abu Dhabi airports shorten turnaround times and attract charter operators. Helicopter activity in offshore energy projects and emergency medical services adds further lift, pulling MRO providers and simulator manufacturers into the MEA aviation industry ecosystem.


By Propulsion Technology: Turboprop Momentum Challenges Turbofan Incumbency
Turbofan engines retained 48.73% revenue share in 2025, reflecting their entrenched role on wide-body and single-aisle fleets serving trunk and long-haul sectors. OEM roadmaps prioritize higher bypass ratios, lean-burn combustors, and compatibility with sustainable aviation fuel (SAF). Retrofit programs for legacy fleets help carriers delay upfront capex while tapping incremental fuel-burn gains. However, supply-chain constraints for fan blades and hot-section components drive longer overhaul cycles and raise shop-visit costs within the MEA aviation market context.
Turboprop platforms are projected to grow at a 7.44% CAGR, propelled by wider adoption on intra-African routes and specialized offshore missions. Operators value short-field performance, lower trip costs, and flexibility in austere airfield conditions. Ethiopian Airlines’ regional network, West African oil-and-gas logistics, and medical-evacuation contracts collectively push utilization higher. Government incentives for social-inclusion air links and pilot-training schools further stimulate orders of 50-70-seat turboprops, giving OEMs a platform to test hybrid-electric enhancements once certification pathways mature across the MEA aviation market.
By End User: Government Uptake Outpaces Commercial Maturity
Civil and commercial operators commanded 67.61% of the MEA aviation market in 2025, encompassing flagship carriers, cargo specialists, and charter providers. Capacity discipline, ancillaries, and digital merchandising underpin revenue strategies, yet wage inflation and airport-charge increases squeeze margins. Airlines accelerate fleet-simplification plans to cut maintenance costs and streamline crew training, while partnerships such as the 2025 Delta-Riyadh Air joint venture expand long-haul connectivity.
Government and defense agencies are expected to record a 6.08% CAGR, buoyed by modernization budgets, VIP transport needs, and humanitarian-mission requirements under Vision 2030 and comparable African initiatives. Sovereign procurements often bundle aircraft orders with infrastructure, training, and localization packages, creating full-life-cycle demand—for example, Saudi Arabia’s multibillion-dollar agreements covering wide-body fleets, digital maintenance platforms, and pilot-academy expansions. Search-and-rescue (SAR) fleets, maritime patrol conversions, and emergency-services helicopters also widen the MEA aviation industry revenue base.
Geography Analysis
The UAE retained 45.63% of the MEA aviation market in 2025, anchored by Dubai International’s traffic leadership and the USD 35 billion Al Maktoum expansion that will lift system capacity to 260 million passengers by 2033. Emirates and Etihad continue widebody acquisitions, sustaining regional MRO slots and component-repair demand. Free-zone regulations, streamlined visa processes, and a pro-aviation tax regime attract freight integrators and business aviation brands. The UAE’s geographic position between Asia and Europe secures long-haul connectivity, though rising hub competition from Riyadh and Doha prompts service-quality upgrades and diversified revenue streams.
Saudi Arabia registers the fastest CAGR at 5.95%, propelled by USD 50 billion airport investments, Riyadh Air’s planned 100-plus aircraft fleet, and liberalized traffic-rights policies targeting 330 million annual passenger movements by 2030. Strategic funding from PIF accelerates timeline certainty and encourages OEMs to establish regional assembly or maintenance nodes. Domestic connectivity goals stimulate turboprop and regional jet demand linking secondary cities, while business aviation infrastructure supports corporate headquarters relocations. Regulatory modernization, including digital slot allocation and performance-based navigation, enhances operational efficiency across the MEA aviation market.
Elsewhere, Ethiopia positions Addis Ababa as Africa’s prime transfer hub, leveraging Ethiopian Airlines’ network breadth and MRO footprint to service 60-plus regional destinations. Nigeria’s demographic heft drives latent demand, yet infrastructure deficits and currency constraints temper growth. Kenya capitalizes on Nairobi’s logistics role, integrating cargo and passenger services under an open-skies philosophy. North African markets—Morocco, Egypt, Tunisia—balance leisure inflows with fleet-upgrade requirements, while South African carriers restructure to regain profitability. Collectively, non-Gulf geographies provide diversified traffic flows that support route-network resilience and foster the MEA aviation market’s overall sustainability.
Competitive Landscape
Western OEMs retain order backlog dominance. However, sovereign wealth funds and regional conglomerates increasingly dictate contract terms, preferring end-to-end solutions that include technology transfer, local assembly, and lifecycle support. Airbus secures major widebody commitments driven by its low fuel-burn A350-900, whereas Boeing aligns with digital-maintenance partnerships such as its GE-linked ecosystem on GEnx engine support. COMAC and Embraer test long-term prospects via exploratory discussions on regional-jet placements, aiming to tap Africa’s thin-route needs in the MEA aviation market.
Airlines leverage joint ventures, alliances, and equity stakes to expand capacity and access new customer segments. The 2025 Delta–Riyadh Air partnership integrates loyalty programs and coordinated schedules, demonstrating cross-continent collaboration that bypasses traditional alliance silos. Vertical integration deepens, with carriers building in-house MRO hangars—Flydubai’s USD 190 million facility at Dubai South—and training schools to mitigate labor shortages. Independent MRO shops seize overflow demand, especially for LEAP-1A and Pratt & Whitney GTF engine overhauls, where global shop-visit queues extend beyond 12 months.
Digital transformation underpins competitive differentiation. Predictive maintenance software, real-time load-factor analytics, and dynamic pricing engines help carriers trim costs and lift yields. Meanwhile, sustainability commitments—net-zero targets, SAF-usage trials, and single-engine taxiprocedures—provide measurable performance benchmarks. Market newcomers such as Riyadh Air rapidly adopt these solutions, offering a technology leap that incumbents seek to match, intensifying innovation cycles within the MEA aviation market.
Middle East And Africa Aviation Industry Leaders
Airbus SE
The Boeing Company
Lockheed Martin Corporation
Embraer S.A.
Leonardo S.p.A.
- *Disclaimer: Major Players sorted in no particular order

Recent Industry Developments
- October 2025: Bahrain Airport Company (BAC) partnered with Valo Aviation to develop a dedicated private jet facility at Bahrain International Airport (BIA). This project aims to enhance business aviation infrastructure by offering maintenance, repair, and ground handling services tailored to modern private aircraft.
- September 2025: The US Department of Defense (DoD) awarded Boeing contracts worth USD 110.2 million to support US and allied military aircraft. These agreements include upgrades to Qatar’s F-15 fighter jets and software enhancements for the V-22 Osprey tiltrotor.
- May 2025: Qatar Airways and Boeing announced a record-breaking agreement for the airline to purchase up to 210 widebody jets. This deal represents Boeing's most significant widebody order, including the highest number of B787 Dreamliners and Qatar Airways' largest order.


Middle East And Africa Aviation Market Report Scope
By Aircraft Type
| Commercial Aviation | Passenger Aircraft | Narrowbody Aircraft |
| Widebody Aircraft | ||
| General Aviation | Business Jets | Large Jet |
| Mid-Size Jet | ||
| Light Jet | ||
| Piston and Turboprop Aircraft | ||
| Commercial Helicopters | ||
| Military Aviation | Fixed-Wing Aircraft | Combat Aircraft |
| Multi-Role Aircraft | ||
| Transport Aircraft | ||
| Training Aircraft | ||
| Rotorcraft | Multi-Mission Helicopter | |
| Transport Helicopter | ||
| Others | ||
By Propulsion Technology
| Turboprop |
| Turbofan |
| Piston Engine |
| Turboshaft |
| Others |
By End User
| Civil and Commercial Operators |
| Government and Defense Agencies |
| Business and General Aviation Owners |
By Geography
| United Arab Emirates |
| Saudi Arabia |
| Egypt |
| Qatar |
| Algeria |
| South Africa |
| Rest of Middle East and Africa |
| By Aircraft Type | Commercial Aviation | Passenger Aircraft | Narrowbody Aircraft |
| Widebody Aircraft | |||
| General Aviation | Business Jets | Large Jet | |
| Mid-Size Jet | |||
| Light Jet | |||
| Piston and Turboprop Aircraft | |||
| Commercial Helicopters | |||
| Military Aviation | Fixed-Wing Aircraft | Combat Aircraft | |
| Multi-Role Aircraft | |||
| Transport Aircraft | |||
| Training Aircraft | |||
| Rotorcraft | Multi-Mission Helicopter | ||
| Transport Helicopter | |||
| Others | |||
| By Propulsion Technology | Turboprop | ||
| Turbofan | |||
| Piston Engine | |||
| Turboshaft | |||
| Others | |||
| By End User | Civil and Commercial Operators | ||
| Government and Defense Agencies | |||
| Business and General Aviation Owners | |||
| By Geography | United Arab Emirates | ||
| Saudi Arabia | |||
| Egypt | |||
| Qatar | |||
| Algeria | |||
| South Africa | |||
| Rest of Middle East and Africa | |||


Market Definition
- Aircraft Type - All the aircraft related to commercial, military and general aviation have been included in this study
- Sub-Aircraft Type - Fixed-Wing passenger aircraft, freighter aircraft, business jets, piston fixed-wing aircraft, military fixed-wing aircraft, and rotorcraft are included under this study.
- Body Type - Body type includes all types of aircraft segmented based on application/size/capacity/role.
| Keyword | Definition |
|---|---|
| IATA | IATA stands for the International Air Transport Association, a trade organization composed of airlines around the world that has an influence over the commercial aspects of flight. |
| ICAO | ICAO stands for International Civil Aviation Organization, a specialized agency of the United Nations that supports aviation and navigation around the globe. |
| Air Operator Certificate (AOC) | A certificate granted by a National Aviation Authority permitting the conduct of commercial flying activities. |
| Certificate Of Airworthiness (CoA) | A Certificate Of Airworthiness (CoA) is issued for an aircraft by the civil aviation authority in the state in which the aircraft is registered. |
| Gross Domestic Product (GDP) | Gross domestic product (GDP) is a monetary measure of the market value of all the final goods and services produced in a specific time period by countries. |
| RPK (Revenue Passenger Kilometres) | The RPK of an airline is the sum of the products obtained by multiplying the number of revenue passengers carried on each flight stage by the stage distance - it is the total number of kilometers traveled by all revenue passengers. |
| Load Factor | The load factor is a metric used in the airline industry that measures the percentage of available seating capacity that has been filled with passengers. |
| Original Equipment Manufacturer (OEM) | An original equipment manufacturer (OEM) traditionally is defined as a company whose goods are used as components in the products of another company, which then sells the finished item to users. |
| International Transportation Safety Association (ITSA) | International Transportation Safety Association (ITSA) is an international network of heads of independent safety investigation authorities (SIA). |
| Available Seats Kilometre (ASK) | This metric is calculated by multiplying Available Seats (AS) in one flight, defined above, multiplied by the distance flown. |
| Gross Weight | The fully-loaded weight of an aircraft, also known as “takeoff weight,” which includes the combined weight of passengers, cargo, and fuel. |
| Airworthiness | The ability of an aircraft, or other airborne equipment or system, to operate in flight and on the ground without significant hazard to aircrew, ground crew, passengers or to other third parties. |
| Airworthiness Standards | Detailed and comprehensive design and safety criteria applicable to the category of aeronautical product (aircraft, engine or propeller). |
| Fixed Base Operator (FBO) | A business or organization that operates at an airport. An FBO provides aircraft operating services like maintenance, fueling, flight training, charter services, hangaring, and parking. |
| High Net worth Individuals (HNWIs) | High Net worth Individuals (HNWIs) are individuals with over USD 1 million in liquid financial assets. |
| Ultra High Net worth Individuals (UHNWIs) | Ultra High Net worth Individuals (UHNWIs) are individuals with over USD 30 million in liquid financial assets. |
| Federal Aviation Administration (FAA) | The division of the Department of Transportation is concerned with aviation. It operates Air Traffic Control and regulates everything from aircraft manufacturing to pilot training to airport operations in the United States. |
| EASA (European Aviation Safety Agency) | The European Aviation Safety Agency is a European Union agency established in 2002 with the task of overseeing civil aviation safety and regulation. |
| Airborne Warning and Control System (AW&C) aircraft | Airborne Warning and Control System (AEW&C) aircraft is equipped with a powerful radar and on-board command and control center to direct the armed forces. |
| The North Atlantic Treaty Organization (NATO) | The North Atlantic Treaty Organization (NATO), also called the North Atlantic Alliance, is an intergovernmental military alliance between 30 member states – 28 European and two North American. |
| Joint Strike Fighter (JSF) | Joint Strike Fighter (JSF) is a development and acquisition program intended to replace a wide range of existing fighter, strike, and ground attack aircraft for the United States, the United Kingdom, Italy, Canada, Australia, the Netherlands, Denmark, Norway, and formerly Turkey. |
| Light Combat Aircraft (LCA) | A light combat aircraft (LCA) is a light, multirole jet/turboprop military aircraft, commonly derived from advanced trainer designs, designed for engaging in light combat. |
| Stockholm International Peace Research Institute (SIPRI) | Stockholm International Peace Research Institute (SIPRI) is an international institute that provides data, analysis, and recommendations for armed conflict, military expenditure, and arms trade as well as disarmament and arms control. |
| Maritime Patrol Aircraft (MPA) | A maritime patrol aircraft (MPA), also known as maritime reconnaissance aircraft is a fixed-wing aircraft designed to operate for long durations over water in maritime patrol roles, in particular, anti-submarine warfare (ASW), anti-ship warfare (AShW), and search and rescue (SAR). |
| Mach Number | The Mach number is defined as the ratio of true airspeed to the speed of sound at the altitude of a given aircraft. |
| Stealth Aircraft | Stealth is a Common term applied to low observable (LO) technology and doctrine, that makes an aircraft near invisible to radar, infrared or visual detection. |


Research Methodology
Mordor Intelligence follows a four-step methodology in all our reports.
- Step-1: Identify Key Variables: In order to build a robust forecasting methodology, the variables and factors identified in Step-1 are tested against available historical market numbers. Through an iterative process, the variables required for market forecast are set and the model is built on the basis of these variables.
- Step-2: Build a Market Model: Market-size estimations for the historical and forecast years have been provided in revenue and volume terms. For sales conversion to volume, the average selling price (ASP) is kept constant throughout the forecast period for each country, and inflation is not a part of the pricing.
- Step-3: Validate and Finalize: In this important step, all market numbers, variables and analyst calls are validated through an extensive network of primary research experts from the market studied. The respondents are selected across levels and functions to generate a holistic picture of the market studied.
- Step-4: Research Outputs: Syndicated Reports, Custom Consulting Assignments, Databases & Subscription Platforms


