
Managed Network Threat Hunting Services Market Size and Share
Market Overview
| Study Period | 2021 - 2032 |
|---|---|
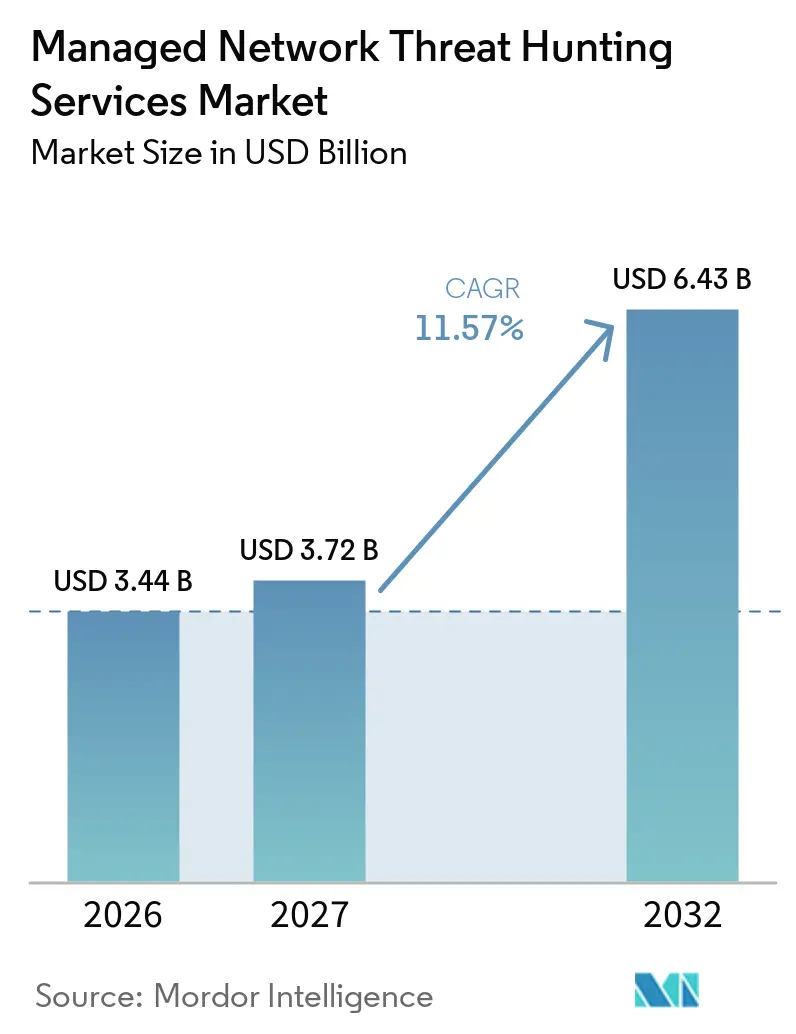
| Market Size (2027) | USD 3.72 Billion |
| Market Size (2032) | USD 6.43 Billion |
| Growth Rate (2027 - 2032) | 11.57 % |
| Fastest Growing Market | Asia-Pacific |
| Largest Market | North America |
| Market Concentration | Medium |
Major Players *Disclaimer: Major Players sorted in no particular order Image © Mordor Intelligence. Reuse requires attribution under CC BY 4.0. | |
Managed Network Threat Hunting Services Market Analysis by Mordor Intelligence
The managed network threat hunting services market size is valued at USD 3.44 billion in 2026 and is projected to reach USD 6.43 billion by 2032, expanding at a CAGR of 11.57% during 2027-2032. Demand is shaped by the speed at which attackers exploit weaknesses and move through corporate networks before internal teams can respond. The managed network threat hunting services market is also shaped by the increasing importance of identity events, cloud logs, and network evidence in a single investigation. Cloud-focused criminal activity, hybrid infrastructure, and SaaS use are extending the telemetry that security teams must review. Buyers are therefore looking for persistent coverage that combines network, identity, endpoint, and cloud evidence rather than periodic investigations. Providers are responding by pairing human analysts with automated triage and by embedding hunting services into broader detection and response platforms. This favors vendors with broad integrations, operational technology coverage, and delivery models that meet local data-handling requirements.
Key Report Takeaways
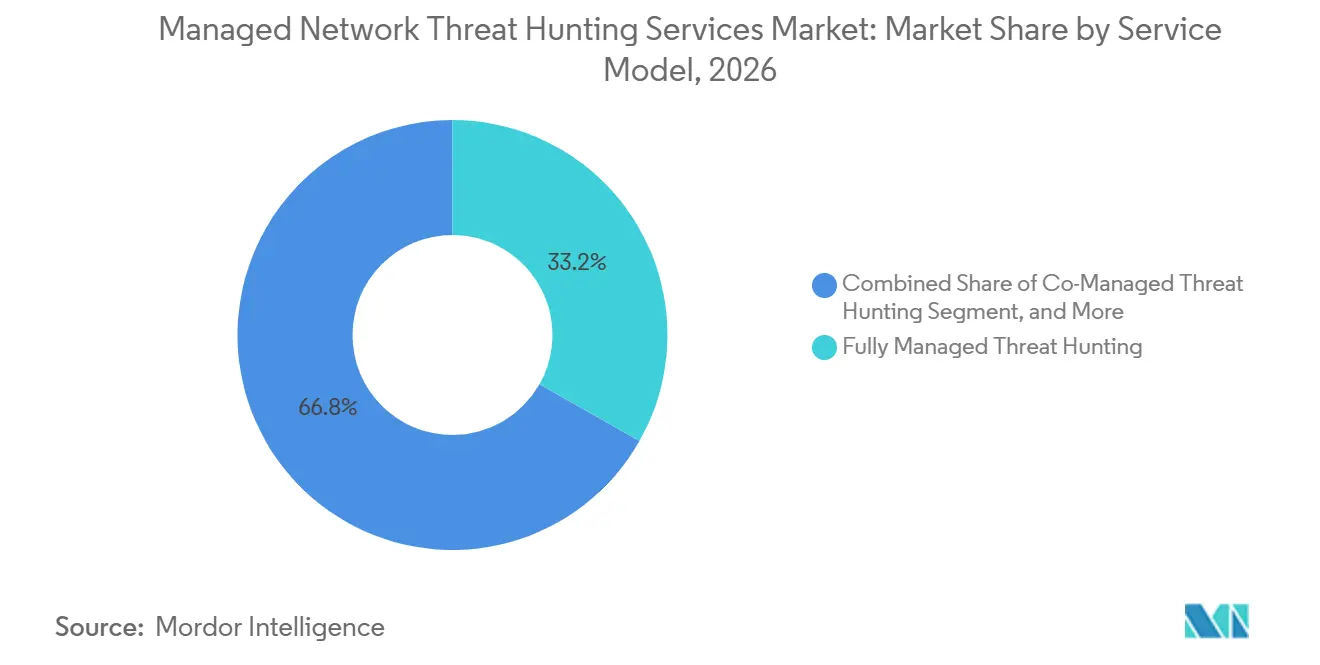
- By service model, fully managed delivery held 33.21% of the managed network threat hunting services market share in 2026, while continuous threat hunting is projected to expand at an 11.87% CAGR through 2032.
- By deployment, cloud-based delivery accounted for 41.27% of the managed network threat hunting services market share in 2026 and is projected to expand at an 11.83% CAGR through 2032.
- By organization size, large enterprises held 69.34% of revenue in 2026, while small and medium-sized enterprises are projected to expand at an 11.92% CAGR through 2032.
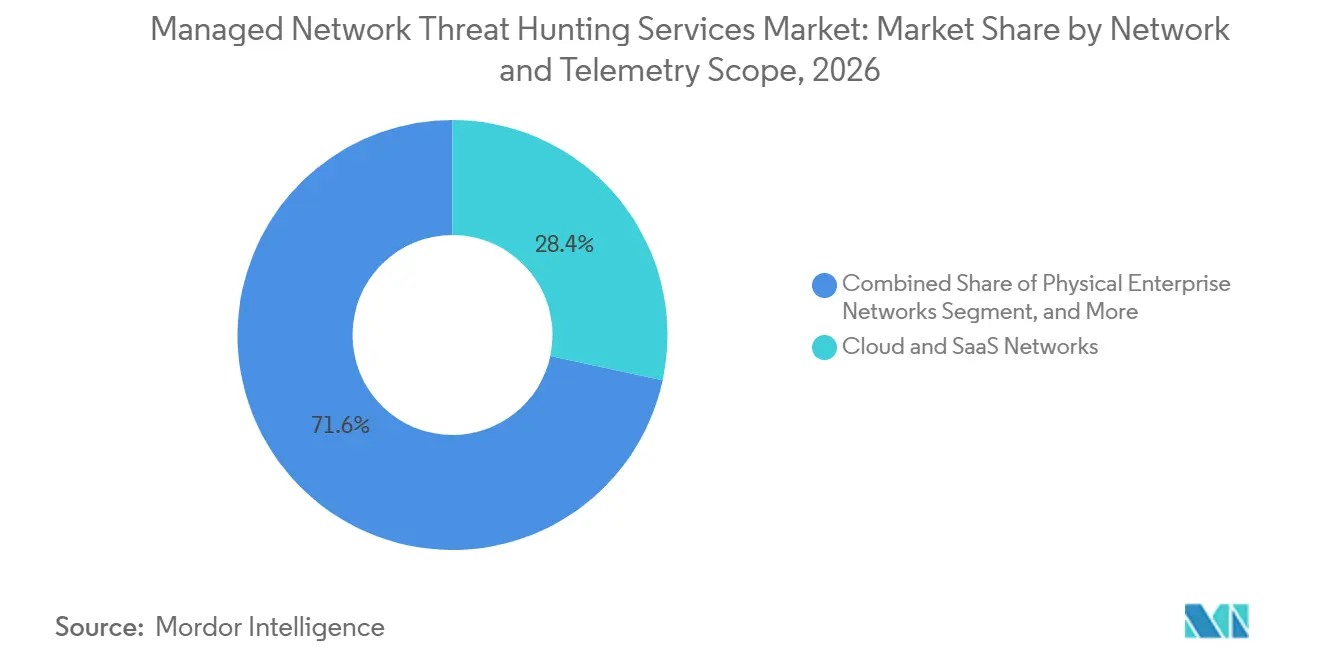
- By network and telemetry scope, cloud and SaaS networks accounted for 28.37% of revenue in 2026, while OT and industrial control systems are projected to expand at an 11.94% CAGR through 2032.
- By industry vertical, BFSI held 21.98% of revenue in 2026, while manufacturing is projected to expand at a 12.33% CAGR through 2032.
- By geography, North America accounted for 41.66% of revenue in 2026, while Asia-Pacific is projected to expand at a 12.14% CAGR through 2032.
Note: Market numbers in this report are based on Mordor Intelligence's proprietary estimation framework, which combines nine months of actuals with Q4 projections for base year 2026.
Market Trends and Insights
Drivers Impact Analysis of Managed Network Threat Hunting Services Market*
| Driver | (~) % Impact on CAGR Forecast | Geographic Relevance | Impact Timeline |
|---|---|---|---|
| Rising Frequency and Sophistication of Network Intrusions | +3.0% | Global, with greater reporting of advanced persistent threat and state-sponsored campaigns in North America and Europe | Short term (≤ 2 years) |
| Shortage of Skilled Threat-Hunting Personnel | +2.5% | Global, with the strongest pressure in Asia-Pacific and Middle East and Africa | Medium term (2-4 years) |
| Expansion of Hybrid Cloud and SaaS Attack Surfaces | +2.0% | Global, especially North America, Europe, and Asia-Pacific | Short term (≤ 2 years) |
| Regulatory and Cyber-Insurance Pressure for Continuous Monitoring | +1.5% | North America and Europe, with effects extending to Asia-Pacific and Middle East and Africa | Medium term (2-4 years) |
| Encrypted East-West Traffic in Operational Technology Environments | +1.0% | Asia-Pacific, North America, and Europe, with early adoption in Middle East and Africa energy infrastructure | Long term (≥ 4 years) |
| MSSP Bundling of Network Telemetry With XDR and SOC Automation | +0.8% | Global | Short term (≤ 2 years) |
| Source: Mordor Intelligence | |||
Rising Frequency and Sophistication of Network Intrusions
The managed network threat hunting services market is supported by intrusions that are continuous and designed to avoid signature-based detection. CrowdStrike reported that vishing intrusions doubled and device-code phishing attempts increased 15 times in the first half of 2026. It also reported that China-nexus groups exploited disclosed vulnerabilities within 24 hours, reducing the time available for patching and conventional monitoring.[1] The SANS survey found that 41% of respondents detected nation-state activity through proactive hunting, while living-off-the-land techniques appeared in 76% of nation-state attacks. CISA documented a 2025 case in which standard user accounts could reach SCADA VLANs at a U.S. critical infrastructure organization, showing how weak IT-to-OT separation can leave critical operations exposed.[2] This pattern makes rapid evidence collection and analyst validation central to an effective service. These conditions increase the value of services that examine behavior across network traffic and related telemetry.
Shortage of Skilled Threat-Hunting Personnel
The managed network threat-hunting services market also benefits from a shortage of experienced personnel capable of investigating complex activity. ISC2 found that 59% of security professionals reported critical or significant skills needs in 2025, up from 44% in 2024, with cloud security and AI-assisted investigation among the leading gaps.[3] The SANS survey identified staffing shortages as the leading barrier to effective threat hunting, cited by 61% of respondents. The same survey showed that outsourced hunting declined from 37% to 30% among respondents. This combination indicates that some organizations are moving work in-house even while specialist skills remain scarce. Providers that use automation to prioritize evidence and reserve human review for higher-value cases can help clients sustain broader coverage.
Expansion of Hybrid Cloud and SaaS Attack Surfaces
Hybrid infrastructure is widening the scope of the managed network threat hunting services market. In the SANS survey, 39% of respondents named cloud infrastructure as the hardest environment to hunt SANS.ORG. Cloud logs, on-premises packet captures, and SaaS identity data often have different formats, retention periods, and levels of detail. This makes it harder for internal teams to reconstruct the full sequence of an intrusion. CrowdStrike documented a 2025 SCATTERED SPIDER attack path from SaaS access to ransomware deployment in less than 24 hours through vishing and help-desk impersonation. Such paths can bypass controls that only observe endpoints or network traffic. The need to connect identity, endpoint, cloud, and network evidence creates demand for providers with broader telemetry coverage.
Regulatory and Cyber-Insurance Pressure for Continuous Monitoring
Regulatory requirements are becoming an important purchasing trigger for the managed network threat hunting services market. The Digital Operational Resilience Act has applied to EU financial entities since January 2025 and requires attention to continuous ICT monitoring and third-party risk. Hong Kong's revised Guideline GL20, effective January 2025, requires insurers to establish systematic network monitoring processes. CFC lists threat hunting as a 24/7 active underwriting service in its 2025 cyber policy materials. These requirements make evidence of recurring behavioral monitoring more important for regulated buyers. They also increase the importance of clear ownership for monitoring, escalation, and third-party oversight. Providers that produce clear records of their monitoring activities can support both compliance and insurance discussions.
Restraints Impact Analysis of Managed Network Threat Hunting Services Market*
| Restraint | (~) % Impact on CAGR Forecast | Geographic Relevance | Impact Timeline |
|---|---|---|---|
| False-Positive Fatigue and Analyst Burnout | -1.2% | Global, most acute where providers lack AI-assisted triage | Short term (≤ 2 years) |
| Integration Complexity Across Multi-Vendor Security Stacks | -0.9% | Global, particularly large enterprises using more than 20 security tools in hybrid settings | Medium term (2-4 years) |
| Data-Residency Restrictions on Cross-Border Telemetry | -0.7% | Europe, Asia-Pacific, and Middle East and Africa | Long term (≥ 4 years) |
| 100 GbE Packet-Capture Cost at Industrial and Air-Gapped Sites | -0.5% | North America and Europe industrial corridors, and Asia-Pacific manufacturing zones | Long term (≥ 4 years) |
| Source: Mordor Intelligence | |||
False-Positive Fatigue and Analyst Burnout
False positives can weaken the operational case for the managed network threat hunting services market when a provider forwards excessive alerts without context. Devo found that 83% of surveyed SOC professionals were overwhelmed by alert volume and false positives. Its survey also found that 57% identified excessive false positives as their main operational challenge. Analysts were reported to spend more than 25% of their working time on non-actionable triage. That workload takes attention away from the hypothesis-led investigation that distinguishes threat hunting from alert forwarding. It can also weaken a client's confidence when many notifications do not result in confirmed findings. Services that improve detection quality and automate early triage are better placed to show meaningful operational value.
Integration Complexity Across Multi-Vendor Security Stacks
Integration demands can delay adoption in the managed network threat hunting services market. Large enterprises may operate more than 20 security products with different log formats, API limits, and alert schemas. Providers must often complete client-specific engineering before a hunting program can begin. This extends implementation time and raises onboarding costs. It also creates dependency on the quality and availability of customer telemetry. Providers may then struggle to apply one consistent hunting playbook across customers. Platform vendors can spread integration investment across their installed base, while smaller providers may face greater pressure on delivery margins.
*Our forecasts treat driver/restraint impacts as directional, not additive. The impact forecasts reflect baseline growth, mix effects, and variable interactions.
Managed Network Threat Hunting Services Market Segment Analysis
By Service Model:
Fully Managed Delivery Leads, Continuous Hunting AcceleratesFully managed delivery held 33.21% of revenue in 2026. The model transfers both daily operations and specialist analysis to an external provider. This is relevant where internal teams cannot recruit or retain enough experienced hunters. SANS found that 61% of respondents considered staffing shortages the leading barrier to effective hunting. Co-managed and hybrid services remain relevant for enterprises that already operate a SOC but need help outside core hours or within specialized OT environments.
Continuous threat hunting is projected to expand at an 11.87% CAGR through 2032. It replaces periodic campaigns with a persistent review of incoming telemetry. CrowdStrike reported that AI agent-triggered detections increased at a rate 2.5 times that of human-triggered detections on its OverWatch platform. ReliaQuest stated that lateral movement can occur in as little as 4 minutes. These conditions reduce the usefulness of infrequent hunting exercises and strengthen demand for continuous service tiers.

By Deployment:
Cloud-Based Delivery Leads Across Share and GrowthCloud-based delivery accounted for 41.27% of the managed network threat hunting services market size in 2026. The deployment model is suited to organizations operating several cloud environments and SaaS applications. Arctic Wolf entered a strategic collaboration agreement with AWS in October 2025 to integrate the Aurora Platform with AWS security telemetry and the Open Cybersecurity Schema Framework. This type of integration places hunting capability closer to cloud security evidence. It also helps providers normalize data across cloud, SaaS, and on-premises environments.
Cloud-based delivery is projected to expand at an 11.83% CAGR through 2032, the highest rate among deployment models. On-premises delivery remains important for government and defense users who cannot route classified telemetry through external cloud systems. Hybrid environments remain relevant where workloads are split across local and cloud infrastructure. Air-gapped and sovereign deployments form a smaller but strategically important category for critical infrastructure and defense operators. Endace introduced a high-capacity packet-capture model in September 2025, which it said offered sustained 60 Gbps recording and up to 3 petabytes of storage in 5 RU. Lower capture costs can improve the feasibility of hunting in isolated network settings.
By Organization Size:
Enterprise Spending Dominates, SME Momentum BuildsLarge enterprises held 69.34% of revenue in 2026. Their multi-site, multi-cloud networks produce a broad volume of data that requires specialist review. They also face compliance requirements under PCI DSS, HIPAA, DORA, and SEC cyber rules. ISACA found that 65% of organizations had unfilled cybersecurity positions in 2025. Fully managed, multi-environment contracts can serve as a practical alternative to building a large internal hunting team.
Small and medium-sized enterprises are projected to expand at an 11.92% CAGR through 2032. Subscription-based delivery can reduce the upfront cost of accessing specialist skills. Cyber-insurance requirements are also increasing the need to show proactive monitoring. N-able found that 90% of MSP respondents expected cybersecurity managed-services revenue to increase in 2025, compared with 80% in the prior year. The same report identified third-party MDR as the leading planned new service addition. MSSPs, therefore, remain a key route for extending managed hunting to the mid-market.
By Network and Telemetry Scope:
Cloud and SaaS Lead, OT Hunting AcceleratesCloud and SaaS networks held 28.37% of revenue in 2026. SaaS applications are increasingly central to business operations and are a target for credential theft and lateral movement. Identity-focused attacks can cross boundaries that older network sensors were not designed to observe. Hunting across cloud and SaaS environments, therefore, requires visibility into identity events as well as traffic and endpoint activity. This broader evidence set helps investigators follow attack paths that move across applications and infrastructure.
OT and industrial control systems are projected to expand at an 11.94% CAGR through 2032. Dragos documented 2026 activity in which several threat groups progressed from reconnaissance to control-loop mapping. Such activity raises the importance of detecting behavior before it affects physical processes. Manufacturing, energy, and utilities operators often need coverage that can work within constrained or air-gapped environments. Managed services can provide specialist OT expertise that internal IT teams may lack. The segment is strengthened by the broader convergence of IT and operational networks.
By Industry Vertical:
BFSI Anchors Revenue, Manufacturing Posts the Highest Growth RateBFSI accounted for 21.98% of the managed network threat-hunting services market in 2026. Financial institutions face high levels of attacker interest and extensive monitoring expectations. DORA has added a formal operational resilience requirement for EU financial entities. These organizations can also fund services that include detailed compliance documentation. Government and defense form another important vertical because they operate in classified threat environments and require data-residency controls. Healthcare and life sciences are expanding use as connected devices and health-record systems add more telemetry for security teams to review.
Manufacturing is projected to expand at a 12.33% CAGR through 2032. IBM identified manufacturing as the most attacked industry for the third consecutive year through 2025. Smart-factory deployments are linking IT systems with OT environments, creating more paths for adversaries to reach production assets. This is moving some buyers beyond endpoint-led detection toward network-focused OT hunting. Energy and utilities demand is also increasing as grid and water operators address attacks on critical services. Telecommunications demand is driven by new east-west traffic volumes associated with 5G infrastructure.
Geography Analysis
North America Managed Network Threat Hunting Services Market
North America accounted for 41.66% of revenue in 2026. The United States has a strong demand for federal cybersecurity guidance, SEC reporting rules, defense-related compliance requirements, and mature cyber-insurance practices, which increase the need for evidence of proactive monitoring. Canada is a significant secondary market in financial services and energy, while Mexico presents an emerging opportunity as near-shoring expands industrial OT environments. CISA's 2025 advisory on IT-to-OT segmentation failures at a U.S. critical infrastructure organization highlights the unaddressed gaps that managed providers can address.
Europe Managed Network Threat Hunting Services Market
Europe is the second-largest regional market. Germany, the United Kingdom, and France are the principal contributors, and the NIS2 Directive has broadened the scope of organizations subject to cybersecurity obligations across essential sectors. Industrial companies in Germany are showing greater interest in OT-specific network hunting as automotive and machinery supply chains face higher cyber risk. Nomios launched Guardian xMDR in April 2026 from a Dutch SOC, using Palo Alto Networks Cortex XDR for the Benelux and wider European market. GDPR-related data limits are encouraging providers to invest in local processing capabilities, which can raise entry requirements while improving the position of established operators.
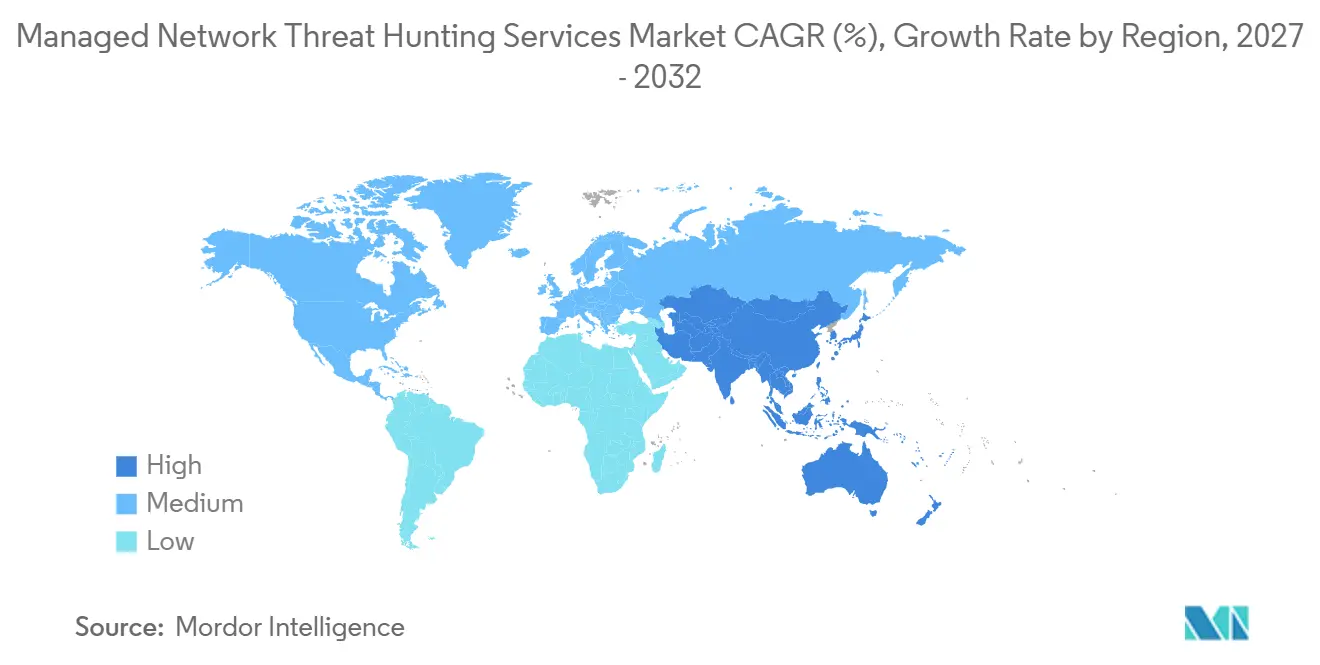
APAC, MEA and South America Managed Network Threat Hunting Services Market
Asia-Pacific is projected to expand at a 12.14% CAGR through 2032, making it the fastest-growing region. Demand is supported by digitalization, state-sponsored activity, sovereign SOC requirements, and shortages of qualified personnel. India's incident-reporting requirements, Japan's active cyber defense measures, South Korea's financial-sector compliance rules, and China's PIPL restrictions are influencing delivery design across the region. The Middle East and Africa are secondary growth regions as Saudi Arabia and the UAE invest in sovereign SOC infrastructure, while South Africa and Egypt drive early adoption in finance and government. South America is led by Brazil, where the LGPD and financial-sector regulation support demand for continuous monitoring.
Competitive Landscape
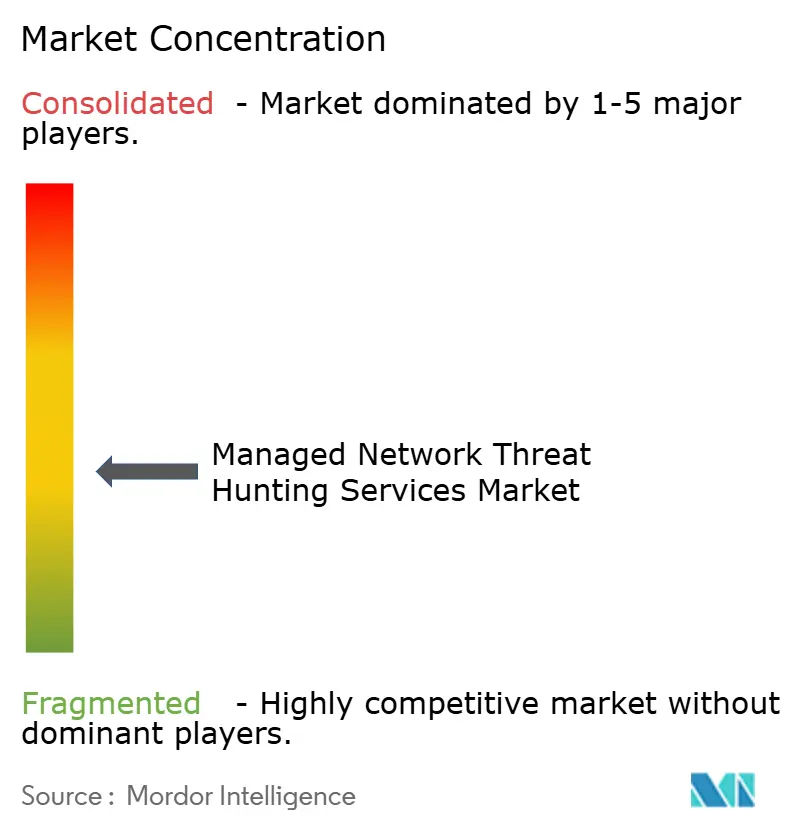
The managed network threat-hunting services market is moderately fragmented, with competition spanning network detection and response specialists, broad XDR providers, and MSSPs that integrate multiple telemetry sources. Platform vendors are putting pressure on standalone specialists by including hunting capabilities in broader subscriptions, so specialists must differentiate themselves through OT expertise, analytical methods, and third-party integrations. Sophos completed its USD 859 million acquisition of Secureworks in February 2025, adding Taegis XDR capabilities, vulnerability detection and response, identity threat detection, and approximately 350 tool integrations. Arctic Wolf completed its USD 160 million acquisition of Cylance in February 2025, adding endpoint security capability to its portfolio.
Consolidation is intended to bring the data layer and human investigation capability under the same provider. ReliaQuest raised more than USD 500 million in March 2025 at a USD 3.4 billion valuation to support international expansion and the automation of security operations. The company positions its GreyMatter platform as a way to work across more than 200 security tools. Arctic Wolf's 2025 AWS collaboration also signals competition around cloud telemetry integration and normalized security data. These moves can improve retention because they reduce disconnected tools, but they can also intensify price competition where core monitoring becomes easier to standardize.
Open opportunities remain in OT-native hunting for air-gapped and sovereign settings. Providers also have room to deliver combined identity and network analysis at budgets suitable for smaller organizations. Regulated sectors outside BFSI need documentation that maps service activity to their compliance obligations. The Open Cybersecurity Schema Framework may make telemetry normalization more consistent across cloud, SaaS, and on-premises environments. That can shorten onboarding but may reduce differentiation in standardized service tiers.
Managed Network Threat Hunting Services Industry Leaders
-
CrowdStrike Holdings, Inc.
-
Arctic Wolf Networks, Inc.
-
Sophos Limited
-
Rapid7, Inc.
-
eSentire, Inc.
- *Disclaimer: Major Players sorted in no particular order
Managed Network Threat Hunting Services Market Companies Covered in this Report
- CrowdStrike Holdings, Inc.
- Arctic Wolf Networks, Inc.
- Sophos Limited
- Rapid7, Inc.
- eSentire, Inc.
- Palo Alto Networks, Inc.
- Cisco Systems, Inc.
- IBM Corporation
- Fortinet, Inc.
- SentinelOne, Inc.
- Red Canary, Inc.
- Expel, Inc.
- Bitdefender SRL
- Deepwatch, Inc.
- Critical Start, Inc.
- Binary Defense Systems, Inc.
- Kroll, LLC
- LevelBlue, Inc.
- ESET, spol. s r.o.
- Trend Micro Incorporated
- Darktrace Holdings plc
- Vectra AI, Inc.
- ExtraHop Networks, Inc.
- ReliaQuest Holdings, LLC
Recent Industry Developments in Managed Network Threat Hunting Services Market
- October 2026: CrowdStrike's OverWatch threat hunting platform reported AI agent-triggered detection leads growing at 2.5 times the rate of human-triggered leads across the twelve-month reporting period, reflecting accelerating agentic AI integration into production hunting workflows and signaling a structural shift in analyst-to-automation workload ratios across managed services globally.
- August 2026: CrowdStrike released the 2026 Threat Hunting Report, documenting a 171% surge in cloud-conscious eCrime activity and a 15x increase in monthly device-code phishing attempts in 1H 2026, providing the adversary intelligence baseline that managed hunting providers use to calibrate detection hypothesis libraries and prioritize telemetry investment priorities.
- April 2026: Nomios launched Guardian xMDR in the European market, a fully managed detection and response service built on Palo Alto Networks Cortex XDR, delivered from a Dutch SOC with transparent tier-based pricing, addressing growing enterprise demand for sovereignty-aware managed hunting across the Benelux and broader European market.
- March 2026: LevelBlue and SentinelOne announced an expanded strategic global partnership combining SentinelOne's Purple AI and Singularity Platform with LevelBlue's Indigo security platform, with LevelBlue named a preferred global provider for managed detection and response and managed SIEM, creating a unified AI-driven operations model targeting dwell time reduction at enterprise scale.
Global Managed Network Threat Hunting Services Market Report Scope
The Managed Network Threat Hunting Services Market comprises outsourced, 24/7 security services in which specialized providers proactively search network traffic, flow data, and network telemetry to detect advanced threats such as APTs, lateral movement, data exfiltration, encrypted tunnel abuse, and command-and-control activity that evade automated prevention and traditional monitoring.
The Managed Network Threat Hunting Services Market Report is Segmented by Service Model (Fully Managed Threat Hunting, Co-Managed Threat Hunting, Hybrid Managed Threat Hunting, Incident-Driven Threat Hunting, and Continuous Threat Hunting), Deployment (Cloud-Based, On-Premises, Hybrid Cloud, and Air-Gapped and Sovereign Environments), Organization Size (Large Enterprises and Small and Medium-Sized Enterprises), Network and Telemetry Scope (Physical Enterprise Networks, Cloud and SaaS Networks, Operational Technology and Industrial Control Systems, Software-Defined and Virtual Networks, and Identity, Endpoint and Network Cross-Domain Telemetry), Industry Vertical (Banking, Financial Services and Insurance, Government and Defense, Energy and Utilities, Information Technology and Telecommunications, Healthcare and Life Sciences, Manufacturing, and Other Industry Verticals), and Geography (North America, South America, Europe, Asia-Pacific, and Middle East and Africa). The Market Forecasts Are Provided in Terms of Value (USD).
Segmentation Overview
| Fully Managed Threat Hunting |
| Co-Managed Threat Hunting |
| Hybrid Managed Threat Hunting |
| Incident-Driven Threat Hunting |
| Continuous Threat Hunting |
| Cloud-Based |
| On-Premises |
| Hybrid Cloud |
| Air-Gapped and Sovereign Environments |
| Large Enterprises |
| Small and Medium-Sized Enterprises |
| Physical Enterprise Networks |
| Cloud and SaaS Networks |
| Operational Technology and Industrial Control Systems |
| Software-Defined and Virtual Networks |
| Identity, Endpoint and Network Cross-Domain Telemetry |
| Banking, Financial Services and Insurance |
| Government and Defense |
| Energy and Utilities |
| Information Technology and Telecommunications |
| Healthcare and Life Sciences |
| Manufacturing |
| Other Industry Verticals |
| North America | United States |
| Canada | |
| Mexico | |
| South America | Brazil |
| Argentina | |
| Rest of South America | |
| Europe | Germany |
| United Kingdom | |
| France | |
| Italy | |
| Rest of Europe | |
| Asia-Pacific | China |
| Japan | |
| India | |
| South Korea | |
| Rest of Asia-Pacific | |
| Middle East and Africa | Saudi Arabia |
| United Arab Emirates | |
| South Africa | |
| Egypt | |
| Rest of Middle East and Africa |
| By Service Model | Fully Managed Threat Hunting | |
| Co-Managed Threat Hunting | ||
| Hybrid Managed Threat Hunting | ||
| Incident-Driven Threat Hunting | ||
| Continuous Threat Hunting | ||
| By Deployment | Cloud-Based | |
| On-Premises | ||
| Hybrid Cloud | ||
| Air-Gapped and Sovereign Environments | ||
| By Organization Size | Large Enterprises | |
| Small and Medium-Sized Enterprises | ||
| By Network and Telemetry Scope | Physical Enterprise Networks | |
| Cloud and SaaS Networks | ||
| Operational Technology and Industrial Control Systems | ||
| Software-Defined and Virtual Networks | ||
| Identity, Endpoint and Network Cross-Domain Telemetry | ||
| By Industry Vertical | Banking, Financial Services and Insurance | |
| Government and Defense | ||
| Energy and Utilities | ||
| Information Technology and Telecommunications | ||
| Healthcare and Life Sciences | ||
| Manufacturing | ||
| Other Industry Verticals | ||
| By Geography | North America | United States |
| Canada | ||
| Mexico | ||
| South America | Brazil | |
| Argentina | ||
| Rest of South America | ||
| Europe | Germany | |
| United Kingdom | ||
| France | ||
| Italy | ||
| Rest of Europe | ||
| Asia-Pacific | China | |
| Japan | ||
| India | ||
| South Korea | ||
| Rest of Asia-Pacific | ||
| Middle East and Africa | Saudi Arabia | |
| United Arab Emirates | ||
| South Africa | ||
| Egypt | ||
| Rest of Middle East and Africa | ||
Key Questions Answered in the Report
What is the managed network threat hunting services market size?
The managed network threat hunting services market is valued at USD 3.44 billion in 2026 and is projected to reach USD 6.43 billion by 2032, at an 11.57% CAGR.
Which region is expected to expand fastest?
Asia-Pacific is projected to expand at a 12.14% CAGR through 2032, supported by digitalization, compliance requirements, and talent shortages.
What is driving demand for managed network threat hunting services?
Faster intrusions, cloud and SaaS exposure, specialist talent shortages, and continuous monitoring requirements are increasing demand.
Which service model has the largest share?
Fully managed delivery leads with a 33.21% share in 2026, as buyers transfer operations and specialized investigation to providers.
Which deployment model leads managed threat hunting services?
Cloud-based delivery leads with a 41.27% share in 2026 and is projected to expand at an 11.83% CAGR through 2032.
Which end-use vertical is expanding fastest?
Manufacturing is projected to expand at a 12.33% CAGR through 2032 as IT and OT networks become more interconnected.