
Managed IT License Optimization Services Market Size and Share
Market Overview
| Study Period | 2021 - 2032 |
|---|---|
| Market Size (2027) | USD 5.51 Billion |
| Market Size (2032) | USD 8.81 Billion |
| Growth Rate (2027 - 2032) | 12.38 % |
| Fastest Growing Market | Asia-Pacific |
| Largest Market | North America |
| Market Concentration | Medium |
Major Players *Disclaimer: Major Players sorted in no particular order Image © Mordor Intelligence. Reuse requires attribution under CC BY 4.0. | |
Managed IT License Optimization Services Market Analysis by Mordor Intelligence
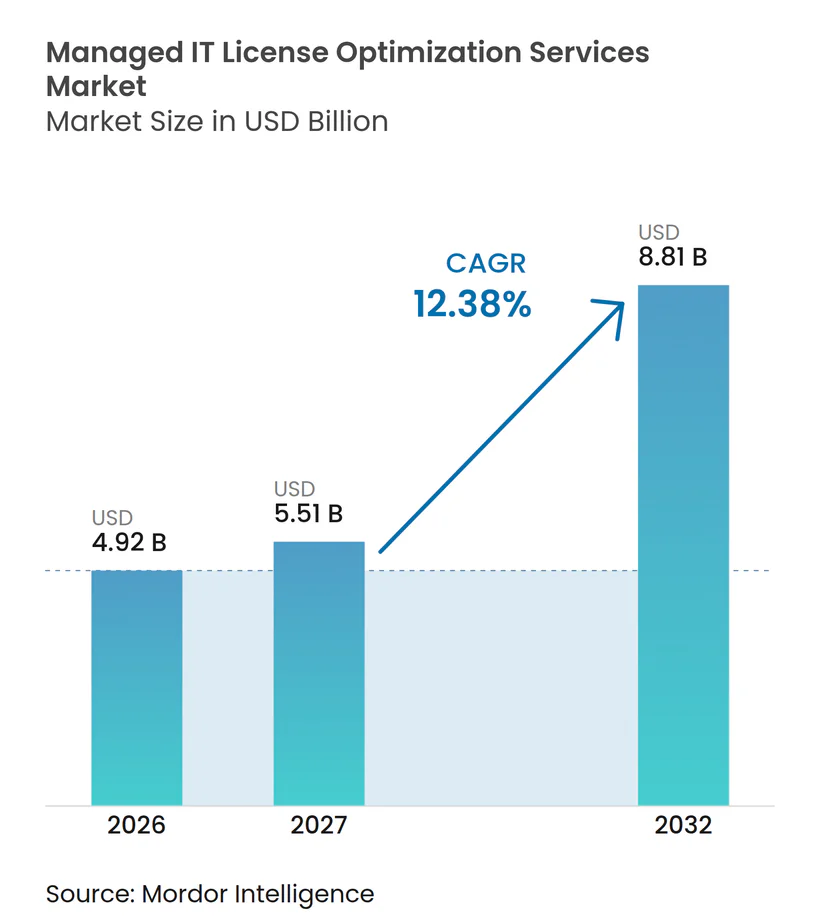
The managed IT license optimization services market size is projected to expand from USD 4.92 billion in 2026 and USD 5.53 billion in 2027 to USD 8.81 billion by 2032, registering a CAGR of 12.38% between 2027 to 2032. The managed IT license optimization services market is supported by the difficulty of tracking use rights across cloud, SaaS, and on-premises environments, especially when separate business units acquire software through different procurement channels and deploy it without a central inventory. Software publishers are changing commercial models while increasing scrutiny of customer deployments, which places more weight on accurate entitlement records, contract interpretation, timely renewals, and an understanding of whether current technical configurations remain compliant. The managed IT license optimization services market also benefits as FinOps teams take on SaaS and software licensing responsibilities alongside cloud spending and need a common view of usage data, spend commitments, and contract renewal dates. AI and consumption-based software pricing make budget planning harder because costs no longer depend only on named user seats and can change with workload behavior, token use, and the provision of new AI features. Providers that combine audit readiness, renewal support, data-led cost controls, and publisher-specific knowledge can address a wider share of enterprise software spending and help customers make earlier decisions before a contract, audit, or pricing change creates pressure.
Key Report Takeaways
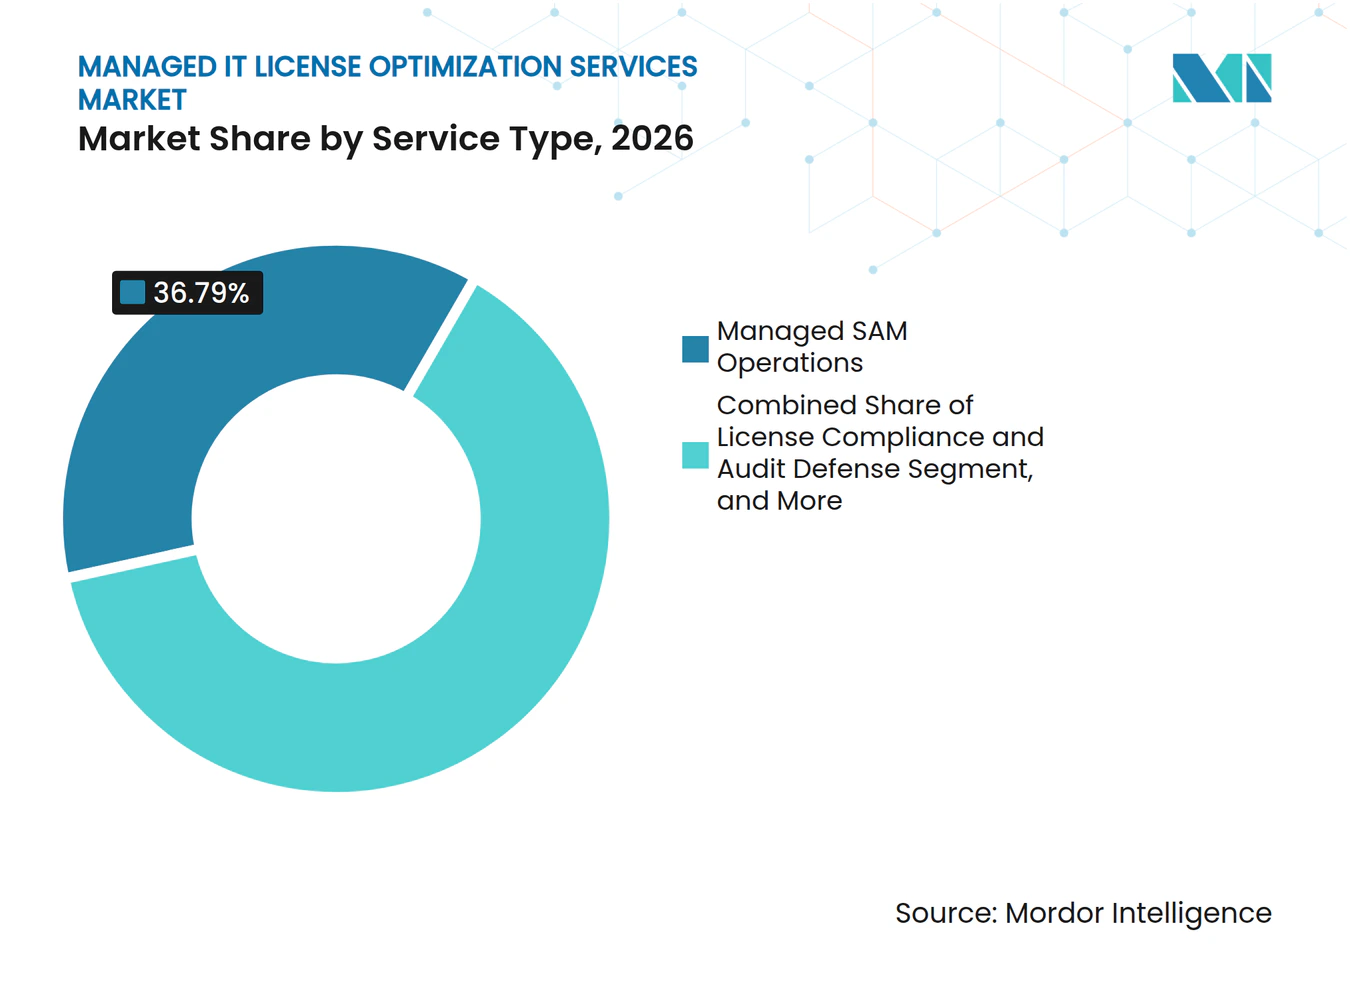
- By service type, Managed SAM Operations held 36.79% of the managed IT license optimization services market share in 2026, while License Optimization and Renewal Management is projected to expand at a 13.92% CAGR through 2032.
- By delivery model, Fully Managed Services held 47.97% revenue share in the managed IT license optimization services market in 2026 and is projected to expand at a 13.67% CAGR through 2032.
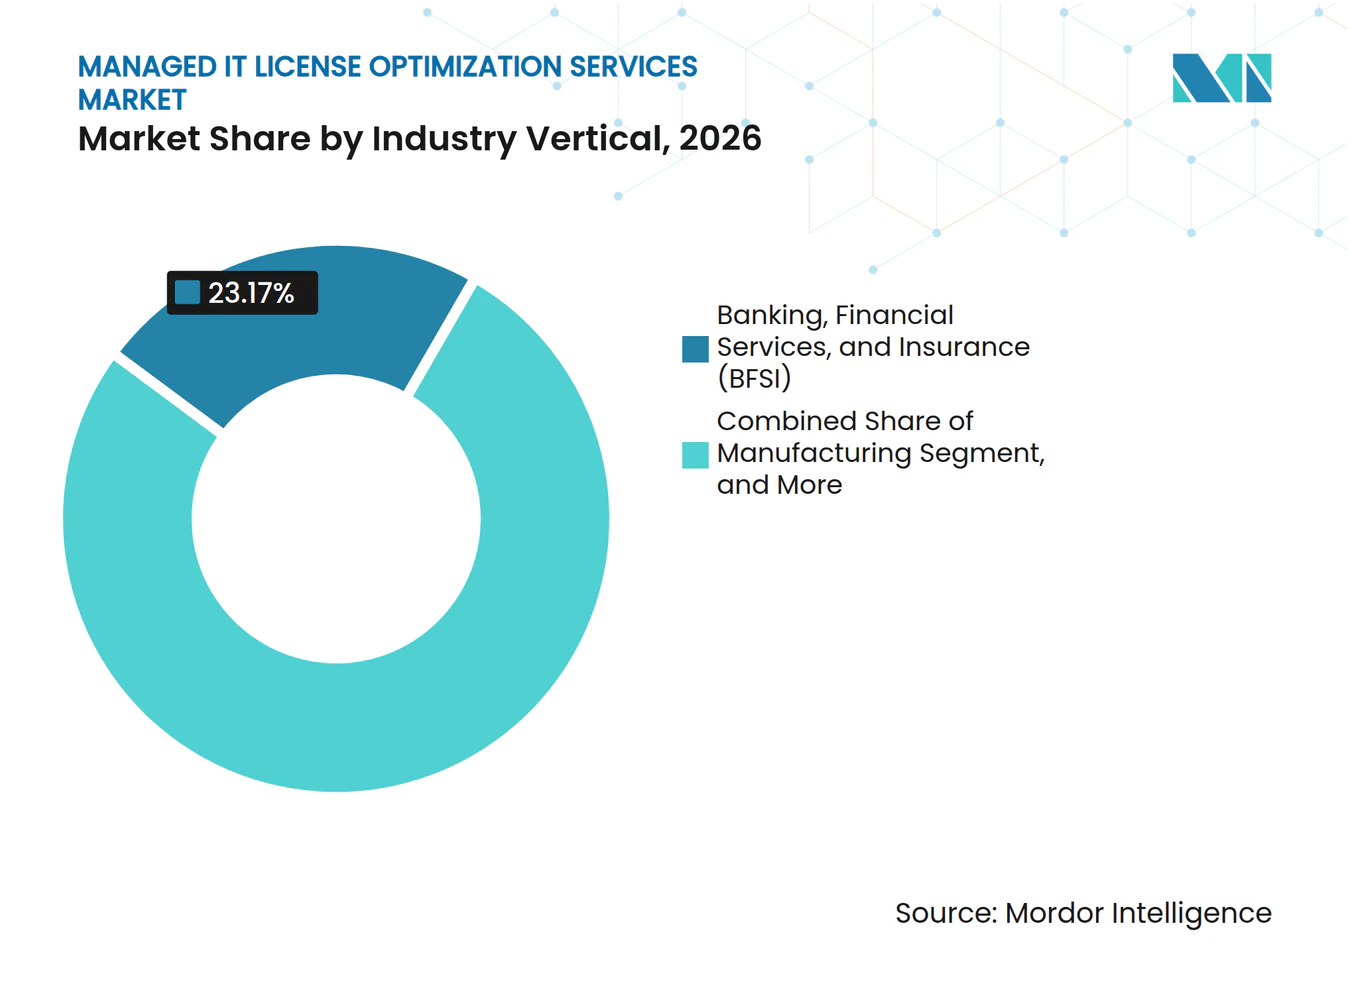
- By industry vertical, BFSI held 23.17% revenue share in 2026, while IT and IT-Enabled Services is projected to expand at a 13.81% CAGR through 2032.
- By geography, North America held 43.51% revenue share in 2026, while Asia-Pacific is projected to expand at a 13.71% CAGR through 2032.
Note: Market numbers in this report are based on Mordor Intelligence's proprietary estimation framework, which combines nine months of actuals with Q4 projections for base year 2026.
Market Trends and Insights
Drivers Impact Analysis of Managed IT License Optimization Services Market*
| Driver | (~) % Impact on CAGR Forecast | Geographic Relevance | Impact Timeline |
|---|---|---|---|
| Increasing Software Licensing Complexity | +3.2% | Global | Short term (≤ 2 years) |
| Expansion of SaaS, Cloud, and Multisourced IT Environments | +2.8% | Global, with North America and Europe as primary markets | Medium term (2-4 years) |
| Rising Financial Accountability for Technology Spend | +2.1% | North America and Europe, with Asia-Pacific gaining | Medium term (2-4 years) |
| Shortage of In-House SAM and FinOps Expertise | +1.8% | Global, most acute in North America and Asia-Pacific | Medium term (2-4 years) |
| AI, API, and Usage-Based Licensing Models | +1.6% | Global, with North America and Asia-Pacific leading adoption | Medium term (2-4 years) |
| Decentralized SaaS Buying and Shadow Procurement | +1.3% | Global | Short term (≤ 2 years) |
| Source: Mordor Intelligence | |||
Increasing Software Licensing Complexity
Software publishers are changing pricing structures during contract periods and are continuing audit activity, creating work that many internal IT teams cannot manage alone. Software use rights became the leading concern for software asset management teams in 2025 after moving 5 places from the prior year, reflecting the move to cloud licensing and hybrid infrastructure.[1] The FFIEC IT Examination Handbook requires financial institutions to maintain records for licenses, agreements, and copyright protection, which makes reliable records a governance issue rather than an administrative task. Virtual machines, containers, and AI-enabled products can change how a license is counted within the same software estate. The managed IT license optimization services market therefore has an opening where organizations need a current view of entitlements, usage, contract boundaries, and the evidence needed to explain a position to a publisher. Publisher-specific knowledge is particularly important when a customer lacks the usage data needed to challenge an audit position or assess whether a proposed settlement follows the relevant contract terms.
Expansion Of SaaS, Cloud, And Multisourced IT Environments
SaaS portfolios can now create more licensing exposure than many traditional on-premises environments because buying and provisioning happen across many business units. Zylo reported SaaS spend of USD 4,830 per employee in 2025, with a 21.9% year-over-year increase, while unused or underused SaaS licenses generated an average annual waste figure of USD 21 million per organization.[2] This creates demand in the managed IT license optimization services market for discovery, entitlement matching, and retirement of unused applications. Dormant installations and automatically provisioned cloud tenants can still produce an audit issue if their status is not verified. The FinOps Foundation reported that 98% of FinOps practitioners manage AI spending in 2026, compared with 63% in 2025, showing how quickly cost management is extending into new workload types. Service providers can make SaaS, cloud, and AI spending more manageable when they join license data with financial governance processes, then use that combined record to support renewal decisions and accountability across decentralized buyers.
Rising Financial Accountability For Technology Spend
Technology leaders are under greater pressure to connect software costs with defined business value and to explain unexpected charges. This pressure changes the role of license management from record keeping to a continuing control over budgets, renewals, and vendor commitments. The FinOps Foundation found that 78% of FinOps functions report into the CTO or CIO organization in 2026, an increase of 18 percentage points from 2023.[3] That reporting structure makes collaboration between engineering, procurement, finance, and software asset teams more necessary because each function holds part of the information needed for a sound commercial decision. Zylo found that 66.5% of IT leaders had unexpected SaaS charges from consumption-based or AI pricing models in 2025. The managed IT license optimization services market can benefit when enterprises seek external support to build a clearer link between demand, usage, renewal spending, and the business owner responsible for each application.
Shortage Of In-House SAM And FinOps Expertise
Demand for skills that combine financial governance, cloud operations, and publisher licensing rules is difficult for many organizations to meet internally. Fewer than 30,000 professionals held the FinOps Certified Practitioner credential worldwide in mid-2026, while more than 80,000 open roles referenced FinOps skills. The gap is material because software asset management and FinOps staff need knowledge of contracts, infrastructure, usage measurement, procurement practices, and the different rules set by major publishers. This shortage supports the managed IT license optimization services market because a managed provider can apply specialist teams across several clients instead of requiring every enterprise to build the same scarce capability. Providers also have reason to automate repetitive discovery, normalization, and analysis work to limit the effect of higher talent costs. External delivery is likely to remain attractive where internal teams cannot develop publisher-specific capability quickly enough or retain people with both technical and commercial expertise.
Restraints Impact Analysis of Managed IT License Optimization Services Market*
| Restraint | (~) % Impact on CAGR Forecast | Geographic Relevance | Impact Timeline |
|---|---|---|---|
| High Implementation and Data-Remediation Costs | -1.5% | Global | Medium term (2-4 years) |
| Complex and Country-Specific Licensing Rules | -1.2% | Global, with particular friction in Europe and Asia-Pacific | Long term (≥ 4 years) |
| Privacy Constraints on User-Level License Telemetry | -0.8% | Europe and Asia-Pacific | Medium term (2-4 years) |
| Opaque Bundled Entitlements and Publisher Data Asymmetry | -0.7% | Global | Medium term (2-4 years) |
| Source: Mordor Intelligence | |||
High Implementation and Data-Remediation Costs
A dependable software asset inventory needs discovery tools, normalized data, systems integration, and remediation of deployments that do not match records. These early requirements can exceed the budget of mid-sized organizations and can delay their decision to use a managed service. Legacy enterprise resource planning records, disconnected procurement data, and fragmented IT environments increase the work needed before savings can be verified. The managed IT license optimization services market faces a slower sales cycle when a prospective client needs to repair data foundations before optimization can begin. Some providers are using AI-supported data normalization in the initial phase to shorten the path from discovery to action. However, building that capability requires investment and can favor providers with stronger financial and technical resources, while clients still need time to validate the quality of the underlying inventory.
Complex And Country-Specific Licensing Rules
Licensing terms can differ by country, deployment type, virtualization method, processor architecture, and the terms of an individual contract. The lack of a common global standard means providers must maintain local expertise and cannot apply one delivery model to every customer. The European Union's Digital Operational Resilience Act has applied since January 2025 and requires financial entities to strengthen management of information and communication technology risk, including third-party arrangements. Article 30 requires contracts for ICT services to cover matters including service descriptions, data location, audit rights, and termination provisions. ISO/IEC 19770-1 offers a recognized framework for IT asset management systems, but adoption differs by geography and organization. These conditions raise delivery costs and create a barrier for the managed IT license optimization services market in jurisdictions with strict data sovereignty and contract requirements, particularly when a multinational customer expects consistent reporting across several national operations.
*Our forecasts treat driver/restraint impacts as directional, not additive. The impact forecasts reflect baseline growth, mix effects, and variable interactions.
Managed IT License Optimization Services Market Segment Analysis
By Service Type:
Continuous Operations Support Demand While Renewal Advice ExpandsManaged SAM Operations held 36.79% of revenue in 2026. The service covers recurring discovery, data normalization, entitlement tracking, and management of software positions by publisher. Large enterprises need this continuity because a gap between audit cycles can leave a license position outdated. Flexera reported that Microsoft had audited 50% of surveyed organizations during the most recent 3-year period, IBM had audited 37%, and SAP increased audit volume in 2025. These conditions make specialist support valuable where complex product rules are difficult to sustain internally.
License Optimization and Renewal Management is projected to expand at a 13.92% CAGR through 2032. Microsoft has moved toward Copilot Credits, while ServiceNow introduced Foundation, Advanced, and Prime tiers in April 2026. The managed IT license optimization services market size for this service is supported by the need to review pricing, usage commitments, and entitlement options before renewal. Providers with independent records of comparable transactions can advise buyers without relying only on vendor-issued data. Tooling-agnostic advice can matter to buyers that want to avoid incentives tied to platform resale.



By Delivery Model:
Fully Managed Services Center Client Demand On OutcomesFully Managed Services accounted for 47.97% of delivery-model revenue in 2026. The provider is accountable for license position accuracy, audit readiness, and progress against renewal objectives. This model suits organizations that have limited specialist talent or that want a single operating owner for a large software estate. It can reduce the effort of coordinating procurement, finance, security, and technology teams. Automated anomaly detection, entitlement mapping, and renewal forecasting can support consistent service quality across several publishers.
Fully Managed Services is projected to expand at a 13.67% CAGR through 2032. Co-Managed Services suit organizations with established SAM teams that need tools, benchmarks, or specialist expertise. Project-Based and On-Demand Services often address immediate audit defense or a review before a cloud migration. These short assignments can develop into longer managed engagements. Clients can be reluctant to change providers because a new provider must recreate data links, entitlement baselines, and publisher relationships.
By Industry Vertical:
Regulated BFSI Demand Coexists With Rapid IT Services AdoptionBFSI accounted for 23.17% of revenue in 2026. Financial institutions often operate Oracle, IBM, SAP, and Microsoft environments across mainframe, virtualized, cloud, and SaaS configurations. Their large software commitments and formal control requirements can make them frequent targets for detailed licensing reviews. The FFIEC's guidance reinforces the importance of auditable records for US financial institutions. DORA also makes ICT third-party oversight a defined obligation for relevant financial entities in the European Union.
IT and IT-Enabled Services is projected to expand at a 13.81% CAGR through 2032. Technology firms maintain large and complex software portfolios while building products and services on licensed infrastructure. Healthcare and life sciences organizations need to assess application estates after mergers, especially when systems process patient data under HIPAA requirements. Manufacturing is shifting computer-aided design, simulation, and product lifecycle management tools toward subscriptions and concurrent-use models. Government agencies may need central license records as the SAMOSA Act seeks federal inventory and consolidation of software licenses.

Geography Analysis
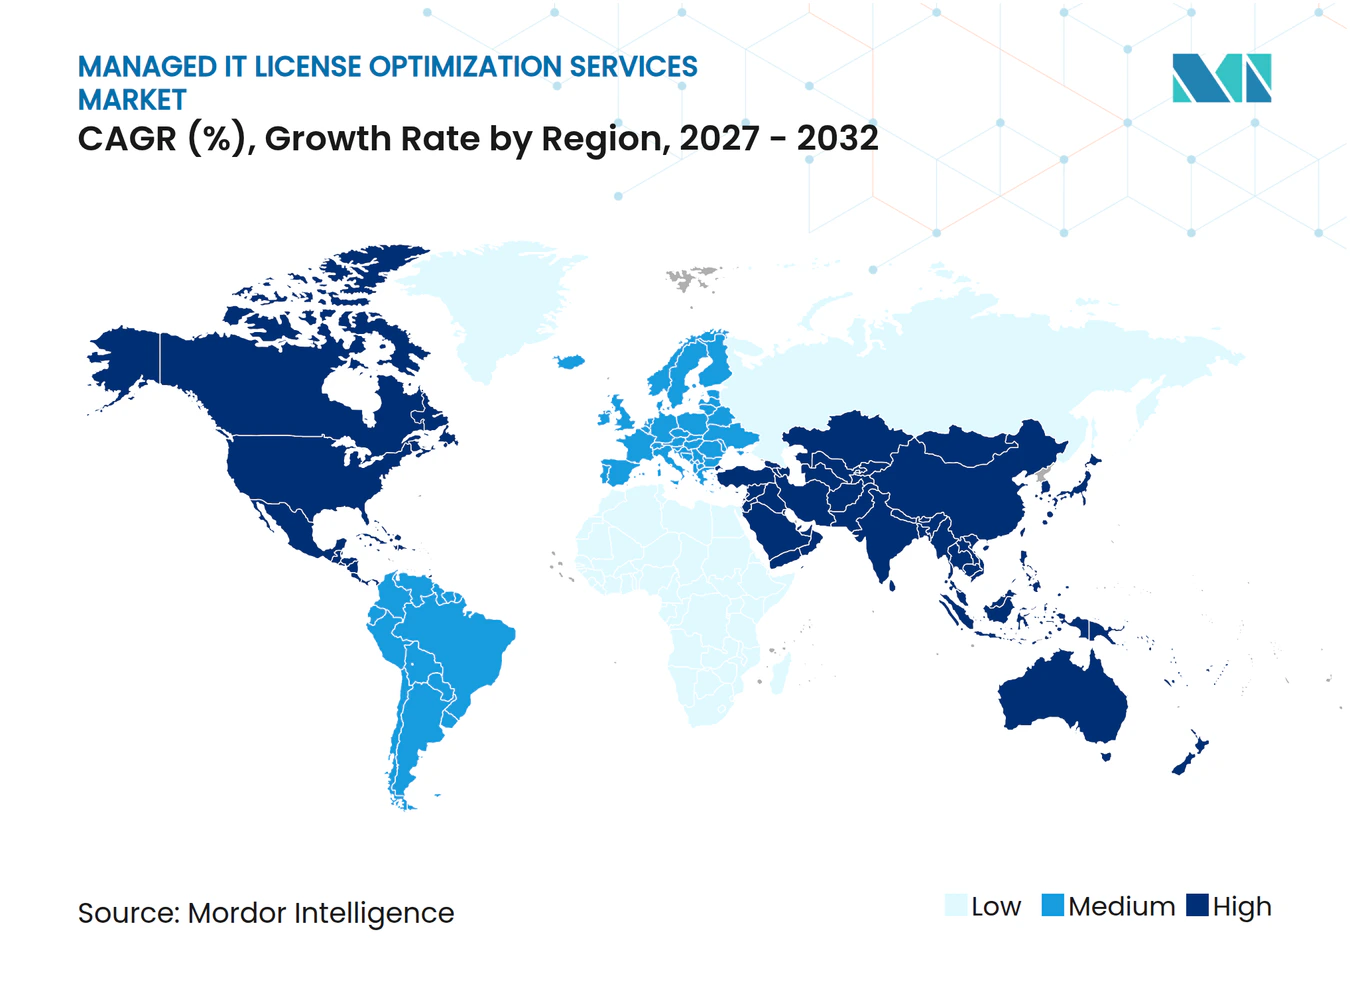
North America held 43.51% of the managed IT license optimization services market share in 2026. The region has a high concentration of financial services, healthcare, IT services, and advanced manufacturing organizations with complex, multi-publisher environments. Flexera found that more than 70% of US IT leaders believed business units were acquiring more cloud and SaaS services than IT knew about in 2026, while 85% saw visibility gaps as an organizational risk. HIPAA, SOX, and FFIEC guidance shape compliance expectations, while providers are investing in AI-supported delivery and subscription overlap detection.
Asia-Pacific is projected to expand at a 13.71% CAGR through 2032. Fast cloud adoption combines with a comparatively low baseline of formal SAM governance in many regional markets. India's Digital Personal Data Protection Act and China's Cybersecurity Law create compliance needs that increase the importance of asset visibility and locally adapted support. ServiceNow and Lenovo expanded their strategic agreement in May 2026 across Australia, New Zealand, Hong Kong, Singapore, and Ireland, showing continued investment in regionally supported enterprise service delivery. India is building formal SAM practices, while South Korea and Singapore have more mature demand from financial services and telecommunications users.
Europe is the third-largest geography in the managed IT license optimization services market. DORA and the General Data Protection Regulation have moved software asset visibility closer to a compliance function for financial institutions and organizations that process personal data. South America is led by Brazil, where SaaS adoption among mid-sized enterprises is rising and LGPD compliance supports a more formal approach to license governance. Saudi Arabia and the United Arab Emirates are creating demand through national digitization programs, while South Africa, Nigeria, and Egypt remain early-stage opportunities that often begin with project-based audit defense.
Competitive Landscape
Market Concentration
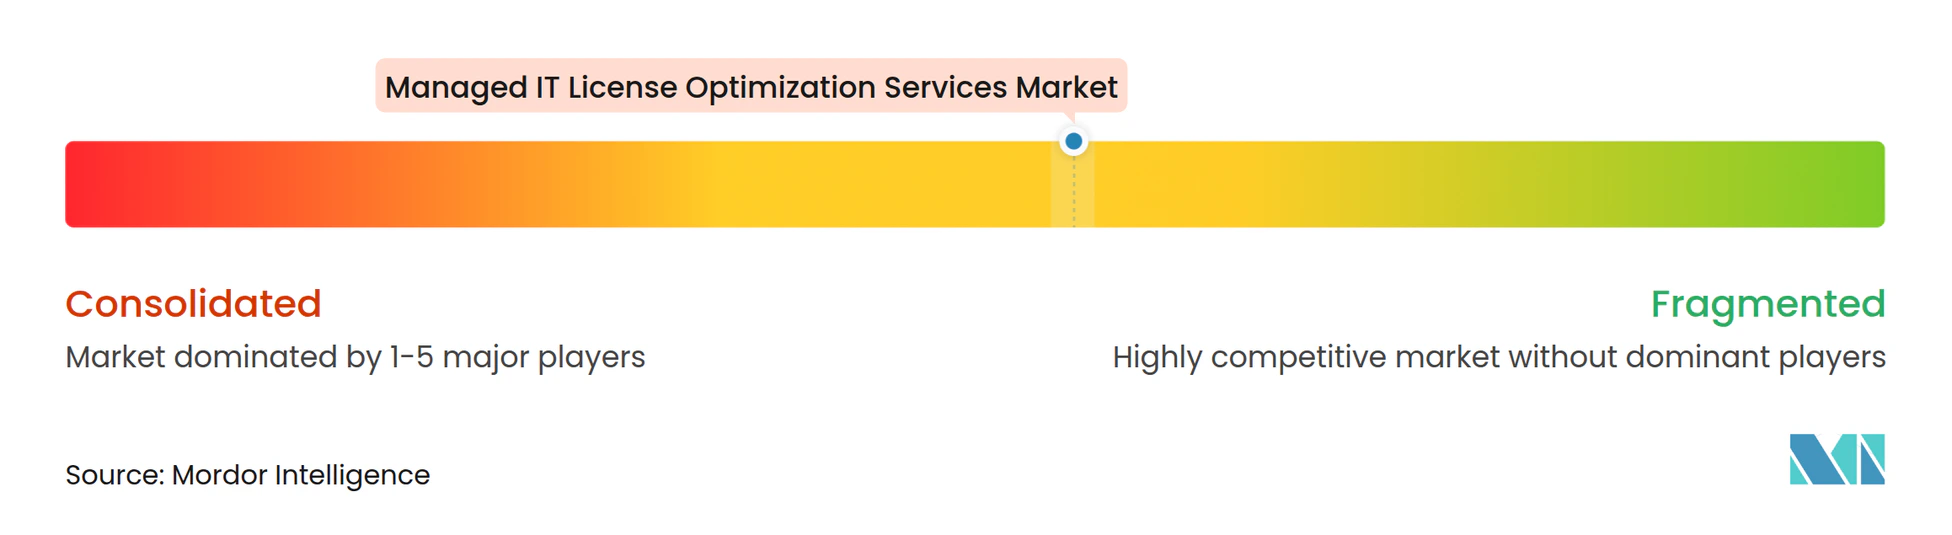
Flexera, ServiceNow, and SoftwareOne hold prominent positions in the managed IT license optimization services market because they combine broad platforms with strong software publisher ecosystems. SoftwareOne completed its acquisition of Crayon in July 2025, forming a larger software and cloud solutions provider with an expanded advisory base. Specialist firms such as Anglepoint, Certero, and Eracent compete on deep knowledge of particular publishers and licensing rules. Providers that connect SaaS subscriptions, cloud costs, and on-premises licenses can offer a wider governance model than those focused on one spending category.
ServiceNow changed its licensing model in April 2026 with Foundation, Advanced, and Prime AI-focused tiers, creating new questions around bundled capabilities and token-based consumption. Flexera's May 2026 update added full-stack AI cost management and subscription overlap detection for ServiceNow licensing. Zylo introduced Clarity AI and Model Context Protocol capabilities in May 2026 to automate software and AI spending workflows. Zylo also launched agentic SaaS management capabilities in October 2026 for discovery, renewals, and license reclamation. ISO/IEC 19770 remains an important quality reference for providers that want to demonstrate reliable IT asset management practices.
The mid-market is a material opening because many organizations face complex licensing rules but cannot support an enterprise-scale fully managed contract. Standardized, technology-led delivery can make discovery, data cleanup, and renewal support more accessible to these buyers. AI spend governance is another open area because token use, inference costs, and agent-level consumption do not fit older per-seat license models. The managed IT license optimization services market remains competitively mixed because large platforms, global providers, and specialists each address different buyer requirements.
Managed IT License Optimization Services Industry Leaders
-
SoftwareOne Holding AG
-
Flexera Software LLC
-
Accenture plc
-
Anglepoint Group, Inc.
-
ServiceNow, Inc.
- *Disclaimer: Major Players sorted in no particular order
Managed IT License Optimization Services Market Companies Covered in this Report
- Flexera Software LLC
- ServiceNow, Inc.
- USU Ventures AG, formerly USU Software AG
- SoftwareOne Holding AG
- Anglepoint Group, Inc.
- Livingstone Technologies Limited
- Certero Limited
- Eracent, Inc.
- License Dashboard Limited
- Licenseware Technology Services S.R.L.
- Open iT, Inc.
- OpenLM Ltd.
- Lansweeper NV
- Matrix42 AG
- Ivanti, Inc.
- Oomnitza, Inc.
- Zylo, Inc.
- Zluri Technologies, Inc.
- Torii, Inc.
- Productiv, Inc.
- BetterCloud, Inc.
- Augmentt Technologies Inc.
Recent Industry Developments in Managed IT License Optimization Services Market
- October 2026: Infotech completed the acquisition of Bengaluru-based Zluri Technologies, Inc., a SaaS management and identity governance and administration provider backed by Lightspeed and MassMutual Ventures. The acquisition gives Zluri access to Infotech's global community of over 30,000 IT leaders, accelerating its expansion and marking Infotech's first acquisition in 30 years.
- October 2026: SoftwareOne and Crayon completed the integration of their channel businesses across Asia-Pacific under the SoftwareOne brand, consolidating complementary expertise across SAM, cloud, cybersecurity, data and AI, and managed and technical services into a single Asia-Pacific channel business with broader geographic scale and vendor relationships.
- October 2026: Zylo launched its agentic SaaS management platform, introducing Model Context Protocol integration and AI-native workflows designed to automate software discovery, renewal management, and license reclamation without requiring manual intervention at the application level. The company simultaneously reported that AI-native software spend surged 334% across its managed portfolio.
- May 2026: Zylo launched Zylo Clarity AI and Model Context Protocol, embedding a decade of SaaS spend benchmark data into agentic optimization workflows that enable enterprises to automate renewal negotiations, flag high-risk expensed applications, and reallocate underutilized licenses at scale.
Global Managed IT License Optimization Services Market Report Scope
The Managed IT License Optimization Services Market refers to the industry focused on outsourced services that help organizations maximize the value, compliance, and cost efficiency of their software licensing portfolios across on-premise, cloud, and hybrid IT environments.
The Managed IT License Optimization Services Market Report is Segmented by Service Type (Managed SAM Operations, License Compliance and Audit Defense, License Optimization and Renewal Management, Advisory, Implementation, and Tooling Services), Delivery Model (Fully Managed Services, Co-Managed Services, Project-Based and On-Demand Services), Industry Vertical (Banking, Financial Services, and Insurance (BFSI), Information Technology and IT-Enabled Services, Telecommunications, Manufacturing, Healthcare and Life Sciences, Government and Public Sector, Other Industry Verticals), and Geography (North America [United States, Canada, Mexico], South America [Brazil, Argentina, Colombia, Rest of South America], Europe [United Kingdom, Germany, France, Italy, Spain, Rest of Europe], Asia-Pacific [China, Japan, India, Singapore, Australia, South Korea, Rest of Asia-Pacific], Middle East [Saudi Arabia, United Arab Emirates, Israel, Turkey, Rest of Middle East], Africa [South Africa, Nigeria, Egypt, Rest of Africa]). The Market Forecasts are Provided in Terms of Value (USD).
Segmentation Overview
| Managed SAM Operations |
| License Compliance and Audit Defense |
| License Optimization and Renewal Management |
| Advisory, Implementation, and Tooling Services |
| Fully Managed Services |
| Co-Managed Services |
| Project-Based and On-Demand Services |
| Banking, Financial Services, and Insurance (BFSI) |
| Information Technology and IT-Enabled Services |
| Telecommunications |
| Manufacturing |
| Healthcare and Life Sciences |
| Government and Public Sector |
| Other Industry Verticals |
| North America | United States |
| Canada | |
| Mexico | |
| South America | Brazil |
| Argentina | |
| Colombia | |
| Rest of South America | |
| Europe | United Kingdom |
| Germany | |
| France | |
| Italy | |
| Spain | |
| Rest of Europe | |
| Asia-Pacific | China |
| Japan | |
| India | |
| Singapore | |
| Australia | |
| South Korea | |
| Rest of Asia-Pacific | |
| Middle East | Saudi Arabia |
| United Arab Emirates | |
| Israel | |
| Turkey | |
| Rest of Middle East | |
| Africa | South Africa |
| Nigeria | |
| Egypt | |
| Rest of Africa |
| By Service Type | Managed SAM Operations | |
| License Compliance and Audit Defense | ||
| License Optimization and Renewal Management | ||
| Advisory, Implementation, and Tooling Services | ||
| By Delivery Model | Fully Managed Services | |
| Co-Managed Services | ||
| Project-Based and On-Demand Services | ||
| By Industry Vertical | Banking, Financial Services, and Insurance (BFSI) | |
| Information Technology and IT-Enabled Services | ||
| Telecommunications | ||
| Manufacturing | ||
| Healthcare and Life Sciences | ||
| Government and Public Sector | ||
| Other Industry Verticals | ||
| By Geography | North America | United States |
| Canada | ||
| Mexico | ||
| South America | Brazil | |
| Argentina | ||
| Colombia | ||
| Rest of South America | ||
| Europe | United Kingdom | |
| Germany | ||
| France | ||
| Italy | ||
| Spain | ||
| Rest of Europe | ||
| Asia-Pacific | China | |
| Japan | ||
| India | ||
| Singapore | ||
| Australia | ||
| South Korea | ||
| Rest of Asia-Pacific | ||
| Middle East | Saudi Arabia | |
| United Arab Emirates | ||
| Israel | ||
| Turkey | ||
| Rest of Middle East | ||
| Africa | South Africa | |
| Nigeria | ||
| Egypt | ||
| Rest of Africa | ||
Key Questions Answered in the Report
What is the 2026 size of the managed IT license optimization services market?
The managed IT license optimization services market was valued at USD 4.92 billion in 2026 and is projected to reach USD 8.81 billion by 2032. The forecast reflects a 12.38% CAGR from 2027 to 2032 as companies seek greater control over software use rights, renewals, and compliance records.
Which service type has the highest projected expansion rate?
License Optimization and Renewal Management is projected to expand at a 13.92% CAGR through 2032. The service responds to pricing changes, changing usage commitments, and the need for independent support before a complex software renewal is finalized.
Why do enterprises use fully managed license optimization services?
Fully managed engagements place responsibility for license accuracy, audit readiness, and renewal objectives with a specialist provider. They are useful when an organization wants one accountable operating owner instead of coordinating separate internal procurement, finance, security, and IT teams.
Which end-user sector leads adoption?
BFSI held 23.17% revenue share in 2026 because it operates complex software estates under formal control and compliance requirements. Financial institutions often need auditable records across mainframe, virtualized, cloud, and SaaS deployments that support regulated business operations.
Which region is projected to expand fastest?
Asia-Pacific is projected to expand at a 13.71% CAGR through 2032 as cloud adoption and formal software governance advance. Regional demand is also shaped by data-protection expectations, local delivery needs, and more sophisticated software estates in financial services and telecommunications.
Which region is projected to expand fastest?
Asia-Pacific is projected to expand at a 13.71% CAGR through 2032 as cloud adoption and formal software governance advance. Regional demand is also shaped by data-protection expectations, local delivery needs, and more sophisticated software estates in financial services, technology services, telecommunications, and large multinational operations.