
Managed FinOps Services Market Size and Share
Market Overview
| Study Period | 2021 - 2032 |
|---|---|
| Market Size (2027) | USD 1.30 Billion |
| Market Size (2032) | USD 2.88 Billion |
| Growth Rate (2027 - 2032) | 17.21 % |
| Fastest Growing Market | Asia-Pacific |
| Largest Market | North America |
| Market Concentration | Medium |
Major Players *Disclaimer: Major Players sorted in no particular order Image © Mordor Intelligence. Reuse requires attribution under CC BY 4.0. | |
Managed FinOps Services Market Analysis by Mordor Intelligence
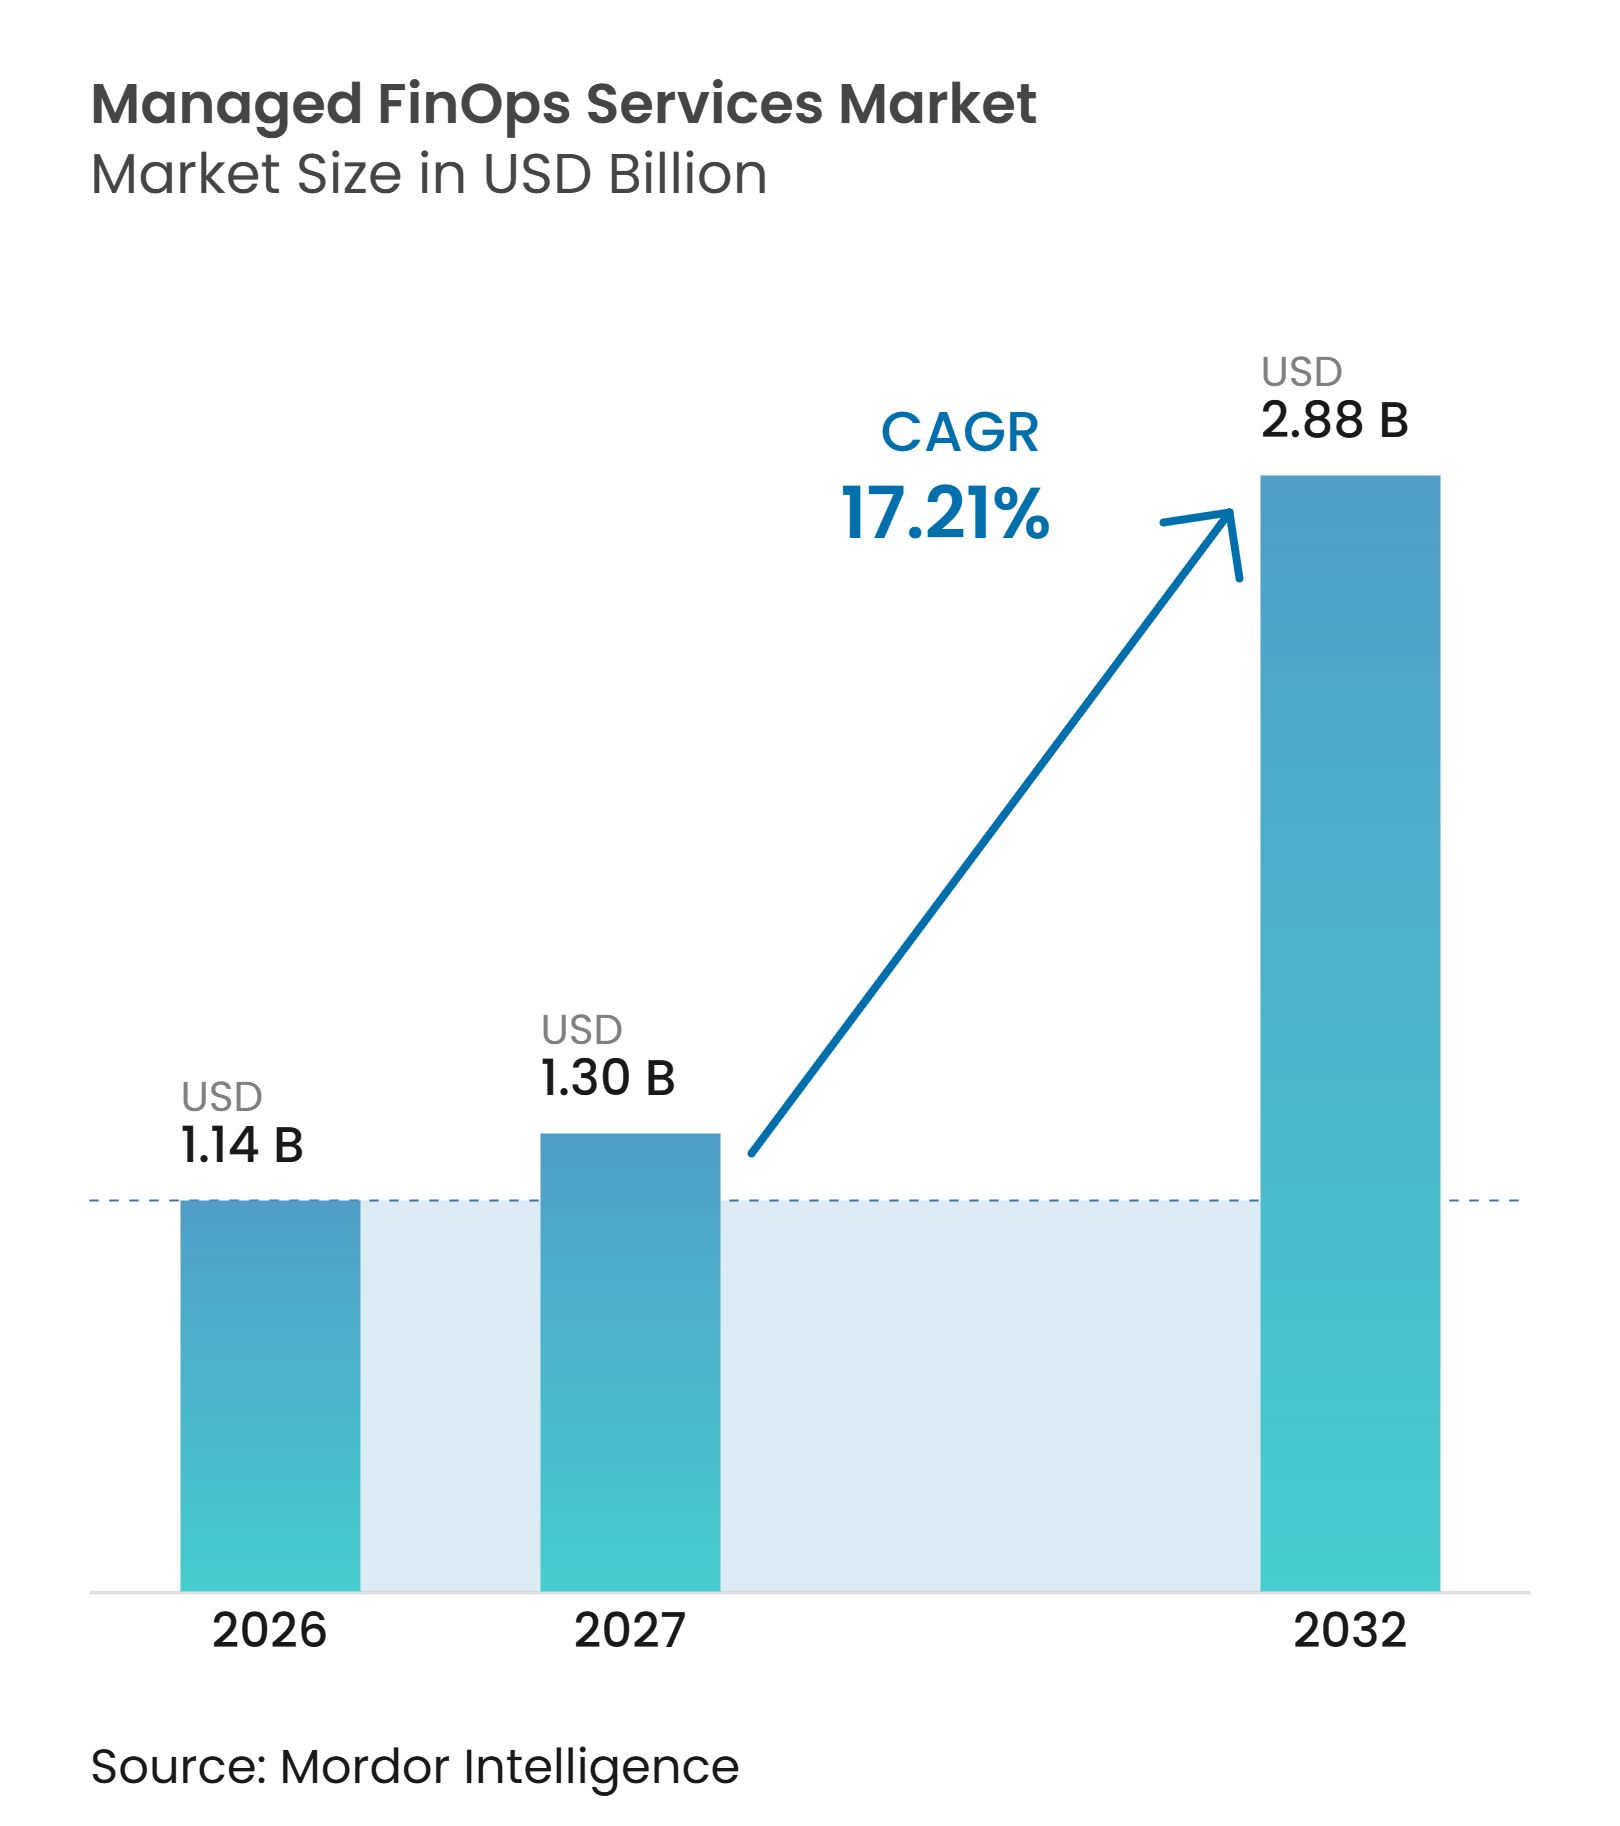
The managed FinOps services market size is projected to expand from USD 1.14 billion in 2026 to USD 2.88 billion by 2032, registering a CAGR of 17.21% between 2027 and 2032. The managed FinOps services market is supported by the need to govern costs across multi-cloud estates, AI workloads, and consumption-based data platforms, where usage, pricing, and allocation decisions can change quickly. Organizations increasingly need continuous cost allocation, anomaly response, commitment management, and business reporting rather than periodic spending reviews that leave responsibility divided among finance, engineering, procurement, and business teams. This increases the role of providers that combine financial operations expertise with cloud engineering and governance support, particularly when internal teams have limited time to coordinate technical and commercial actions. Competition is moving beyond basic reporting toward services that link cost decisions with workload performance, business-unit accountability, executive oversight, and clear evidence of savings or avoided expenditure. Native cloud cost tools remain a constraint for lower-complexity work, but they also make advanced optimization, AI cost governance, data-platform management, and outcome-based engagements more important for managed providers operating in the managed FinOps services market across complex enterprise technology estates, operating models, and changing internal priorities with growing and varied operational needs.
Key Report Takeaways
- By service type, Managed Cost Visibility and Allocation held 24.81% of the managed FinOps services market share in 2026, while Managed AI and Data-Platform Cost Operations is projected to expand at a 27.14% CAGR through 2032.
- By delivery model, Fully Managed FinOps Services held 59.24% of revenue in 2026, while Co-Managed FinOps Services is projected to expand at a 19.36% CAGR through 2032.
- By organization size, Large Enterprises held 70.24% of revenue in 2026, while SMEs are projected to expand at a 21.39% CAGR through 2032.
- By end-user industry, Information Technology and Telecommunications held 28.62% of revenue in 2026, while Healthcare and Life Sciences are projected to expand at a 21.48% CAGR through 2032.
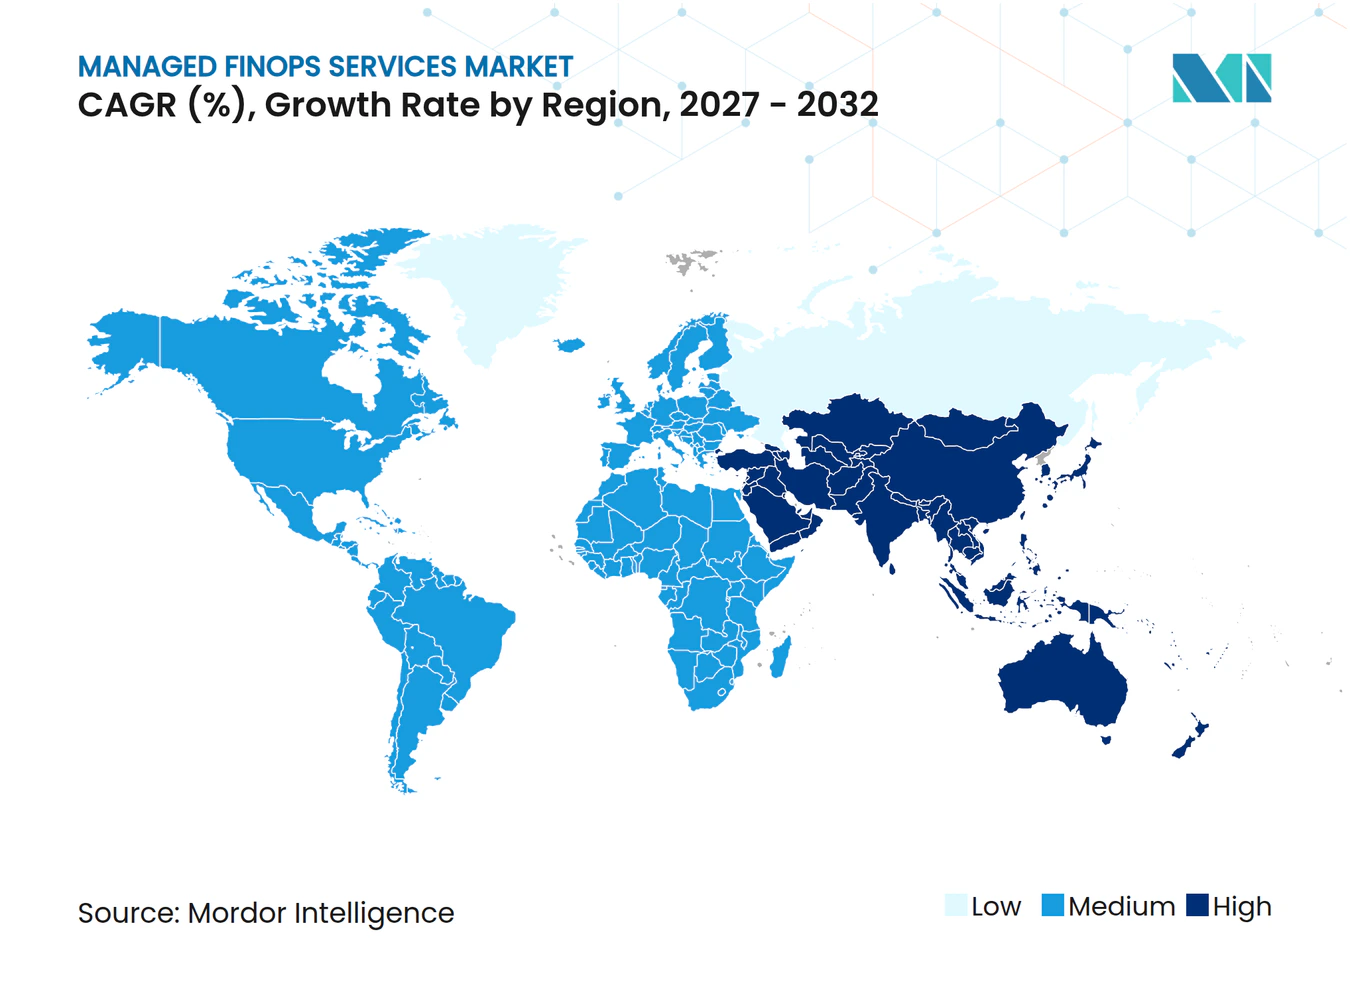
- By geography, North America held 39.27% of revenue in 2026, while Asia-Pacific is projected to expand at a 21.43% CAGR through 2032.
Note: Market numbers in this report are based on Mordor Intelligence's proprietary estimation framework, which combines nine months of actuals with Q4 projections for base year 2026.
Market Trends and Insights
Drivers Impact Analysis of Managed FinOps Services Market*
| Driver | (~) % Impact on CAGR Forecast | Geographic Relevance | Impact Timeline |
|---|---|---|---|
| Expanding Multi-Cloud and Hybrid Cloud Complexity | +4.2% | Global, concentrated in North America and Europe | Medium term (2-4 years) |
| Enterprise Demand for Continuous Cloud Cost Optimization | +3.8% | Global, strongest in North America and Asia-Pacific | Short term (≤ 2 years) |
| Growing AI and Data-Platform Consumption | +3.5% | Global, North America, and Asia-Pacific lead AI infrastructure investment | Long term (≥ 4 years) |
| Shortage of Cross-Functional FinOps Talent | +2.1% | Global, acute shortfalls in the Asia-Pacific and South America | Medium term (2-4 years) |
| Standardization Through FOCUS Cost and Usage Data | +1.4% | Global, North America, and Europe are early adoption centers | Medium term (2-4 years) |
| Outsourced Execution of High-Frequency Optimization Decisions | +1.2% | Global, highest impact in SME segments across all regions | Short term (≤ 2 years) |
| Source: Mordor Intelligence | |||
Expanding Multi-Cloud and Hybrid Cloud Complexity
The managed FinOps services market benefits when cloud environments expand more quickly than internal governance processes. Organizations using several cloud providers must reconcile different billing structures, discount terms, tagging practices, and allocation rules before they can act on cost data. This work becomes more demanding when teams also use private infrastructure and SaaS services alongside public cloud workloads. FOCUS 1.4 added invoice-reconciliation datasets and new data fields that support more consistent billing data across providers.[1] The standard improves a common foundation for reporting, but organizations still need operational support to establish reliable data, allocation rules, and decision processes. The managed FinOps services market, therefore, retains a role where companies need normalized information and continuous execution across a broad technology estate.
Enterprise Demand for Continuous Cloud Cost Optimization
Cloud bills can change daily as workloads scale, reserved capacity is consumed, and engineering teams release new products, so that the financial position can differ materially from a budget prepared only weeks earlier. A quarterly review may identify a problem after the financial effect has already accumulated and after the relevant technical decision has become harder to reverse. Managed providers can monitor anomalies, guide rightsizing decisions, review commitment coverage, and support remediation in a more regular operating cycle. This structure is useful when internal teams cannot give sustained attention to cloud cost management alongside their engineering and finance responsibilities. The managed FinOps services market is also supported by buyers who want recurring cost accountability without having to build a large specialist team. The service is most compelling when the provider can show that its operational work improves allocation quality, removes idle resources, and supports commercial decisions without disrupting production workloads.
Growing AI and Data-Platform Consumption
AI and data-platform workloads have added spending patterns that are harder to govern with conventional compute and storage controls. The FinOps Foundation reported that 98% of practitioners will manage AI spend in 2026, up from 63% in 2025.[2] Teams must attribute token usage, GPU capacity, model activity, and data platform queries to products, departments, or clients. These requirements extend to platforms such as Snowflake, Databricks, and BigQuery, where workload-level controls affect both performance and expenditure. DoiT acquired SELECT in January 2026 to expand its coverage of data-platform cost optimization, indicating provider interest in this segment of the managed FinOps services market.[3] Managed AI and data platform operations address the gap between basic visibility and the active optimization these specialized workloads require.
Shortage of Cross-Functional FinOps Talent
FinOps work requires cloud engineering knowledge, financial analysis, commercial awareness, and the ability to align multiple business teams with different cost objectives and decision rights. Those capabilities are difficult to combine within a small internal function, especially as cloud spend, AI use, and data platform adoption increase. The FinOps Foundation found that practices are extending their scope across AI, SaaS, licensing, and data-center spending. This wider scope raises the amount of coordination needed for allocation, forecasting, and optimization decisions. A managed service can give an organization access to specialized roles without waiting to recruit and train a full internal team. For the managed FinOps services market, talent constraints favor delivery models that combine provider execution with the customer’s architecture and business knowledge.
Restraints Impact Analysis of Managed FinOps Services Market*
| Restraint | (~) % Impact on CAGR Forecast | Geographic Relevance | Impact Timeline |
|---|---|---|---|
| Preference for In-House Ownership of Sensitive Cost Data | -2.8% | Global, most acute in regulated industries including banking, financial services, insurance, healthcare, and government | Medium term (2-4 years) |
| Commoditization of Basic Visibility and Reporting | -2.1% | Global, the strongest headwind in North America, where native tools are most mature | Short term (≤ 2 years) |
| Ambiguous Boundaries Between Managed FinOps and Cloud Managed Service Provider Services | -1.3% | Global, affects procurement across all regions | Medium term (2-4 years) |
| Customer Concerns Over Optimization Risk and Performance Trade-Offs | -0.8% | North America and Europe, where engineering governance frameworks are most developed | Long term (≥ 4 years) |
| Source: Mordor Intelligence | |||
Preference for In-House Ownership of Sensitive Cost Data
Cost allocation records can include contract terms, application design choices, departmental spending, and commercial commitments. This information is sensitive for regulated organizations and can lead to lengthy security, legal, and architecture reviews before a provider is granted access. Banking, healthcare, and public-sector buyers may also require data residency controls and customer-managed operating environments. These requirements can extend procurement cycles and limit the pace at which providers convert large accounts. Some mature organizations may also conclude that internal delivery is more economical when they only need reporting or limited support. The managed FinOps services market is better positioned where providers can work within client-controlled environments and clearly define the boundaries of their access, authority, and accountability.
Commoditization of Basic Visibility and Reporting
AWS Cost Explorer, Microsoft Cost Management, and Google Cloud cost tools provide budget alerts, anomaly detection, and rightsizing recommendations. These features reduce the need to pay a provider solely for dashboards or initial reporting. FOCUS also reduces the technical difficulty of creating common billing records across providers. As a result, providers that remain at the visibility layer can face pricing pressure and renewal risk. The managed FinOps services market is more resilient when offerings include commitment management, AI cost controls, operational remediation, and governance that links spending with product or business outcomes. Providers must therefore demonstrate work that native tools cannot perform independently, rather than treating access to tools as the core service.
*Our forecasts treat driver/restraint impacts as directional, not additive. The impact forecasts reflect baseline growth, mix effects, and variable interactions.
Managed FinOps Services Market Segment Analysis
By Service Type:
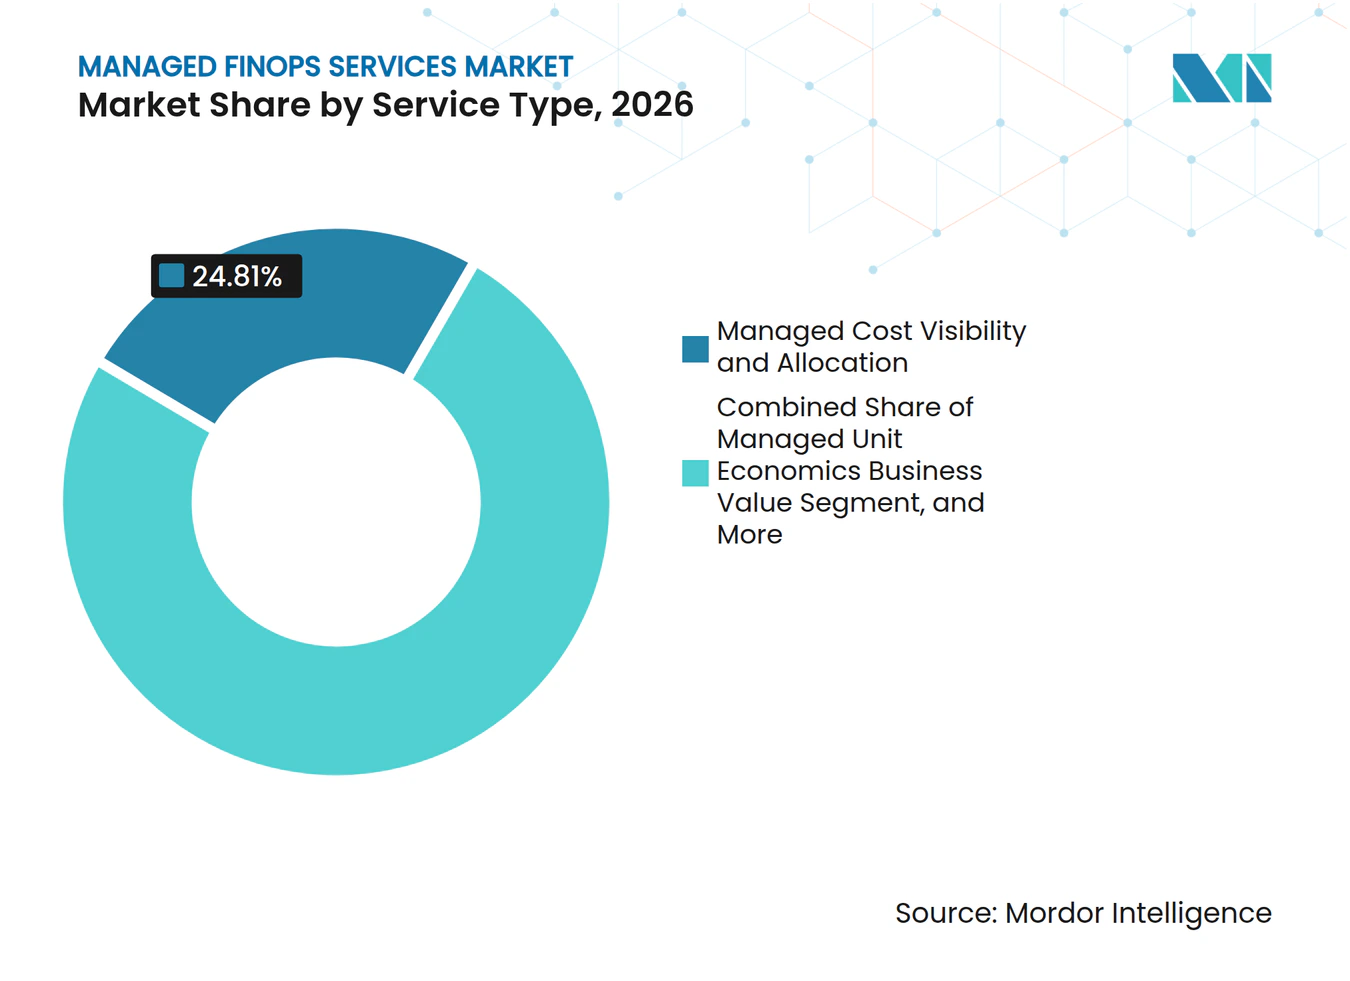
AI Cost Operations Expand the Scope of EngagementsManaged Cost Visibility and Allocation held 24.81% of the managed FinOps services market share in 2026. The service remains widely relevant because organizations need consistent cloud billing data, usable tags, cost allocation rules, and recurring anomaly-management routines across business units, cloud providers, and product teams. It supports chargeback and showback processes that help finance and operating teams understand where spending occurs and decide who owns the response when costs depart from plan. Managed Workload Optimization and Rightsizing addresses underused or misconfigured resources that can increase cloud expenditure without improving performance. Managed Commitment and Rate Optimization focuses on reserved capacity, savings plans, and other commercial arrangements that require careful usage planning.
Managed Governance, Budgeting, and Forecasting supports financial control through budgets, forecasts, policies, and management reporting. Managed Unit Economics and Business Value helps connect infrastructure costs to product use, customer activity, or other operating measures. Managed FinOps Maturity and Continuous Improvement serves organizations that need an operating model and a sustained improvement program. Managed AI and Data-Platform Cost Operations is projected to expand at a 27.14% CAGR through 2032, the fastest rate among service types. The service covers GPU commitment risk, inference-workload rightsizing, token attribution, and workload governance for data platforms. This growth reflects a practical need to manage categories of spending that do not fit neatly within standard compute and storage controls.



By Delivery Model:
Co-Managed Services Reflect Increasing Buyer MaturityFully Managed FinOps Services held 59.24% of the managed FinOps services market size in 2026. This model suits organizations that lack the internal capacity to run continuous cloud cost operations. Providers can manage data ingestion, normalization, anomaly response, optimization workflows, and executive reporting within a defined service scope. It is common among mid-market technology firms and enterprises that have not created an internal FinOps center of excellence or assigned accountability across finance, engineering, and procurement. The model also gives buyers access to specialist skills through a predictable recurring fee.
Co-Managed FinOps Services is projected to expand at a 19.36% CAGR through 2032. Under this arrangement, providers typically handle frequent optimization activities, while customer teams retain decision-making authority over architecture priorities and business-unit engagement. This division can preserve internal ownership while addressing execution constraints. The FinOps Foundation reported that 60% of practices operate with centralized enablement and embedded team champions, while 21% use hub-and-spoke structures. Those organizational arrangements can support a co-managed approach because they require coordination between a central function and distributed teams. The managed FinOps services market can benefit as more buyers progress from complete outsourcing to shared operational responsibility.
By Organization Size:
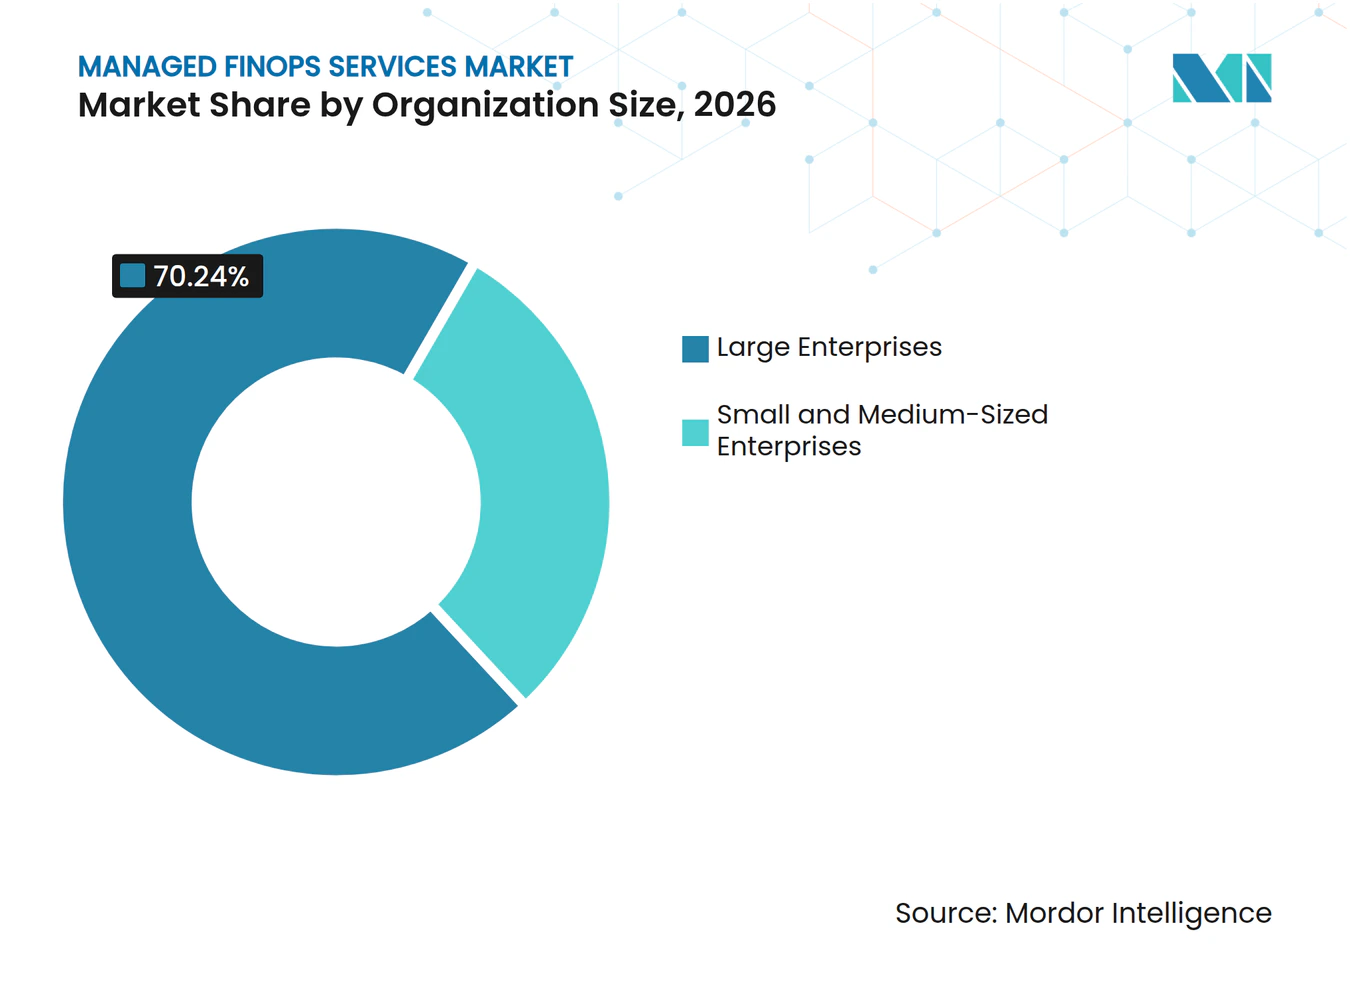
Packaged Offers Broaden SME ParticipationLarge Enterprises held 70.24% of revenue in 2026. These organizations often have multi-cloud estates, several stakeholders, and a larger volume of optimization and governance decisions that must be coordinated across technical, financial, and commercial teams. Their programs can combine commitment management, chargeback, AI cost controls, and reporting for senior leadership. Large contracts can also cover wider implementation and change-management needs. The size of these environments makes external expertise useful even where internal FinOps teams are already established.
SMEs are projected to expand at a 21.39% CAGR through 2032. Packaged service offerings can lower the minimum engagement level for firms that need formal cost governance but cannot justify a large internal team. SaaS-native SMEs, fintech scale-ups, and digital health companies may reach a cloud spend level at which continuous monitoring becomes financially viable. Providers can serve this group through standardized reporting, automated anomaly detection, and commitment management modules. Smaller AI-native companies also need to monitor GPU and token spending before usage becomes difficult to attribute. This gives the managed FinOps services market a path to serve customers with lower absolute spend but growing operational complexity.

By End-User Industry:
Healthcare Adds Compliance-Led DemandInformation Technology and Telecommunications held 28.62% of the managed FinOps services market share in 2026. Technology companies, SaaS providers, and platform businesses typically have cloud-native operations and high infrastructure spending relative to their business activity. They use FinOps services to improve gross-margin discipline as application usage increases and as cost responsibility needs to be shared across product and engineering leaders. Unit economics is particularly relevant because it can link cloud cost to a customer, product, transaction, or service tier. Complex containerized and multi-cloud architectures also increase the need for reliable allocation and optimization.
Healthcare and Life Sciences are projected to expand at a 21.48% CAGR through 2032. Cloud migration for clinical and analytics workloads is increasing the need for cost allocation methods that work with compliance requirements. A regional healthcare insurer with a USD 31 million annual Azure footprint achieved more than USD 10 million in cumulative cloud savings through a multi-year managed program, according to C4 Technical Services.[4] Banking, Financial Services, and Insurance also need detailed multi-account chargeback as cloud migration advances. Retail and E-Commerce use managed services for seasonal demand planning and unit economics tracking. Industrial Manufacturing, Government, and Public Administration remain smaller segments, but their digital programs are increasing the need for accountable cloud spending.
Geography Analysis
North America held 39.27% of the managed FinOps services market share in 2026. The region has a high concentration of cloud-native enterprises and large organizations with mature multi-cloud environments that often require commitment management, AI cost governance, and unit economics capabilities in addition to reporting. The FinOps Foundation reported that 78% of FinOps practices report to the CTO or CIO organization in 2026, which can increase the strategic role of spending decisions.[5] This reporting structure can also make managed services part of technology planning rather than a limited finance activity. Canada drives demand for financial services and energy, while Mexico is earlier in its adoption and is concentrated in manufacturing and retail.
Asia-Pacific is projected to expand at a 21.43% CAGR through 2032, making it the fastest-expanding regional part of the managed FinOps services market. China, India, Japan, Singapore, and Australia are adding enterprise cloud capacity, while India’s audit-ready cloud cost tracking for banks supports demand for structured governance and allocation processes. Japan offers a high-value opportunity as large cloud and AI infrastructure investments add workload density and recurring optimization needs. Alphaus’s Octo became the first FinOps Certified Platform in Japan and Southeast Asia in February 2025. Australia and Singapore also act as centers for early AI FinOps and SaaS governance programs.
Europe is a stable, compliance-led part of the managed FinOps services market, with demand centered on the United Kingdom, Germany, and France, where banking, insurance, and manufacturing organizations use multi-cloud normalization and chargeback capabilities. Germany’s industrial base adds demand for hybrid cloud cost controls that include production systems. South America, led by Brazil and Argentina, remains an emerging region where fully managed services may suit buyers with lower FinOps maturity. The Middle East is supported by digital transformation programs in the United Arab Emirates and Saudi Arabia, while Africa remains at an early stage, with adoption concentrated in financial services and telecommunications in South Africa and Nigeria.
Competitive Landscape
Market Concentration
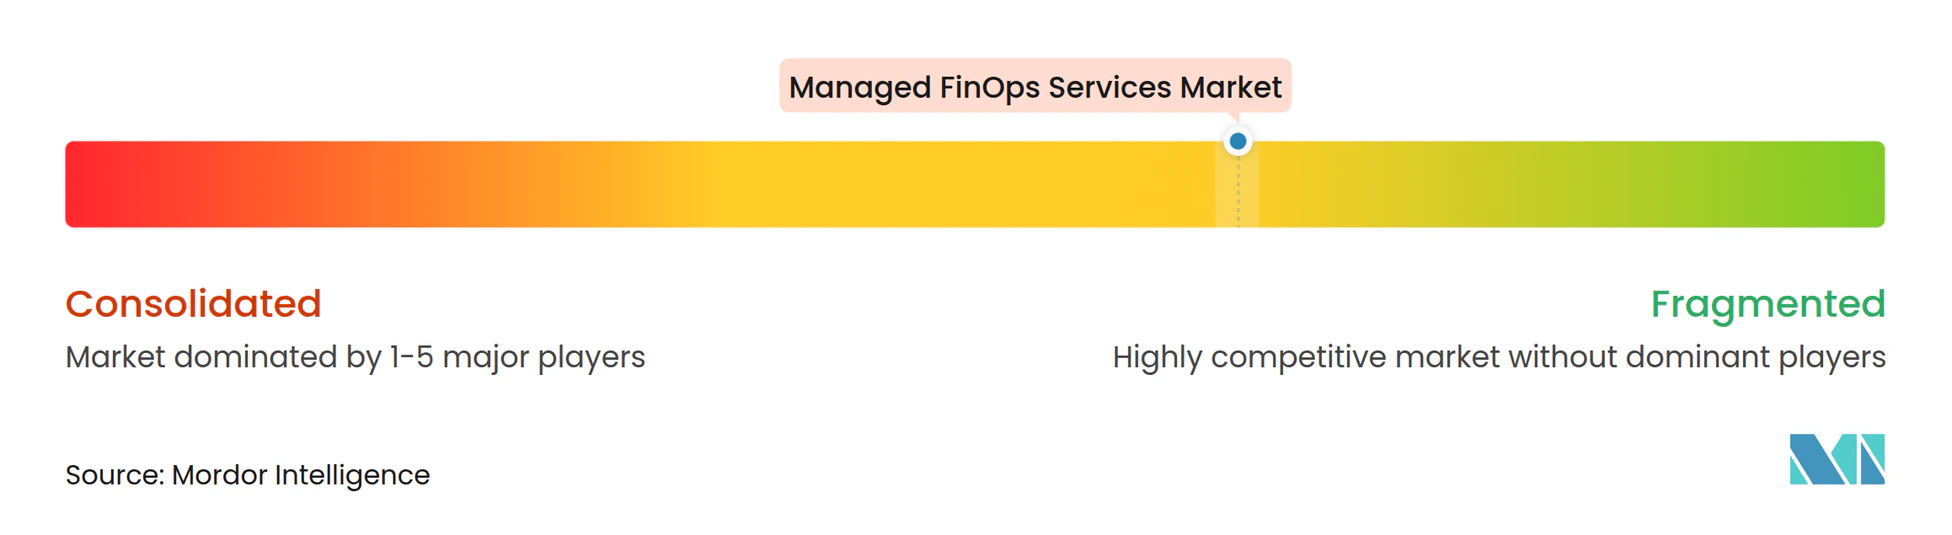
The managed FinOps services market includes pure-play specialists, large advisory firms, and platform-enabled service providers. DoiT International, CloudZero, ProsperOps, CAST AI Group, nOps, Finout, Kion, and Ternary compete through automation, cost allocation, and optimization capabilities. Accenture, Deloitte, and Tata Consultancy Services bundle managed FinOps with broader cloud transformation work. SoftwareOne, CloudBolt Software, Sedai, CoreStack, Virtasant Corporation, and CloudKeeper occupy adjacent service and platform positions. Strategic Blue and Duckbill focus on commitment and rate optimization, where commercial management remains a specialized service area.
Providers are using AI automation to scale managed operations without relying on a proportional increase in staff. DoiT acquired SELECT in January 2026 to add Snowflake cost-optimization capabilities for more than 250 enterprise customers. It also acquired CloudWize in October 2025, combining cloud financial management with security posture and compliance capabilities. Kion released FinOps+ version 3.15 with its Lux AI agent in February 2026, enabling users to manage budgets, analyze spending, and perform governance actions via natural-language prompts.
CloudZero launched a financial control plane for AI spend in May 2026, with cost attribution across models, teams, and projects. ProsperOps made unified autonomous rate and workload optimization generally available in June 2026 and introduced ProsperOps+ as an outcome-based pricing bundle. These actions show that AI cost governance, data-platform optimization, and performance-linked commercial models are important areas of differentiation. The FinOps Foundation’s FOCUS Certified Conformant program can also support provider discussions with buyers that require evidence of billing data quality. Basic reporting is more exposed to competition from native tools, so the managed FinOps services market favors providers that demonstrate measurable operational value across the full cloud cost lifecycle.
Managed FinOps Services Industry Leaders
-
Accenture plc
-
IBM Corporation
-
Tata Consultancy Services Limited
-
Kyndryl Holdings, Inc.
-
HCL Technologies Limited
- *Disclaimer: Major Players sorted in no particular order
Managed FinOps Services Market Companies Covered in this Report
- Accenture plc
- CAST AI Group Inc.
- CloudBolt Software, Inc.
- CloudKeeper
- CloudZero, Inc.
- CoreStack, Inc.
- Deloitte Touche Tohmatsu Limited
- DoiT International
- Finout Ltd.
- HCL Tech
- Kyndryl Holdings, Inc.
- IBM Corporation
- ProsperOps, Inc.
- Sedai, Inc.
- SoftwareOne AG
- Strategic Blue Limited
- Tata Consultancy Services Limited
- Ternary, Inc.
- The Duckbill Group (now Duckbill)
- Virtasant Corporation
Recent Industry Developments in Managed FinOps Services Market
- October 2026: Harness launched AI Budgets within its Cost Management Agent, enabling real-time spend limits and monitoring for AI inference and model API services. The feature directly addresses the gap between AI experimentation and budget-constrained production deployments, where the risk of overspending is highest.
- September 2026: CloudZero launched AI Signals, which attributes AI spending by model, team, and business outcome and alerts finance leaders when AI investment diverges from measurable returns, in response to its own survey finding that 78% of finance executives cannot tie AI spending to business outcomes.
- June 2026: ProsperOps made Unified Autonomous Rate and Workload Optimization generally available at FinOps X 2026, coordinating rate and workload scheduling as a single automated system. ProsperOps+ was simultaneously launched as an outcome-based pricing bundle, a commercial shift toward performance-contingent managed fee structures.
- June 2026: The FinOps Foundation Steering Committee ratified FOCUS 1.4, adding 2 new datasets, BillingPeriod and InvoiceDetail, 47 new columns, 6 new attributes, and 17 glossary entries. The release enables direct invoice reconciliation and cross-provider commitment-eligibility tracking, expanding the specification’s utility for managed-service normalization.
Global Managed FinOps Services Market Report Scope
The Managed FinOps Services Market covers third-party managed services that support the continuous monitoring, governance, optimization, and financial management of enterprise cloud expenditures across public, private, hybrid, and multicloud environments. The market includes Managed FinOps Maturity and Continuous Improvement; Managed Cost Visibility and Allocation; Managed Workload Optimization and Rightsizing; Managed Commitment and Rate Optimization; Managed Governance, Budgeting, and Forecasting; Managed Unit Economics and Business Value; and Managed AI and Data-Platform Cost Operations. These services encompass cloud expenditure monitoring, cost allocation and chargeback, workload rightsizing, resource utilization optimization, reserved capacity and savings plan management, cloud budgeting and forecasting, financial accountability, unit cost analysis, AI infrastructure cost optimization, and continuous FinOps governance. Market revenue includes recurring managed service fees, subscription-based managed operations charges, performance-based optimization fees, and directly associated operational support charges, while excluding standalone FinOps software subscriptions, cloud infrastructure consumption charges, unbundled advisory and consulting engagements, and one-time implementation services not associated with ongoing managed operations.
The Managed FinOps Services Market Report is segmented by Service Type (Managed FinOps Maturity and Continuous Improvement, Managed Cost Visibility and Allocation, Managed Workload Optimization and Rightsizing, Managed Commitment and Rate Optimization, Managed Governance, Budgeting, and Forecasting, Managed Unit Economics and Business Value, and Managed AI and Data-Platform Cost Operations), Delivery Model (Fully Managed FinOps Services and Co-Managed FinOps Services), Organization Size (Large Enterprises and Small and Medium-Sized Enterprises), End-User Industry (Information Technology and Telecommunications; Banking, Financial Services, and Insurance; Retail and E-Commerce; Healthcare and Life Sciences; Industrial Manufacturing; Government and Public Administration; and Other End-User Industries), and Geography (North America, South America, Europe, Asia-Pacific, Middle East, and Africa), with country-level coverage across major markets within each region. Market sizes and forecasts are presented in value terms (USD).
Segmentation Overview
| Managed FinOps Maturity and Continuous Improvement |
| Managed Cost Visibility and Allocation |
| Managed Workload Optimization and Rightsizing |
| Managed Commitment and Rate Optimization |
| Managed Governance, Budgeting, and Forecasting |
| Managed Unit Economics and Business Value |
| Managed AI and Data-Platform Cost Operations |
| Fully Managed FinOps Services |
| Co-Managed FinOps Services |
| Large Enterprises |
| Small and Medium-Sized Enterprises |
| Information Technology and Telecommunications |
| Banking, Financial Services, and Insurance |
| Retail and E-Commerce |
| Healthcare and Life Sciences |
| Industrial Manufacturing |
| Government and Public Administration |
| Other End-User Industries |
| North America | United States |
| Canada | |
| Mexico | |
| South America | Brazil |
| Argentina | |
| Rest of South America | |
| Europe | United Kingdom |
| Germany | |
| France | |
| Russia | |
| Rest of Europe | |
| Asia-Pacific | China |
| India | |
| Japan | |
| Singapore | |
| Australia | |
| Rest of Asia-Pacific | |
| Middle East | United Arab Emirates |
| Saudi Arabia | |
| Rest of Middle East | |
| Africa | South Africa |
| Nigeria | |
| Rest of Africa |
| By Service Type | Managed FinOps Maturity and Continuous Improvement | |
| Managed Cost Visibility and Allocation | ||
| Managed Workload Optimization and Rightsizing | ||
| Managed Commitment and Rate Optimization | ||
| Managed Governance, Budgeting, and Forecasting | ||
| Managed Unit Economics and Business Value | ||
| Managed AI and Data-Platform Cost Operations | ||
| By Delivery Model | Fully Managed FinOps Services | |
| Co-Managed FinOps Services | ||
| By Organization Size | Large Enterprises | |
| Small and Medium-Sized Enterprises | ||
| By End-User Industry | Information Technology and Telecommunications | |
| Banking, Financial Services, and Insurance | ||
| Retail and E-Commerce | ||
| Healthcare and Life Sciences | ||
| Industrial Manufacturing | ||
| Government and Public Administration | ||
| Other End-User Industries | ||
| By Geography | North America | United States |
| Canada | ||
| Mexico | ||
| South America | Brazil | |
| Argentina | ||
| Rest of South America | ||
| Europe | United Kingdom | |
| Germany | ||
| France | ||
| Russia | ||
| Rest of Europe | ||
| Asia-Pacific | China | |
| India | ||
| Japan | ||
| Singapore | ||
| Australia | ||
| Rest of Asia-Pacific | ||
| Middle East | United Arab Emirates | |
| Saudi Arabia | ||
| Rest of Middle East | ||
| Africa | South Africa | |
| Nigeria | ||
| Rest of Africa | ||
Key Questions Answered in the Report
What is the size of the managed FinOps services market?
The managed FinOps services market is valued at USD 1.14 billion in 2026 and is projected to reach USD 2.88 billion by 2032, at a 17.21% CAGR from 2027 to 2032.
Which service type leads managed FinOps services?
Managed Cost Visibility and Allocation leads with 24.81% of 2026 revenue. Managed AI and Data-Platform Cost Operations is projected to record the fastest expansion at a 27.14% CAGR through 2032.
Why are companies using managed FinOps services?
Companies use these services to manage multi-cloud billing, allocation, cost anomalies, commitments, AI spending, and data-platform usage when internal teams lack continuous operational capacity.
Which delivery model is most widely used?
Fully Managed FinOps Services leads with 59.24% of 2026 revenue. Co-Managed FinOps Services is projected to expand at a 19.36% CAGR as buyers retain more internal decision authority.
Which region has the highest managed FinOps demand?
North America leads with 39.27% of 2026 revenue, supported by cloud-native enterprises and complex multi-cloud operations. Asia-Pacific is projected to expand the fastest at a 21.43% CAGR through 2032.
Which end-user sector is expanding fastest?
Healthcare and Life Sciences is projected to expand at a 21.48% CAGR through 2032 as clinical and analytics workloads move to the cloud under strict cost allocation and compliance requirements.