
Managed Data Center Energy Optimization Services Market Size and Share
Market Overview
| Study Period | 2021 - 2032 |
|---|---|
| Market Size (2027) | USD 6.02 Billion |
| Market Size (2032) | USD 12.22 Billion |
| Growth Rate (2027 - 2032) | 15.21 % |
| Fastest Growing Market | North America |
| Largest Market | Middle East and Africa |
| Market Concentration | Medium |
Major Players *Disclaimer: Major Players sorted in no particular order Image © Mordor Intelligence. Reuse requires attribution under CC BY 4.0. | |
Managed Data Center Energy Optimization Services Market Analysis by Mordor Intelligence
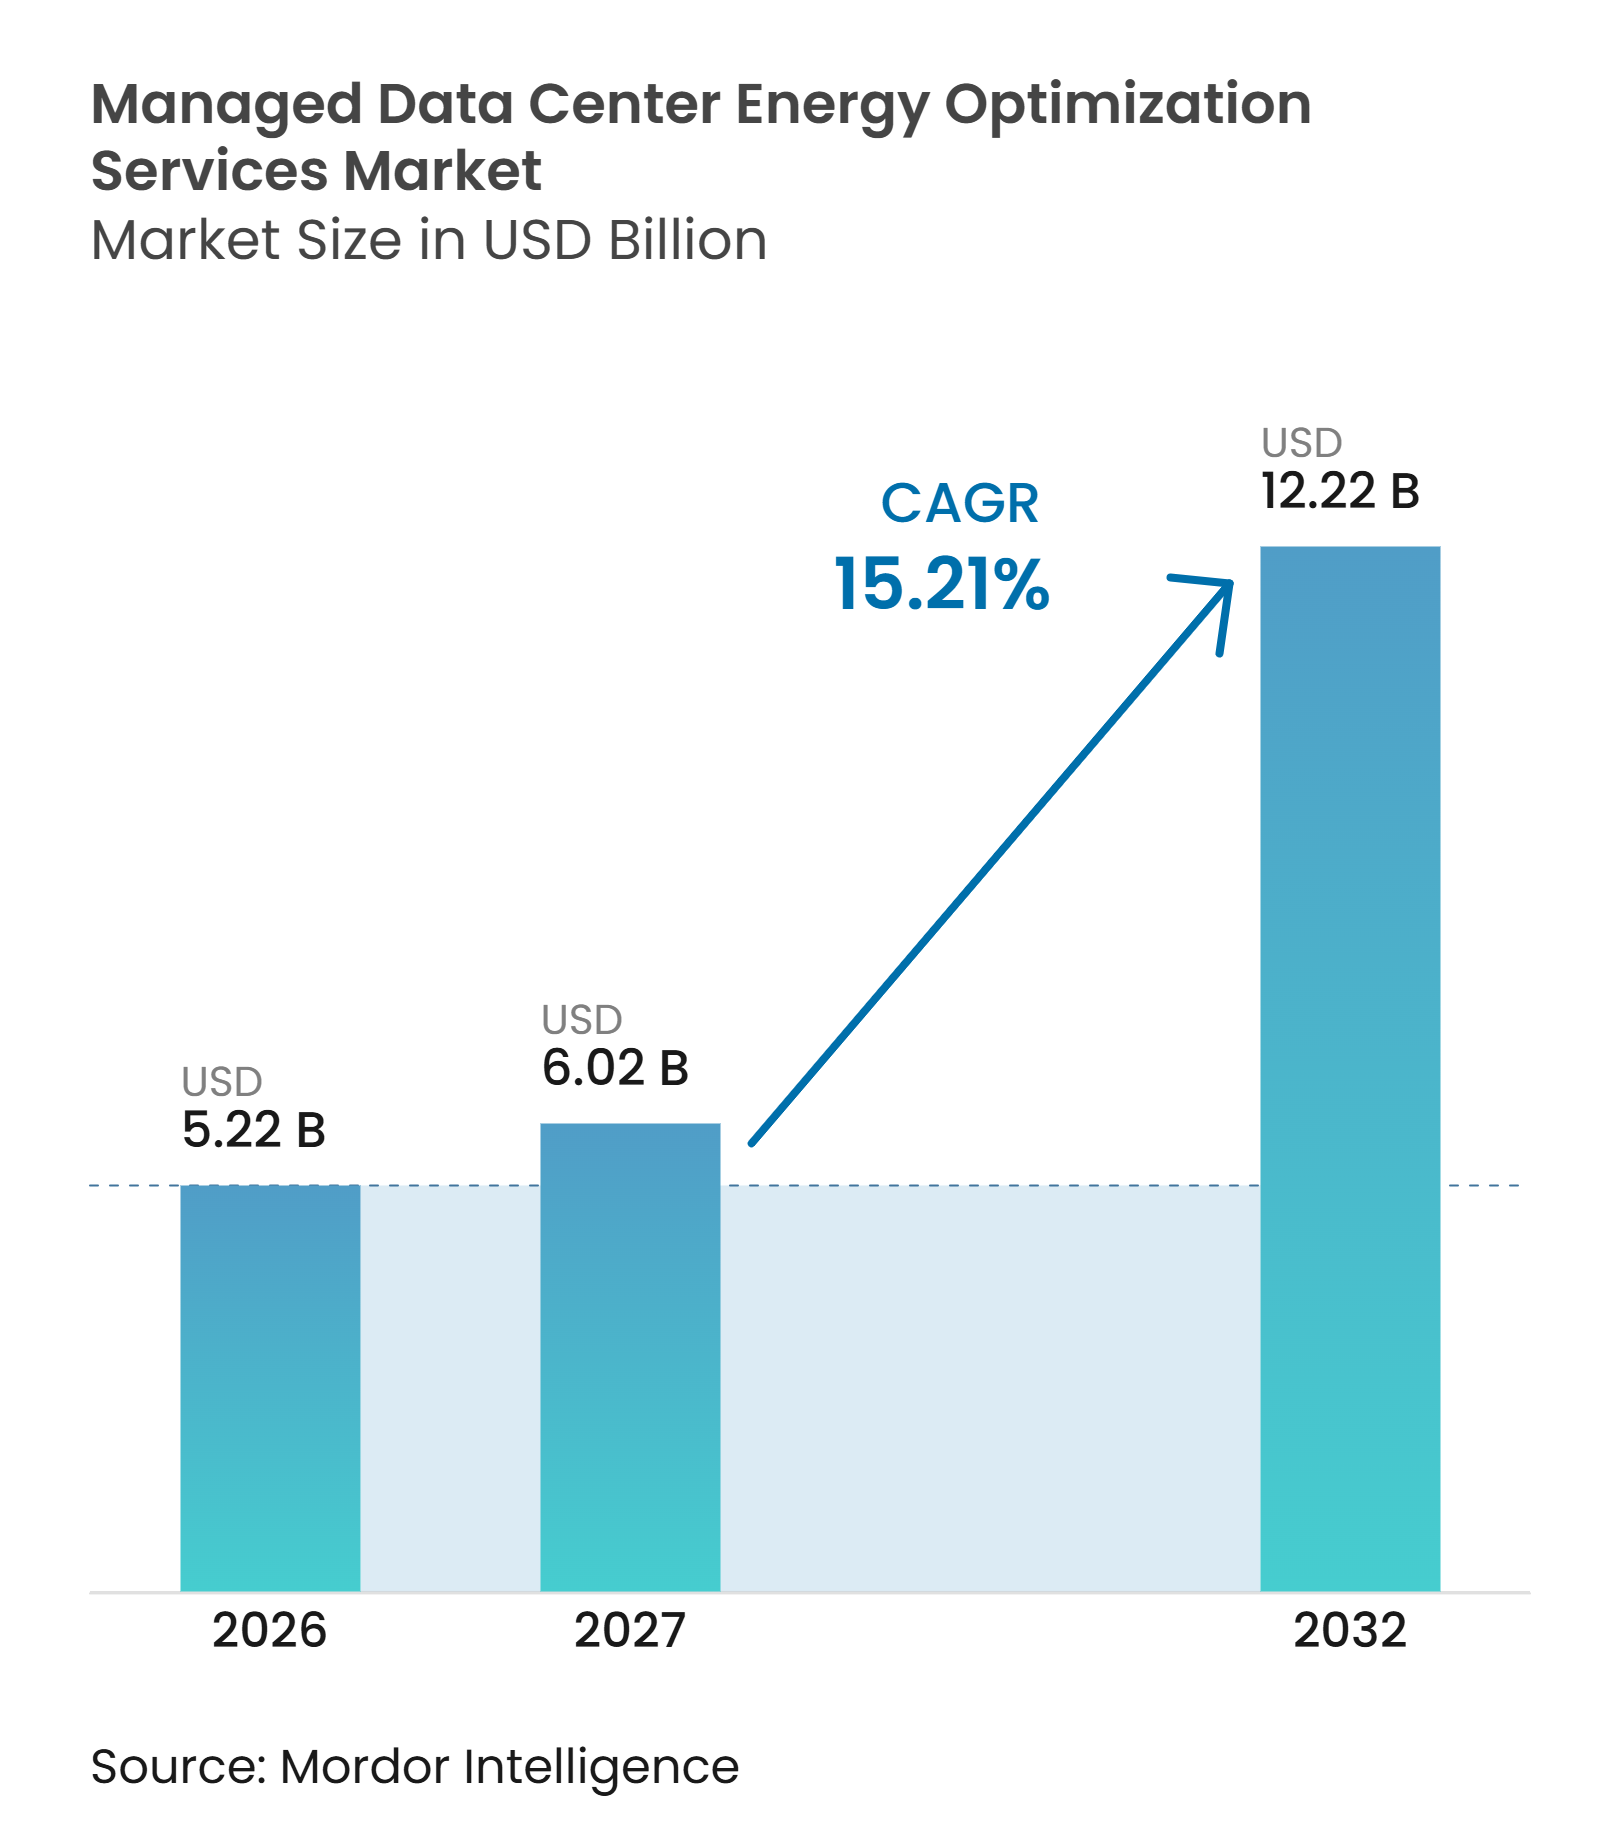
The managed data center energy optimization services market size was valued at USD 5.22 billion in 2026 and is projected to grow from USD 6.02 billion in 2027 to reach USD 12.22 billion by 2032, registering a CAGR of 15.21% during the forecast period (2027-2032). Demand is rising because AI infrastructure requires more power, more advanced cooling, and closer monitoring than conventional data halls. Electricity costs, grid constraints, and reporting rules are moving energy optimization from a facilities task to an operating priority. Providers that combine thermal, power, and reporting services under one service-level agreement are better placed to secure longer contracts. Competition is shifting toward providers that engage during infrastructure design and can support high-density cooling, power distribution, and operational data management.
Key Report Takeaways
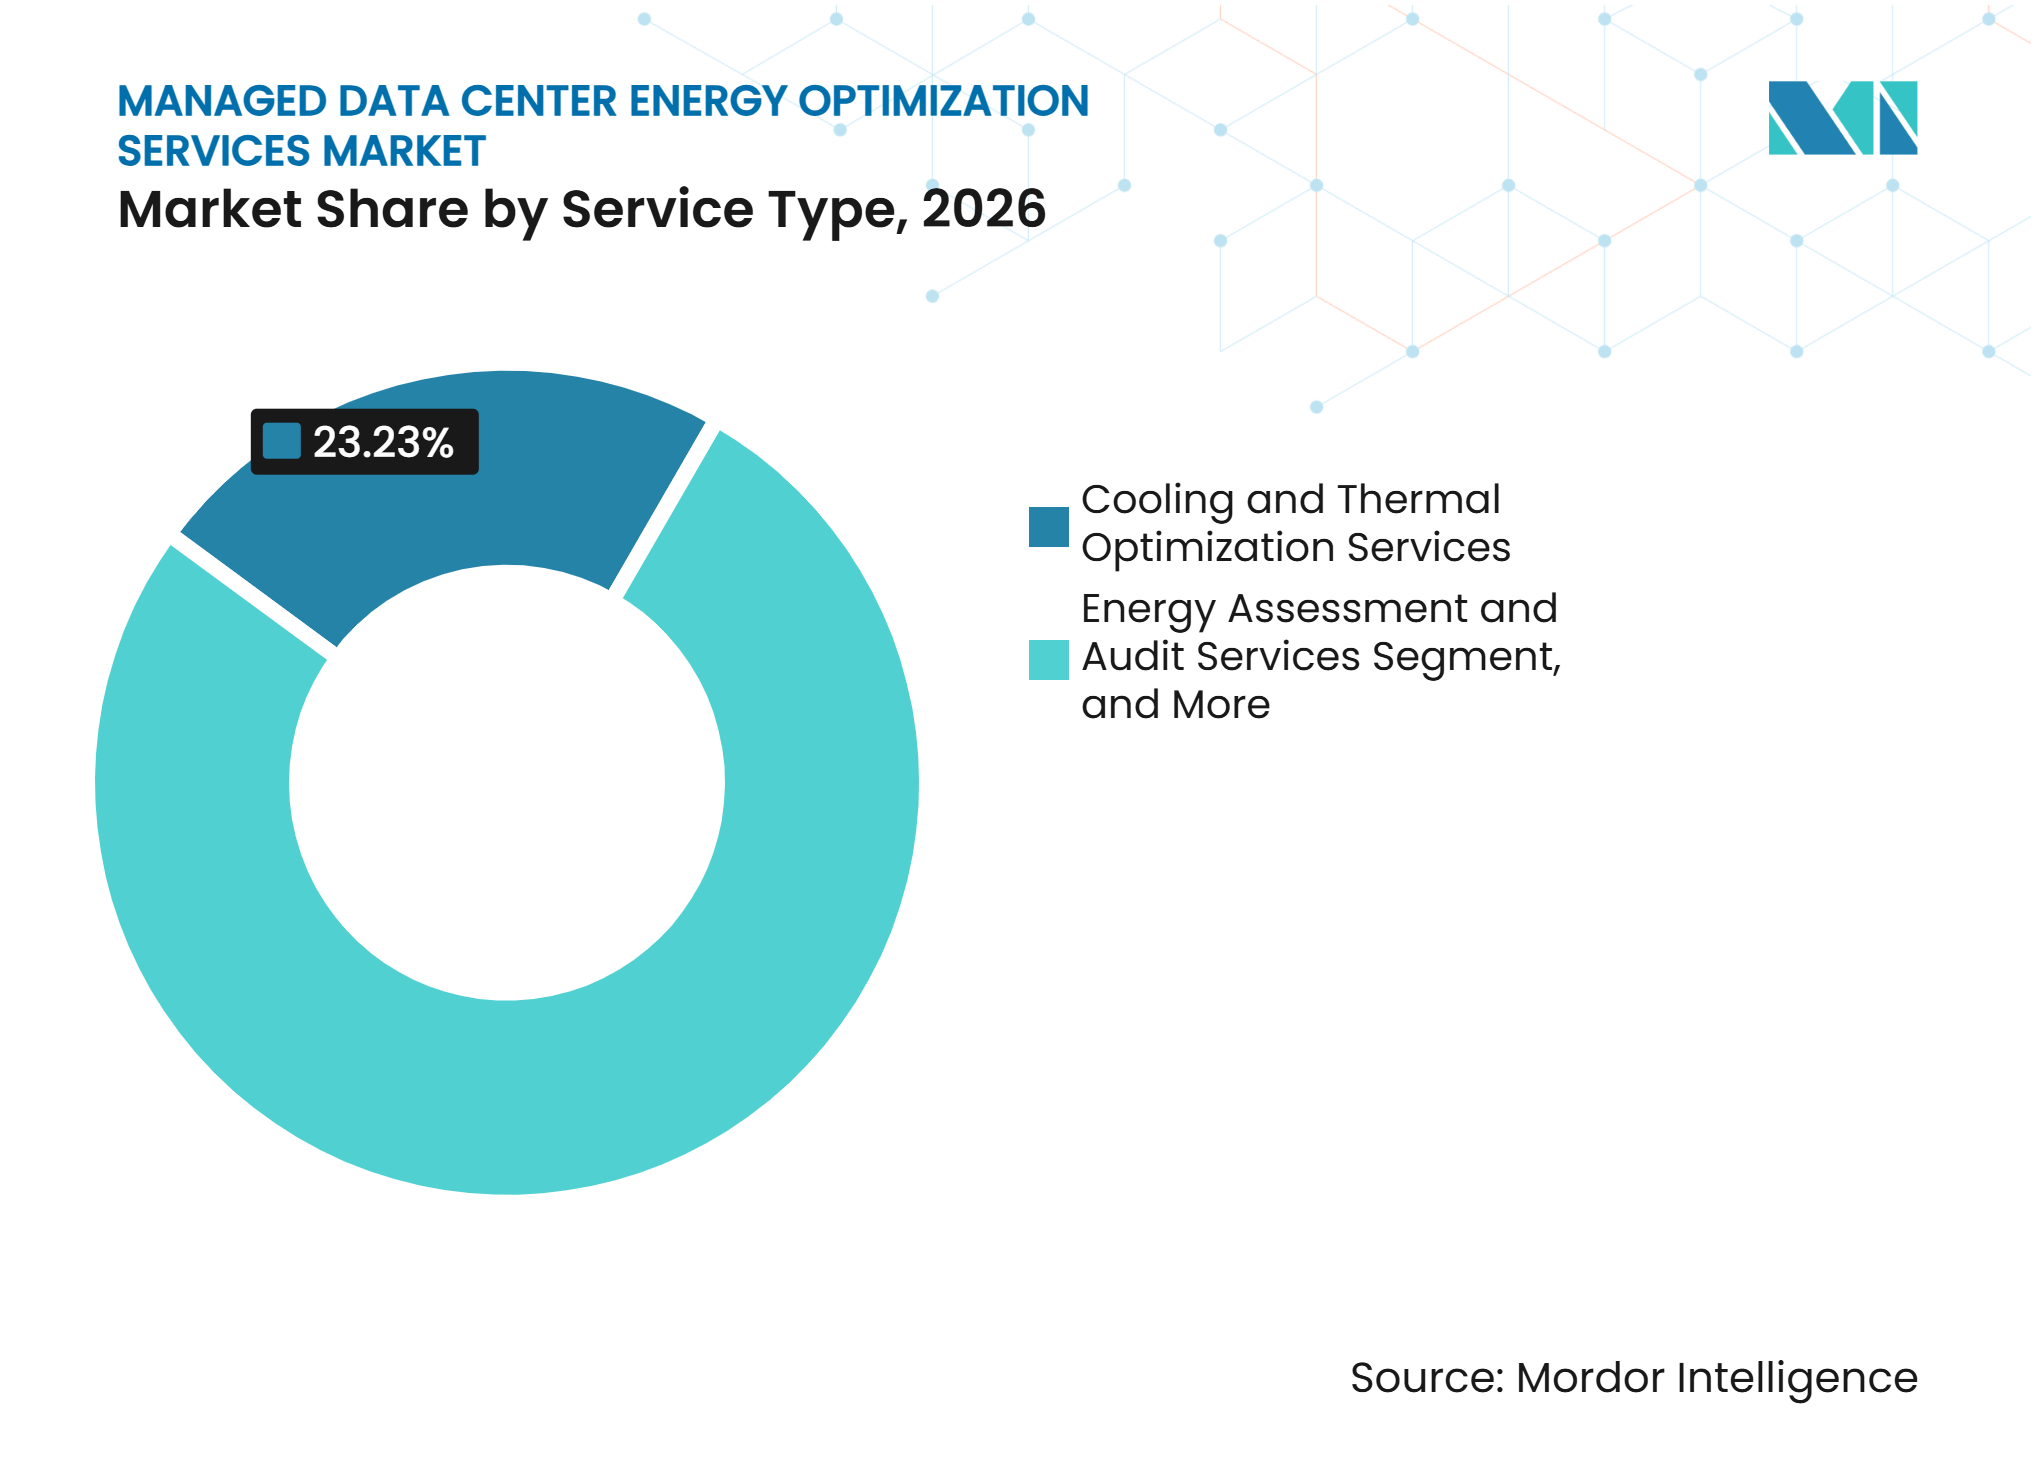
- By service type, Cooling and Thermal Optimization Services held 23.23% of the managed data center energy optimization services market in 2026 and is projected to expand at a 15.66% CAGR through 2032.
- By optimization domain, PUE Optimization held 27.99% in 2026, while Cooling Energy Optimization is projected to expand at a 15.54% CAGR through 2032.
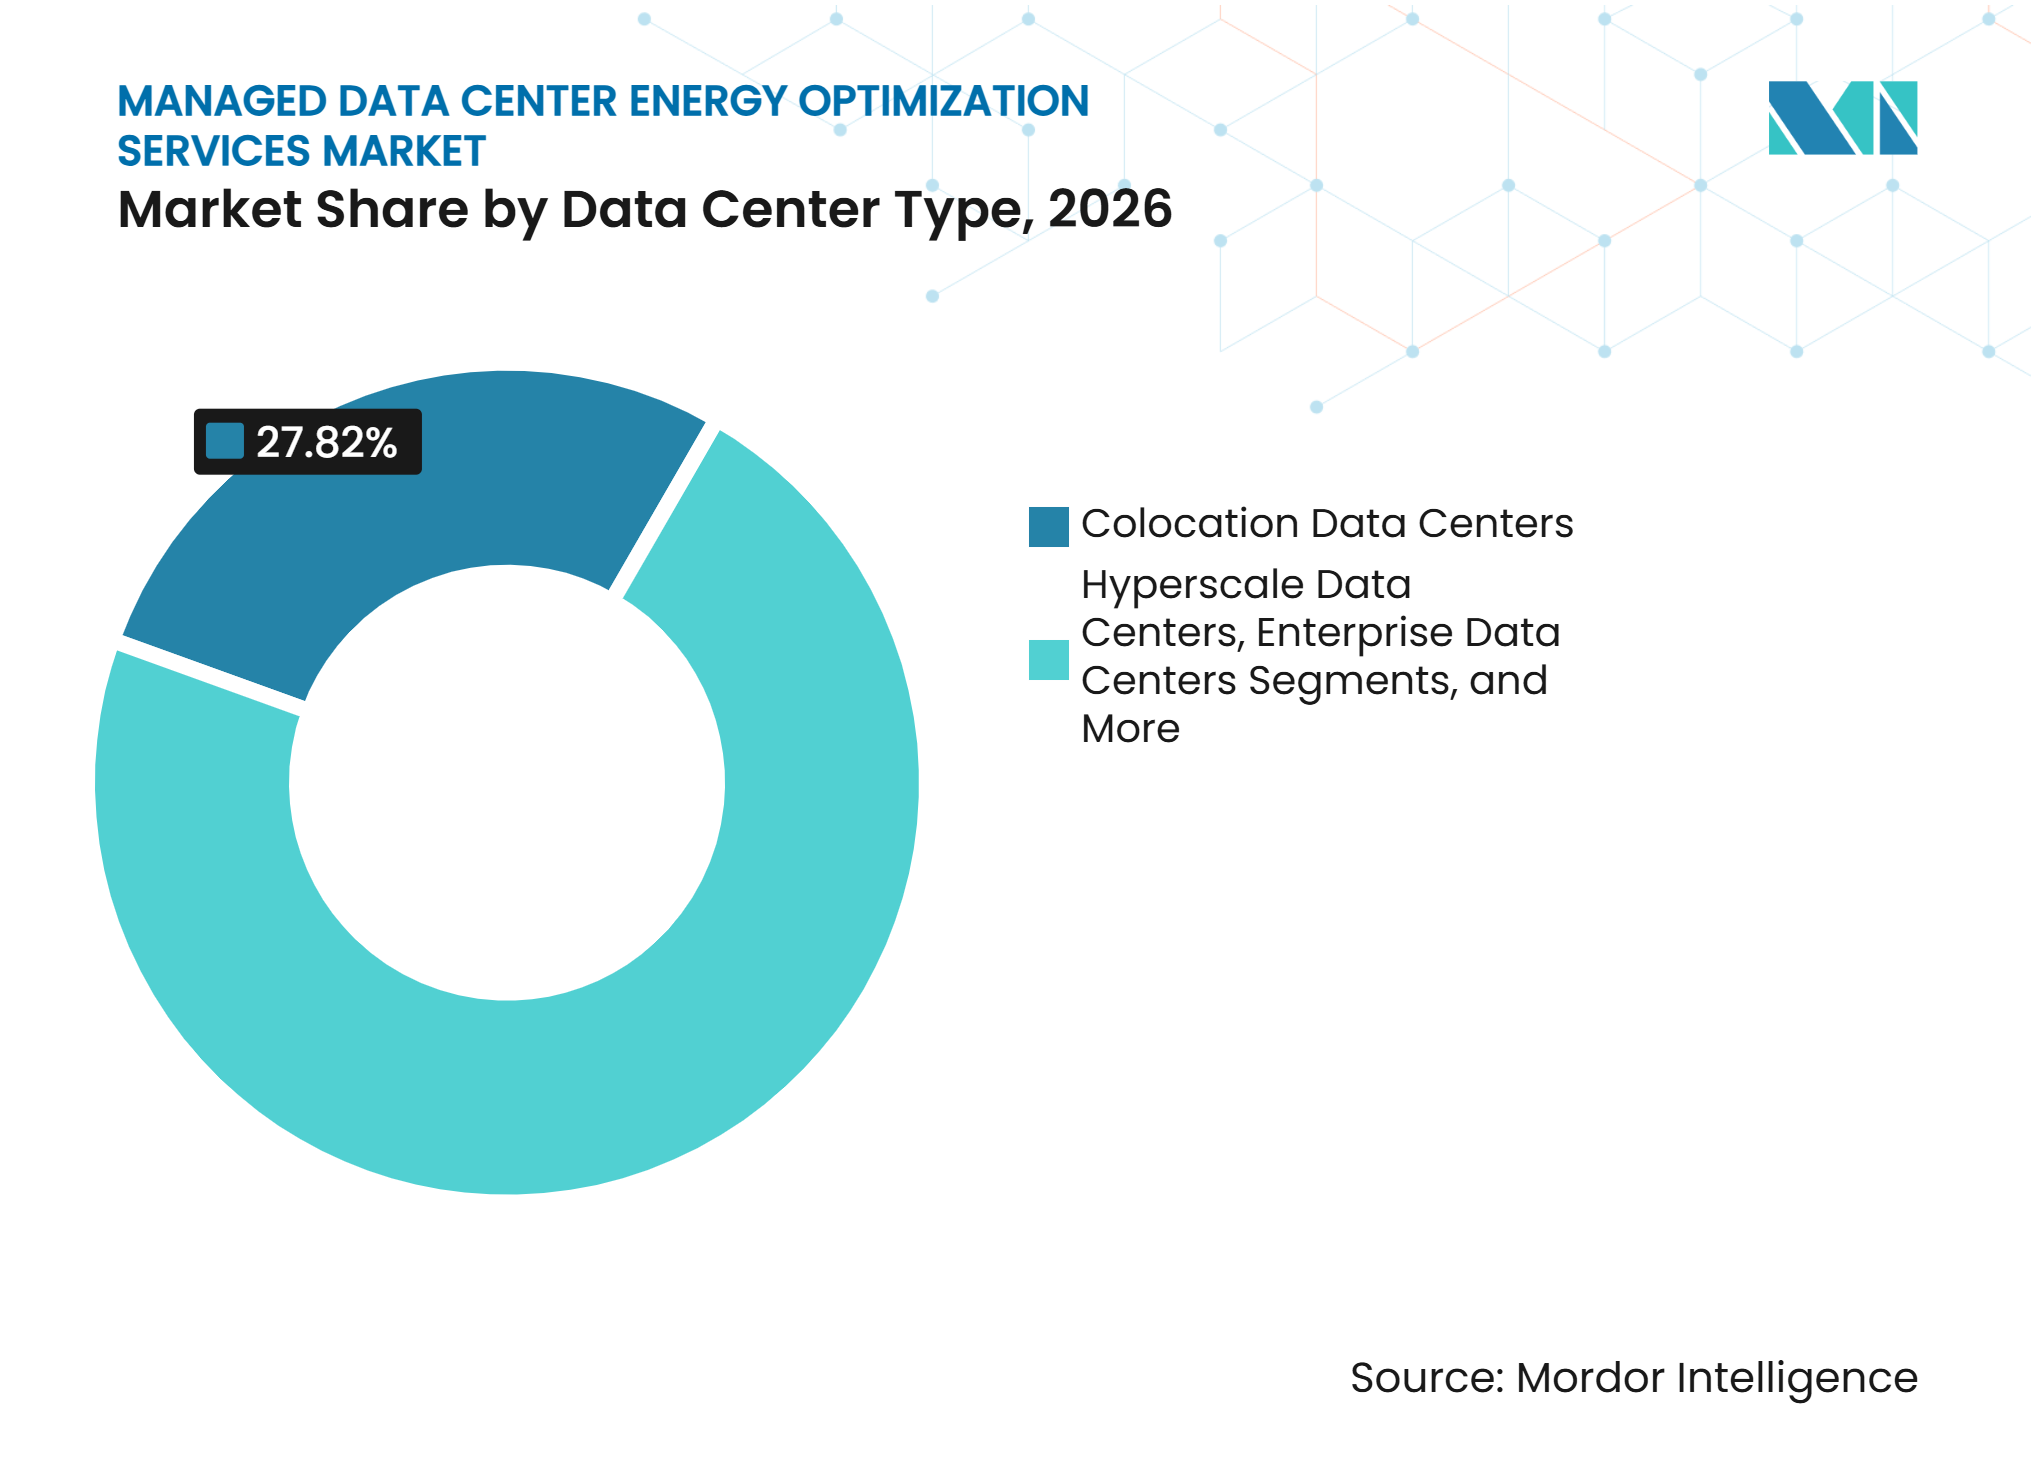
- By data center type, Colocation Data Centers held 27.82% in 2026, while Hyperscale Data Centers are projected to expand at a 15.38% CAGR through 2032.
- By end user, Cloud and Colocation Service Providers held 34.77% in 2026 and are projected to expand at a 15.49% CAGR through 2032.
- By geography, North America held 41.86% in 2026, while the Middle East and Africa is projected to expand at a 15.67% CAGR through 2032.
Note: Market numbers in this report are based on Mordor Intelligence's proprietary estimation framework, which combines nine months of actuals with Q4 projections for base year 2026.
Market Trends and Insights
Drivers Impact Analysis of Managed Data Center Energy Optimization Services Market*
| Driver | (~) % Impact on CAGR Forecast | Geographic Relevance | Impact Timeline |
|---|---|---|---|
| AI Workloads Increasing Rack Power Density | +4.5% | Global, concentrated in North America and Asia-Pacific hyperscale corridors | Short term (≤ 2 years) |
| Mandatory Energy and Sustainability Reporting | +3.0% | European Union core, with effects in North America and Asia-Pacific regulatory clusters | Medium term (2-4 years) |
| Escalating Electricity Costs and Grid Constraints | +2.5% | North America, Europe, and Southeast Asia | Short term (≤ 2 years) |
| Outsourcing of Brownfield OT-IT Integration and Optimization | +2.2% | Global, strongest in North America, Germany, and Japan | Medium term (2-4 years) |
| Liquid Cooling and High-Density Thermal Management Adoption | +1.8% | North America, Europe, Singapore, and Japan | Medium term (2-4 years) |
| Demand for Verified Savings, Capacity Release, and SLA Protection | +1.5% | Global, with early leadership in North America and Northern Europe | Long term (≥ 4 years) |
| Source: Mordor Intelligence | |||
AI Workloads Increasing Rack Power Density
AI workloads have made energy management an operating requirement for AI-capable facilities. The International Energy Agency expects AI server power density to increase a further 4-fold by 2027.[1]U.S. Department of Energy research states that some next-generation HPC configurations already exceed 250 kW per rack. Conventional air cooling becomes ineffective above 40 kW per rack, which increases the need for liquid cooling design, power distribution changes, and continuous thermal management. AI inference also creates rapid power changes that require predictive load management rather than conventional steady-state controls. The managed data center energy optimization services market therefore benefits as operators seek providers that can manage the linked thermal and electrical demands of AI infrastructure.
Mandatory Energy and Sustainability Reporting
For the managed data center energy optimization services market, regulatory obligations are turning energy management into a recurring compliance expense. Article 12 of the EU Energy Efficiency Directive requires operators with at least 500 kW of installed IT power to submit annual data center performance indicators to the European Commission.[2] The revised ISO/IEC 30134-2:2026 standard requires 12 months of continuous measurement, which supports demand for managed monitoring services that provide auditable data. ITU-T L.1510 also sets a common method for environmental indicators, including Scope 1, Scope 2, and Scope 3 emissions. These requirements favor service providers that can combine measurement, reporting, and improvement programs.
Escalating Electricity Costs and Grid Constraints
Higher electricity costs and grid connection delays are increasing the financial value of optimization programs. A 2026 Federal Reserve Bank of Dallas working paper found that existing U.S. data centers had raised regional wholesale electricity prices by 2-6% on average and projected a further 20-50% increase through 2028 under moderate-to-high utilization scenarios. The managed data center energy optimization services market is supported when operators prioritize lower PUE and better cooling efficiency to protect operating margins. Transformer and gas turbine supply constraints are also extending grid interconnection timelines by 12-24 months. This encourages interest in behind-the-meter generation and storage, which need coordinated control across facility equipment and utility interfaces. Outcome-based service contracts can be more attractive when verified energy savings shorten the payback period.
Outsourcing of Brownfield OT-IT Integration and Optimization
Many legacy data centers use BMS, EPMS, DCIM, and ITSM systems that were not designed for real-time optimization. The systems often run on separate vendor protocols, so providers must normalize data and use edge gateways before analytics can act on the operating data. This work requires both energy engineering and IT operations knowledge that internal teams may not have. The managed data center energy optimization services market gains from this gap because an integrated portal can make the provider part of the client’s operating workflow. Energy-as-a-Service models can transfer some retrofit capital risk to the provider while linking fees to PUE or capacity-release outcomes. Liquid cooling adds coolant distribution units, secondary loops, and rear-door heat exchangers, which makes specialized commissioning more important.
Restraints Impact Analysis of Managed Data Center Energy Optimization Services Market*
| Restraint | (~) % Impact on CAGR Forecast | Geographic Relevance | Impact Timeline |
|---|---|---|---|
| High Upfront Retrofit Cost and Lengthy Payback Approval | -2.2% | Global, most acute in enterprise and government segments in North America and Europe | Short term (≤ 2 years) |
| Legacy BMS, EPMS, DCIM, and ITSM Integration Complexity | -1.8% | Global, strongest in brownfield enterprise and financial-sector data centers | Medium term (2-4 years) |
| Shortage of Energy-Literate Data Center Operations Talent | -1.2% | Global, with acute shortfalls in emerging markets and Tier-2 metro markets | Long term (≥ 4 years) |
| Cybersecurity, Data Sovereignty, and Operational Technology Risk | -0.9% | Global, heightened in the European Union, government, and financial sectors | Medium term (2-4 years) |
| Source: Mordor Intelligence | |||
High Upfront Retrofit Cost and Lengthy Payback Approval
Brownfield optimization programs typically require USD 3 million to USD 15 million per data hall, depending on facility age and power density. These commitments can lead to multi-quarter procurement and legal reviews in enterprise and government accounts. Financial officers often apply 15-20% internal-rate-of-return hurdles to facilities investments, which a stand-alone efficiency project may not satisfy without carbon-credit or capacity-release value. Performance contracts with low upfront client spending can speed procurement, but they also increase capital exposure for the provider. ISO 50001 requirements and EU Energy Efficiency Directive obligations can improve capital approval because they add a compliance reason for the investment. In the managed data center energy optimization services market, rising electricity costs can shorten the payback period without requiring providers to change their pricing.
Legacy BMS, EPMS, DCIM, and ITSM Integration Complexity
Multi-vendor control environments can raise integration costs and lengthen deployment schedules. Many brownfield facilities have 4 or more control systems with proprietary data models and limited bidirectional API support. This makes deployment more similar to custom industrial automation work than a standard software installation. Providers that misjudge complexity on a fixed-price contract may absorb cost overruns while the operator waits for usable data. Liquid cooling creates an additional operational technology domain that few providers can support at scale. Within the managed data center energy optimization services market, this restraint encourages vendor consolidation around firms with verified skills across several BMS and DCIM platforms.
*Our forecasts treat driver/restraint impacts as directional, not additive. The impact forecasts reflect baseline growth, mix effects, and variable interactions.
Managed Data Center Energy Optimization Services Market Segment Analysis
By Service Type:
Thermal Complexity Supports Longer Managed ContractsCooling and Thermal Optimization Services held 23.23% of revenue in 2026 and is projected to expand at a 15.66% CAGR through 2032. Direct-to-chip liquid cooling and immersion cooling require commissioning, fluid chemistry management, and continuous thermal mapping. These needs support longer managed contracts because most operators do not employ all of these specialist skills internally. Energy Assessment and Audit Services provide the performance baseline for higher-value, outcome-based services. The managed data center energy optimization services market also uses Monitoring and Measurement Services as the telemetry layer that supports annual EU reporting.
Within the managed data center energy optimization services market, Power and Electrical Optimization Services is gaining importance as GPU-dense deployments adopt HVDC 800 V designs. This creates work across switchgear, UPS design, and power-quality monitoring. IT Workload and Virtualization Optimization Services remain relevant for enterprise and hybrid facilities. Carbon, Sustainability, and Compliance Optimization Services are becoming recurring engagements as organizations need auditable Scope 2 and Scope 3 measurement. Johnson Controls launched its Silent-Aire coolant distribution platform in October 2025 and stated that its full thermal portfolio can reduce non-IT energy use by up to 50%.[3]



By Optimization Domain:
PUE Reporting and Cooling Requirements Shape DemandPUE Optimization accounted for 27.99% of the managed data center energy optimization services market size in 2026. Its position reflects its use as a core performance measure under EU reporting rules and the continuous measurement requirements in ISO/IEC 30134-2:2026. Cooling Energy Optimization is projected to expand at a 15.54% CAGR through 2032 because cooling accounts for more than 35% of facility electricity use in AI-dense environments. Active fluid management is different from the passive maintenance model used in traditional air-cooled facilities. In the managed data center energy optimization services market, Power Quality and Distribution Optimization is also becoming more relevant as high-density GPU racks require protection from transient voltage events.
Within the managed data center energy optimization services market, Renewable Energy and Battery Storage Optimization is at an early stage, but grid connection delays are increasing interest in on-site generation, batteries, and utility coordination. Carbon Accounting and Emissions Optimization is moving from advisory work to continuous managed services as clients address Scope 1, Scope 2, and Scope 3 reporting. Water-Energy Optimization is more important in water-stressed locations such as the Middle East and the U.S. Southwest. IT Load and Server Utilization Optimization can improve facility efficiency through workload orchestration and virtualization without a physical retrofit. Providers that manage PUE, WUE, and carbon intensity through one agreement can offer a clearer accountability model.
By Data Center Type:
Colocation Scale and Hyperscale Buildout Drive Service NeedsColocation Data Centers held 27.82% of the managed data center energy optimization services market size in 2026. PUE guarantees, sustainability audit clauses, and service-level agreement penalties make optimization a commercial requirement for many colocation operators. Hyperscale Data Centers are projected to expand at a 15.38% CAGR through 2032. Their AI campuses face high energy costs and grid capacity pressure, even as they use advanced internal tools. The managed data center energy optimization services market benefits where specialist providers support liquid cooling lifecycle management and Scope 2 carbon accounting.
Within the managed data center energy optimization services market, Enterprise Data Centers face pressure to improve efficiency as colocation options become more competitive. Edge Data Centers are a growing opportunity because distributed sites often have limited local staff and need remote support. Their varied equipment can still make integration difficult. Managed Data Centers can act as both buyers and resellers of optimization services through their tenant offerings. The required service model increasingly depends on thermal maturity, with air-cooled enterprise facilities needing audit-led work and liquid-cooled hyperscale campuses needing continuous operating support.

By End User:
Cloud and Colocation Providers Set Procurement ExpectationsCloud and Colocation Service Providers held 34.77% of the managed data center energy optimization services market share in 2026 and are projected to expand at a 15.49% CAGR through 2032. These providers aggregate AI compute capacity and use procurement standards based on PUE targets, verified carbon intensity, and capacity-release commitments. Their requirements are increasingly adopted by enterprise and government buyers. Banking, Financial Services, and Insurance is the second-largest end-user category because of resilience rules and energy-intensive analytics. Information Technology and Telecommunications companies also purchase managed optimization for owned facilities and embed similar capabilities into enterprise services.
Within the managed data center energy optimization services market, Healthcare and Life Sciences is a developing high-value category because diagnostic AI loads increase energy demand and operational continuity has high value. Government and Public Sector purchasing cycles remain long, although sustainability reporting can shift efficiency spending toward compliance budgets. Manufacturing and Industrial demand is at an earlier stage and centers on private facilities supporting operational technology analytics. IBM implemented 634 energy conservation projects in 2025, avoiding 123,000 MWh and 35,000 metric tons of CO₂e while reaching a weighted average PUE of 1.39.[4] Retail, media, and logistics are also creating demand as AI inference expands beyond organizations with large in-house energy teams.
Geography Analysis
North America
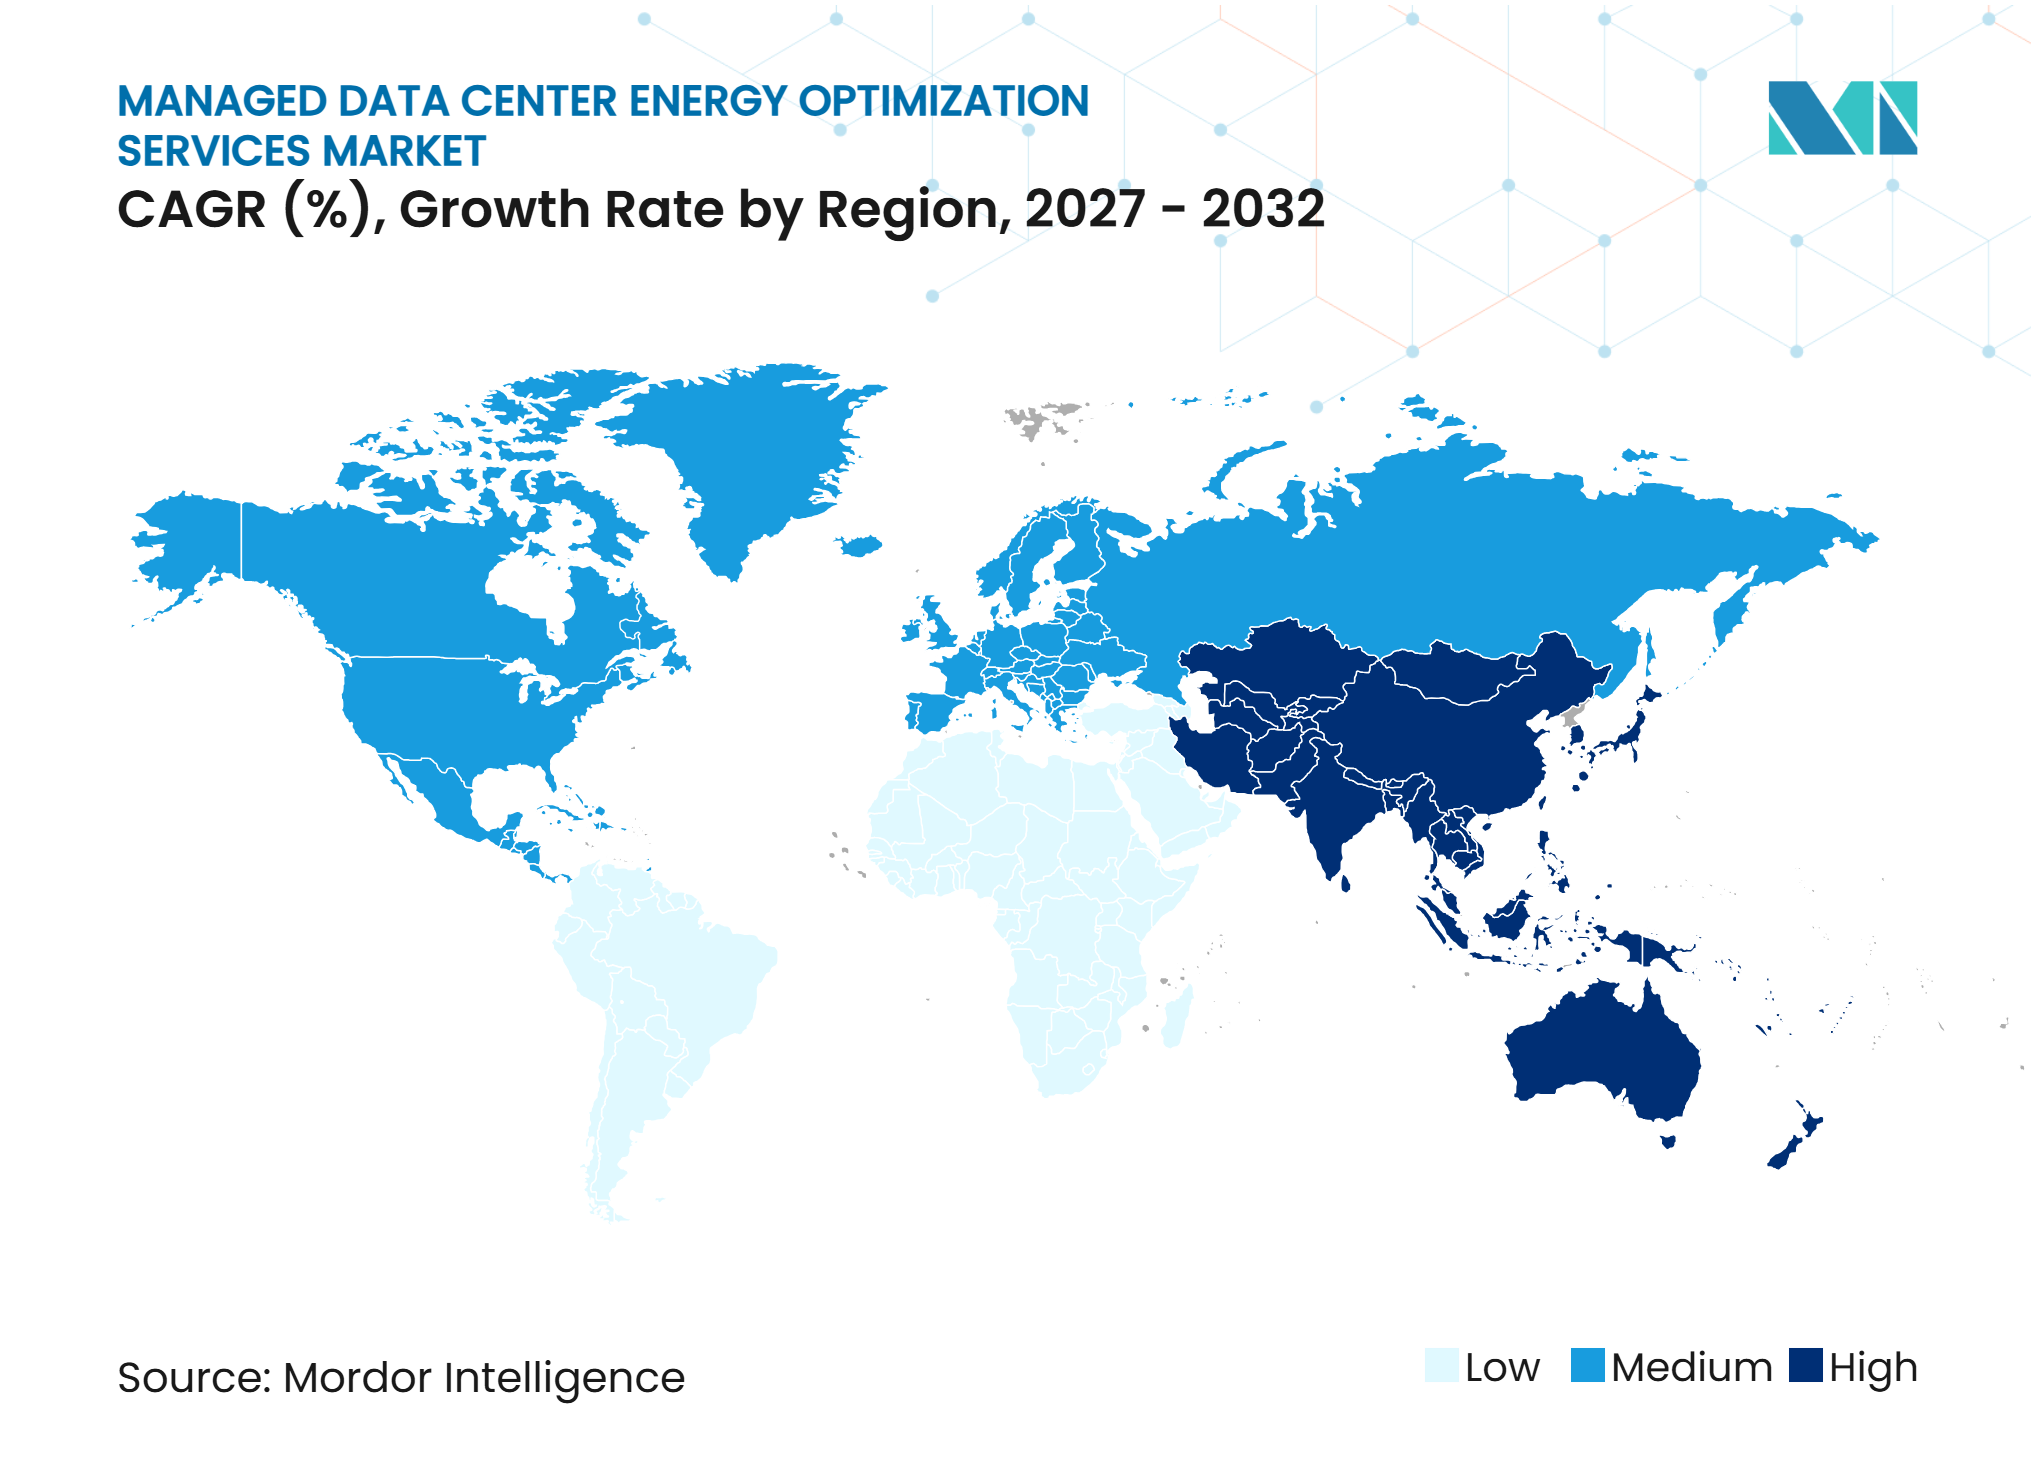
North America held 41.86% of the managed data center energy optimization services market share in 2026. Northern Virginia, Phoenix, Chicago, and Dallas are major hyperscale corridors with a large share of AI compute activity, and the U.S. Department of Energy projects that data centers could account for 11.8% of domestic electricity use by 2030. This exposure makes verified efficiency gains important to facility operators. Canada benefits from renewable power availability and cooling conditions, while Mexico follows data center demand from U.S.-based cloud operators.
Europe
For the managed data center energy optimization services market, Europe is shaped by the EU Energy Efficiency Directive, which creates recurring work for monitoring and reporting providers. The European Data Center Association projects EUR 176 billion in cumulative investment between 2026 and 2031, equal to USD 190.1 billion, with energy access and grid readiness limiting capacity additions.[5] Germany, the United Kingdom, France, and the Nordic countries form the core FLAP-D demand base. Growth is also extending into Southern Europe and Central and Eastern Europe.
Asia-Pacific
Asia-Pacific is the second-fastest-growing region because of China’s East Data West Computing initiative, India’s announced investment, and Singapore’s sustainability licensing conditions.
Middle East and Africa
The Middle East and Africa is projected to expand at a 15.67% CAGR through 2032. Extreme ambient temperatures can reach 50°C, making cooling a leading non-IT operating cost. The managed data center energy optimization services market therefore has a strong use case for thermal management in this region.
South America
South America remains the smallest regional segment. Brazil’s financial services and hyperscale activity and Chile’s renewable energy advantage provide its near-term demand base, while the rest of South America remains at an early adoption stage
Competitive Landscape
Market Concentration
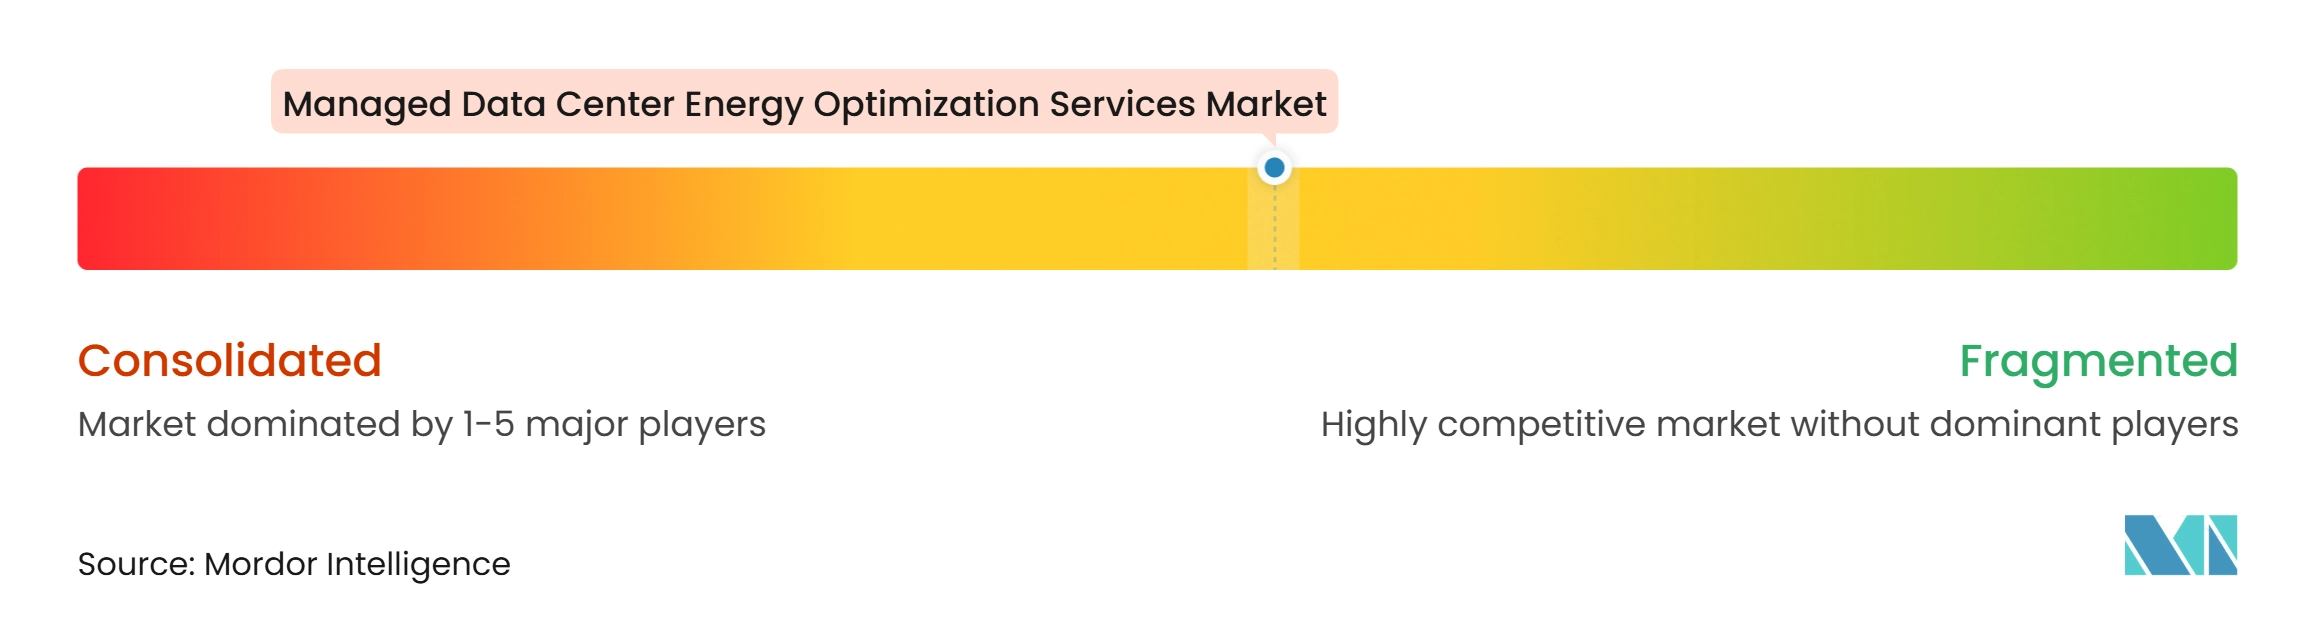
The managed data center energy optimization services market has moderate concentration. Global energy and automation providers have broad hardware and software portfolios, while specialized firms compete through focused analytics, monitoring, and service delivery. Schneider Electric, Vertiv, Eaton, and ABB have advantages in equipment such as coolant distribution units, UPS systems, switchgear, and power distribution units. Schneider Electric and Vertiv strengthened their positions through 2025 work with NVIDIA on AI infrastructure designs. These relationships allow providers to engage when data center power and cooling systems are first designed.
EkkoSense, Nlyte Software, Sunbird Software, Modius, and FNT GmbH offer monitoring and reporting layers that can be placed over existing BMS and DCIM environments. Within the managed data center energy optimization services market, this approach can provide faster deployment than a full infrastructure replacement. Schneider Electric issued its AI Infrastructure and Liquid-Cooled Controls Design reference document in September 2025, setting out an OT-IT interoperability framework with NVIDIA Mission Control. Iceotope Technologies and STULZ GmbH compete in thermal services through immersion and precision cooling knowledge, while ENGIE Impact and Enel X hold differentiated positions in energy procurement and demand response integration.
Honeywell and LS ELECTRIC formed a global collaboration in October 2025 to develop integrated power management and building automation solutions for data centers. Eaton also collaborated with NVIDIA in July 2025 on HVDC 800 V power infrastructure for AI data centers. NIS2 obligations and the U.S. NIST Cybersecurity Framework raise the security requirements for OT-IT integration contracts. This favors providers with established security operations and compliance capabilities. The managed data center energy optimization services market is therefore likely to favor firms that combine equipment knowledge, software control, and managed operational delivery.
Managed Data Center Energy Optimization Services Industry Leaders
-
Schneider Electric SE
-
Vertiv Holdings Co.
-
Johnson Controls International plc
-
Siemens AG
-
Eaton Corporation plc
- *Disclaimer: Major Players sorted in no particular order
Managed Data Center Energy Optimization Services Market Companies Covered in this Report
- Schneider Electric SE
- Vertiv Holdings Co.
- Johnson Controls International plc
- Siemens AG
- Eaton Corporation plc
- ABB Ltd.
- Nlyte Software Limited
- Sunbird Software, Inc.
- EkkoSense Ltd.
- FNT GmbH
- Modius, Inc.
- Honeywell International Inc.
- Delta Electronics, Inc.
- Legrand SA
- Rittal GmbH & Co. KG
- Huawei Technologies Co., Ltd.
- STULZ GmbH
- Cisco Systems, Inc.
- IBM Corporation
- Mitsubishi Heavy Industries, Ltd.
- Iceotope Technologies Limited
- Jabil Inc.
- GridPoint, Inc.
- ENGIE Impact
- Enel X
Recent Industry Developments in Managed Data Center Energy Optimization Services Market
- October 2026: Eaton Corporation and NVIDIA unveiled the Eaton Beam Rubin DSX platform, integrating power and cooling infrastructure designed to support megawatt-class racks with on-site generation. The platform is structured to enable new data center capacity to come online in months rather than years, targeting the grid interconnect bottleneck constraining global AI infrastructure deployment timelines.
- February 2026: Honeywell International announced a strategic collaboration with Kortech to advance digital transformation and energy efficiency for data centers across Egypt, Saudi Arabia, and the UAE. The partnership expands Honeywell’s managed infrastructure services footprint into the fastest-growing data center geography at a time of multi-billion-dollar AI infrastructure build-out in the Gulf Cooperation Council.
- November 2025: Vertiv Holdings and Caterpillar Inc. signed a memorandum of understanding to collaborate on advanced energy optimization solutions for data centers, integrating Vertiv’s power distribution and cooling portfolio with Caterpillar’s and Solar Turbines’ CCHP products and 1-39 MW natural-gas turbine range. The initiative targets modular behind-the-meter architectures designed to lower PUE and improve carbon footprint versus conventional grid-dependent designs.
- October 2025: Johnson Controls International launched the Silent-Aire Coolant Distribution platform at Data Centre World Asia 2025 in Singapore, offering scalable cooling from 500 kW to over 10 MW with built-in 3-pump and 3-heat-exchanger redundancy. The company stated that its full thermal portfolio can reduce non-IT energy use by up to 50%, targeting high-density data centers in land-constrained Asia-Pacific markets.
- October 2025: Honeywell International and LS ELECTRIC announced a global strategic collaboration to jointly develop integrated power management and building automation solutions for data centers, combining LS ELECTRIC’s switchgear expertise with Honeywell Forge’s AI-enabled platform for intelligent energy distribution and battery energy storage systems.
- July 2025: Vertiv Holdings and Oklo Inc. announced a collaboration to co-develop advanced power and thermal management solutions for hyperscale and colocation data centers powered by Oklo’s advanced nuclear power plants. A pilot technology demonstration was planned for Oklo’s initial Aurora powerhouse.
Global Managed Data Center Energy Optimization Services Market Report Scope
The managed data center energy optimization services market is externally delivered services where providers assess, monitor, and continuously optimize the power, cooling, IT load, and carbon performance of data center facilities, with commercial value measured primarily by verified energy savings, efficiency gains, capacity release, and sustainability outcomes rather than only by equipment supply or facility uptime. Providers track metrics such as power usage effectiveness, cooling energy consumption, power quality, server utilization, and emissions, then proactively tune the underlying systems and operations to improve those outcomes.
The Managed Data Center Energy Optimization Services Market Report is Segmented by Service Type (Energy Assessment and Audit Services, Monitoring and Measurement Services, Cooling and Thermal Optimization Services, Power and Electrical Optimization Services, IT Workload and Virtualization Optimization Services, Carbon, Sustainability, and Compliance Optimization Services, and Managed Operations and Continuous Optimization Services), Optimization Domain (Power Usage Effectiveness Optimization, Cooling Energy Optimization, Power Quality and Distribution Optimization, IT Load and Server Utilization Optimization, Renewable Energy and Battery Storage Optimization, Carbon Accounting and Emissions Optimization, and Water-Energy Optimization), Data Center Type (Hyperscale Data Centers, Colocation Data Centers, Enterprise Data Centers, Edge Data Centers, and Managed Data Centers), End User (Cloud and Colocation Service Providers, Information Technology and Telecommunications, Banking, Financial Services, and Insurance, Government and Public Sector, Healthcare and Life Sciences, Manufacturing and Industrial, and Other End Users), and Geography (North America, South America, Europe, Asia-Pacific, and Middle East and Africa). The Market Forecasts are Provided in Terms of Value (USD).
Segmentation Overview
| Energy Assessment and Audit Services |
| Monitoring and Measurement Services |
| Cooling and Thermal Optimization Services |
| Power and Electrical Optimization Services |
| IT Workload and Virtualization Optimization Services |
| Carbon, Sustainability, and Compliance Optimization Services |
| Managed Operations and Continuous Optimization Services |
| Power Usage Effectiveness Optimization |
| Cooling Energy Optimization |
| Power Quality and Distribution Optimization |
| IT Load and Server Utilization Optimization |
| Renewable Energy and Battery Storage Optimization |
| Carbon Accounting and Emissions Optimization |
| Water-Energy Optimization |
| Hyperscale Data Centers |
| Colocation Data Centers |
| Enterprise Data Centers |
| Edge Data Centers |
| Managed Data Centers |
| Cloud and Colocation Service Providers |
| Information Technology and Telecommunications |
| Banking, Financial Services, and Insurance |
| Government and Public Sector |
| Healthcare and Life Sciences |
| Manufacturing and Industrial |
| Other Ens Users |
| North America | United States |
| Canada | |
| Mexico | |
| South America | Brazil |
| Chile | |
| Rest of South America | |
| Europe | Germany |
| United Kingdom | |
| France | |
| Nordic Countries | |
| Russia | |
| Rest of Europe | |
| Asia-Pacific | China |
| India | |
| Japan | |
| South Korea | |
| Rest of Asia-Pacific | |
| Middle East and Africa | Saudi Arabia |
| United Arab Emirates | |
| South Africa | |
| Egypt | |
| Rest of Middle East and Africa |
| By Service Type | Energy Assessment and Audit Services | |
| Monitoring and Measurement Services | ||
| Cooling and Thermal Optimization Services | ||
| Power and Electrical Optimization Services | ||
| IT Workload and Virtualization Optimization Services | ||
| Carbon, Sustainability, and Compliance Optimization Services | ||
| Managed Operations and Continuous Optimization Services | ||
| By Optimization Domain | Power Usage Effectiveness Optimization | |
| Cooling Energy Optimization | ||
| Power Quality and Distribution Optimization | ||
| IT Load and Server Utilization Optimization | ||
| Renewable Energy and Battery Storage Optimization | ||
| Carbon Accounting and Emissions Optimization | ||
| Water-Energy Optimization | ||
| By Data Center Type | Hyperscale Data Centers | |
| Colocation Data Centers | ||
| Enterprise Data Centers | ||
| Edge Data Centers | ||
| Managed Data Centers | ||
| By End User | Cloud and Colocation Service Providers | |
| Information Technology and Telecommunications | ||
| Banking, Financial Services, and Insurance | ||
| Government and Public Sector | ||
| Healthcare and Life Sciences | ||
| Manufacturing and Industrial | ||
| Other Ens Users | ||
| By Geography | North America | United States |
| Canada | ||
| Mexico | ||
| South America | Brazil | |
| Chile | ||
| Rest of South America | ||
| Europe | Germany | |
| United Kingdom | ||
| France | ||
| Nordic Countries | ||
| Russia | ||
| Rest of Europe | ||
| Asia-Pacific | China | |
| India | ||
| Japan | ||
| South Korea | ||
| Rest of Asia-Pacific | ||
| Middle East and Africa | Saudi Arabia | |
| United Arab Emirates | ||
| South Africa | ||
| Egypt | ||
| Rest of Middle East and Africa | ||
Key Questions Answered in the Report
What is the size of managed data center energy optimization services?
The managed data center energy optimization services market size was valued at USD 5.22 billion in 2026 and is projected to grow from USD 6.02 billion in 2027 to reach USD 12.22 billion by 2032, registering a CAGR of 15.21% during the forecast period (2027-2032).
Which service type leads demand for managed data center energy optimization?
Cooling and Thermal Optimization Services leads with a 23.23% share in 2026 and is projected to expand at a 15.66% CAGR through 2032.
Why are AI data centers increasing demand for optimization services?
AI servers have increased rack power density, which requires more advanced cooling, power management, and real-time operating controls.
Which users account for the largest demand?
Cloud and Colocation Service Providers hold 34.77% of demand in 2026 and are projected to expand at a 15.49% CAGR through 2032.
Which region leads managed data center energy optimization services?
North America holds 41.86% in 2026, supported by large hyperscale corridors and rising electricity system pressures.
What limits adoption of these services?
High retrofit costs, difficult integration across legacy systems, skills shortages, and cybersecurity requirements can slow deployments.