
Managed Cloud Observability Services Market Size and Share
Market Overview
| Study Period | 2021 - 2032 |
|---|---|
| Market Size (2027) | USD 0.6 Billion |
| Market Size (2032) | USD 1.34 Billion |
| Growth Rate (2027 - 2032) | 17.51 % |
| Fastest Growing Market | Asia-Pacific |
| Largest Market | North America |
| Market Concentration | Medium |
Major Players *Disclaimer: Major Players sorted in no particular order Image © Mordor Intelligence. Reuse requires attribution under CC BY 4.0. | |
Managed Cloud Observability Services Market Analysis by Mordor Intelligence
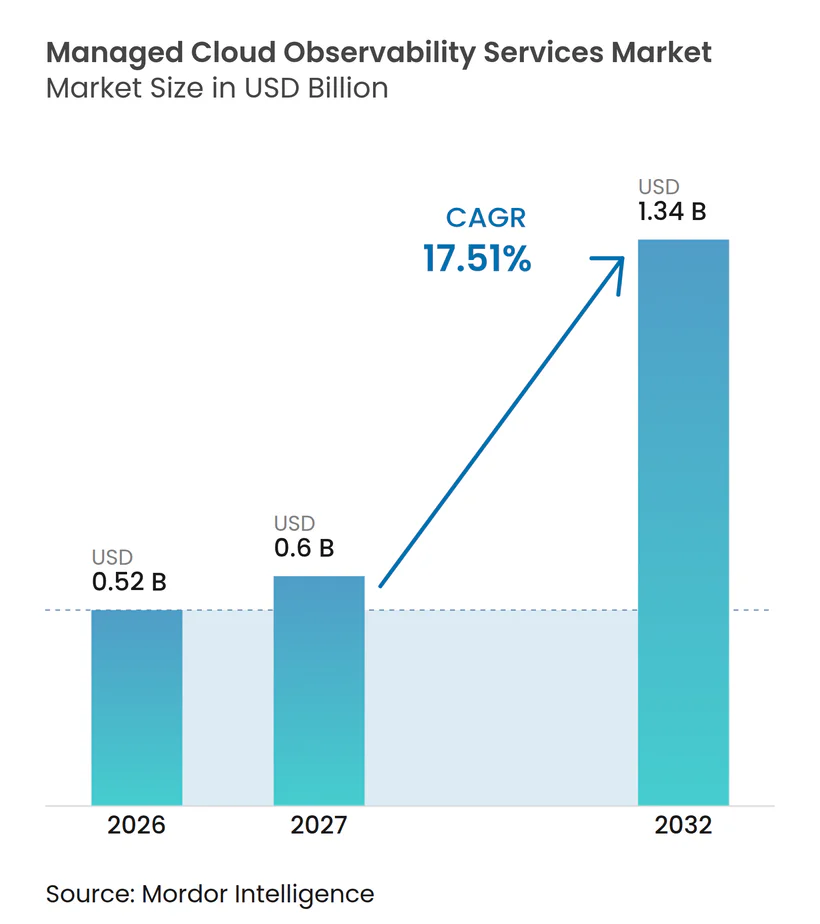
The Managed cloud observability services market size is projected to expand from USD 0.52 billion in 2026 and USD 0.61 billion in 2027 to USD 1.34 billion by 2032, registering a CAGR of 17.51% between 2027 and 2032. The managed cloud observability services market is shaped by multi-cloud operating complexity, limited availability of specialized engineering talent, and expanding AI workloads that need more detailed telemetry. Buyers increasingly seek providers that operate platforms, manage monitoring pipelines, respond to incidents, and support reliability programs. This shift makes external operations a practical option for mid-sized and large enterprises with complex estates. Providers that manage data costs and connect fragmented tools can strengthen their contract position. The managed cloud observability services market also creates opportunities for services designed around regulatory, data-residency, and hybrid deployment requirements.
Key Report Takeaways
- By service type, managed monitoring and alerting held 32.84% of the Managed cloud observability services market share in 2026, while managed optimization and reliability engineering is projected to expand at a 22.80% CAGR through 2032.
- By deployment model, provider-hosted services held 58.72% of the Managed cloud observability services market share in 2026, while distributed and hybrid-hosted services are projected to expand at a 23.40% CAGR through 2032.
- By organization size, large enterprises accounted for 65.38% of revenue in 2026, while SMEs are projected to expand at a 20.60% CAGR through 2032.
- By end-user industry, IT and telecom held 28.64% of revenue in 2026, while healthcare and life sciences are projected to expand at a 23.10% CAGR through 2032.
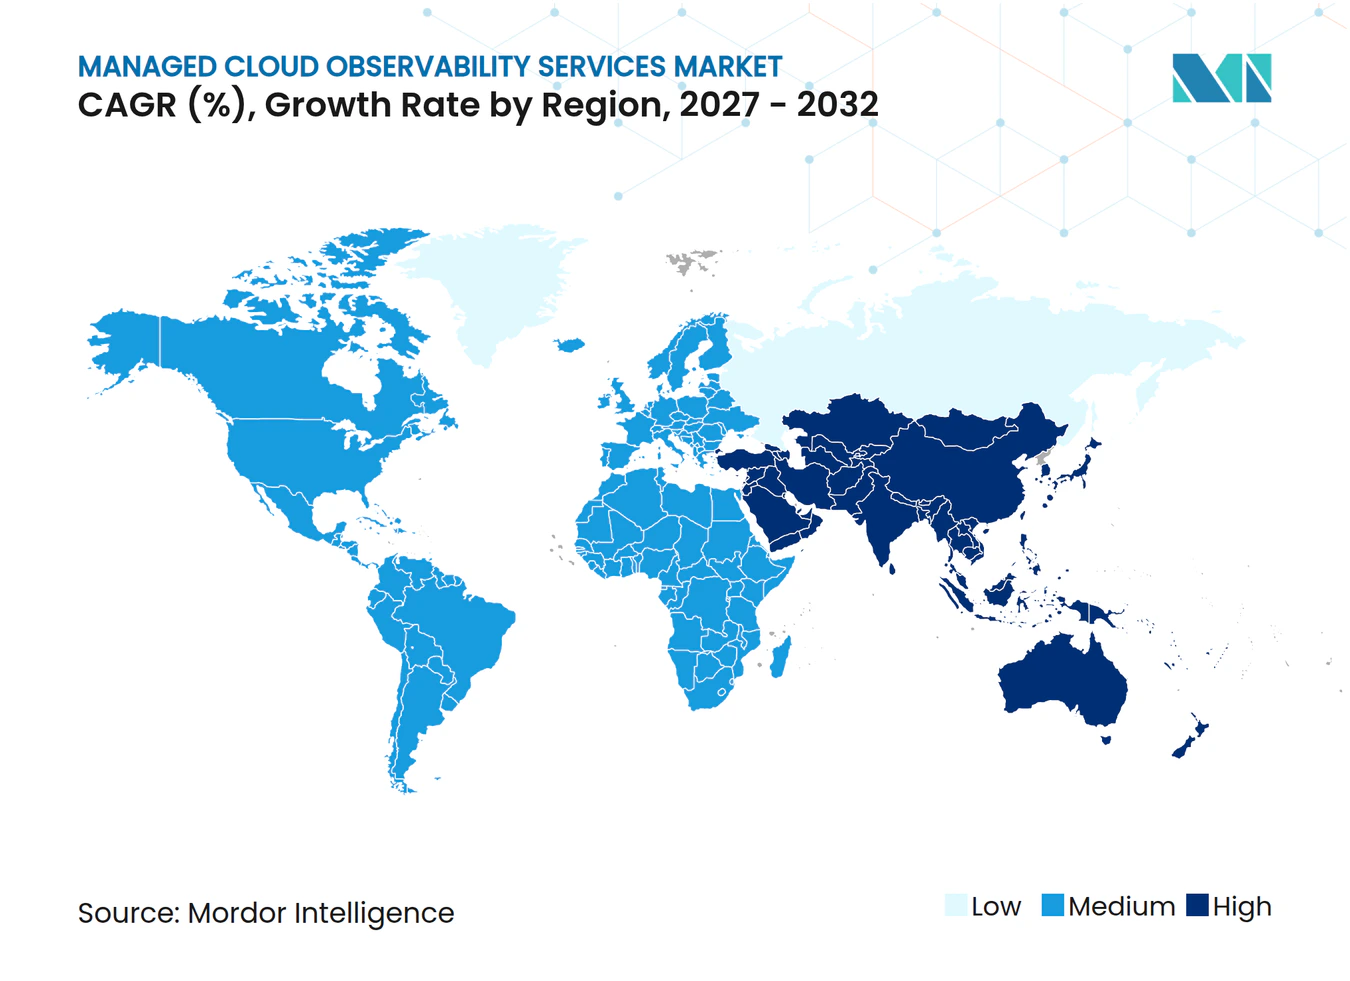
- By geography, North America held 37.42% of revenue in 2026, while Asia-Pacific is projected to expand at a 22.20% CAGR through 2032.
Note: Market numbers in this report are based on Mordor Intelligence's proprietary estimation framework, which combines nine months of actuals with Q4 projections for base year 2026.
Market Trends and Insights
Drivers Impact Analysis of Managed Cloud Observability Services Market*
| Driver | (~) % Impact on CAGR Forecast | Geographic Relevance | Impact Timeline |
|---|---|---|---|
| Multi-Cloud and Hybrid-Cloud Complexity | +5.2% | Global, most acute in North America and Europe | Short term (≤ 2 years) |
| AI Workload and GPU Visibility Requirements | +3.8% | Global, led by North America, Asia-Pacific scaling rapidly | Short term (≤ 2 years) |
| Shortage of Observability Engineering Talent | +2.9% | Global, highest severity in North America, Europe, and Australia | Medium term (2-4 years) |
| OpenTelemetry-Led Vendor Interoperability | +1.8% | Global, strongest enterprise uptake in North America and Western Europe | Medium term (2-4 years) |
| Board-Level Reliability and Digital-Experience Accountability | +1.4% | North America and Europe, with spillover to Asia-Pacific core markets | Medium term (2-4 years) |
| Sovereign-Cloud and Data-Residency Requirements | +1.1% | Europe and Middle East, with selective spillover to Asia-Pacific | Long term (≥ 4 years) |
| Source: Mordor Intelligence | |||
Multi-Cloud and Hybrid-Cloud Operational Complexity
The managed cloud observability services market benefits from the wider use of hybrid and multi-cloud environments. Several enterprises use hybrid or multi-cloud IT environments. Different providers generate metrics, logs, and traces in different schemas. A latency issue in AWS can therefore require teams to connect signals from Azure or another platform before they can identify the cause. This work uses engineering time that many organizations cannot dedicate to platform maintenance. Managed providers can pre-integrate telemetry pipelines and reduce this normalization burden as clients add more cloud platforms.
AI Workload and GPU Visibility Requirements
AI training and inference add operational requirements that conventional application monitoring was not designed to cover. GPU utilization, memory capacity, NVLink throughput, and workload attribution determine whether an AI environment performs as planned. Splunk made AI Infrastructure Monitoring generally available in September 2025 with support for AWS Bedrock, Azure OpenAI, Google Cloud Vertex AI, and NVIDIA GPU environments.[1] New Relic reported that 82.6% of survey respondents considered observability more important as AI-generated code became more common, while 24.6% reported operating AI agents in production without monitoring.[2] The managed cloud observability services market can address this gap when providers combine platform knowledge with multi-vendor operational support. The need is strongest where internal teams must oversee AI tools from several vendors.
Shortage of Observability Engineering Talent
The managed cloud observability services market is also supported by the limited availability of people who can combine site reliability engineering and telemetry expertise. Enterprises that build fully internal programs must recruit specialists and retain them while operating an evolving platform. This can leave less time for product improvements and application delivery. Managed providers distribute specialized expertise across several client accounts and spread the cost of those capabilities. New Relic identified operational capacity as a major growth constraint in Australia and Japan in its 2026 Asia-Pacific research. This constraint can make managed operations more compelling in markets where technical talent is scarce.
OpenTelemetry-Led Vendor Interoperability
OpenTelemetry is changing how providers position managed observability services. The Cloud Native Computing Foundation graduated OpenTelemetry in May 2026, noting more than 12,000 contributors from over 2,800 companies.[3] This standard reduces dependence on proprietary instrumentation and moves competition toward analysis, service operations, and business outcomes. Providers can create value by managing collector deployment, routing configuration, and schema governance for clients. Elastic-sponsored research reported that 11% of organizations used OpenTelemetry in production in 2026, and 36% were experimenting with it. The managed cloud observability services market can benefit when providers simplify this operational work without placing an extra burden on client engineering teams.
Restraints Impact Analysis of Managed Cloud Observability Services Market*
| Restraint | (~) % Impact on CAGR Forecast | Geographic Relevance | Impact Timeline |
|---|---|---|---|
| Telemetry Ingestion and Retention Cost Escalation | -1.9% | Global, most acute in North America and Europe | Short term (≤ 2 years) |
| Tool Sprawl and Migration Friction | -1.4% | Global, highest severity in large-enterprise environments | Medium term (2-4 years) |
| Alert Fatigue and Low-Quality Instrumentation | -0.8% | Global | Medium term (2-4 years) |
| Client Resistance to Operational Data Outsourcing | -0.6% | Europe and Asia-Pacific | Long term (≥ 4 years) |
| Source: Mordor Intelligence | |||
Telemetry Ingestion and Retention Cost Escalation
Telemetry economics can affect renewal decisions in the managed cloud observability services market. Cloud-native workloads generate larger volumes of logs, traces, and metrics as services become more distributed. Providers need to control ingestion through sampling, filtering, and tiered retention. Strong data governance can help clients limit low-value data before it enters paid platforms. Cost controls must preserve the diagnostic information needed to maintain reliable services. Providers that cannot demonstrate these controls face pressure on pricing and contract retention.
Tool Sprawl and Migration Friction
Tool sprawl can slow provider onboarding and delay the realization of value. New Relic reported that the average enterprise used 5 observability tools in 2026, reflecting increased use of AI-specific point tools. A client may need to rationalize a portfolio of 6 to 15 tools before a provider can establish consistent service operations. Existing investments can also make organizations reluctant to move to a single platform. This favors managed models that work alongside a client's current tools instead of requiring a full replacement. The managed cloud observability services market may therefore reward providers that support gradual migration and hybrid operations.
*Our forecasts treat driver/restraint impacts as directional, not additive. The impact forecasts reflect baseline growth, mix effects, and variable interactions.
Managed Cloud Observability Services Market Segment Analysis
By Service Type:
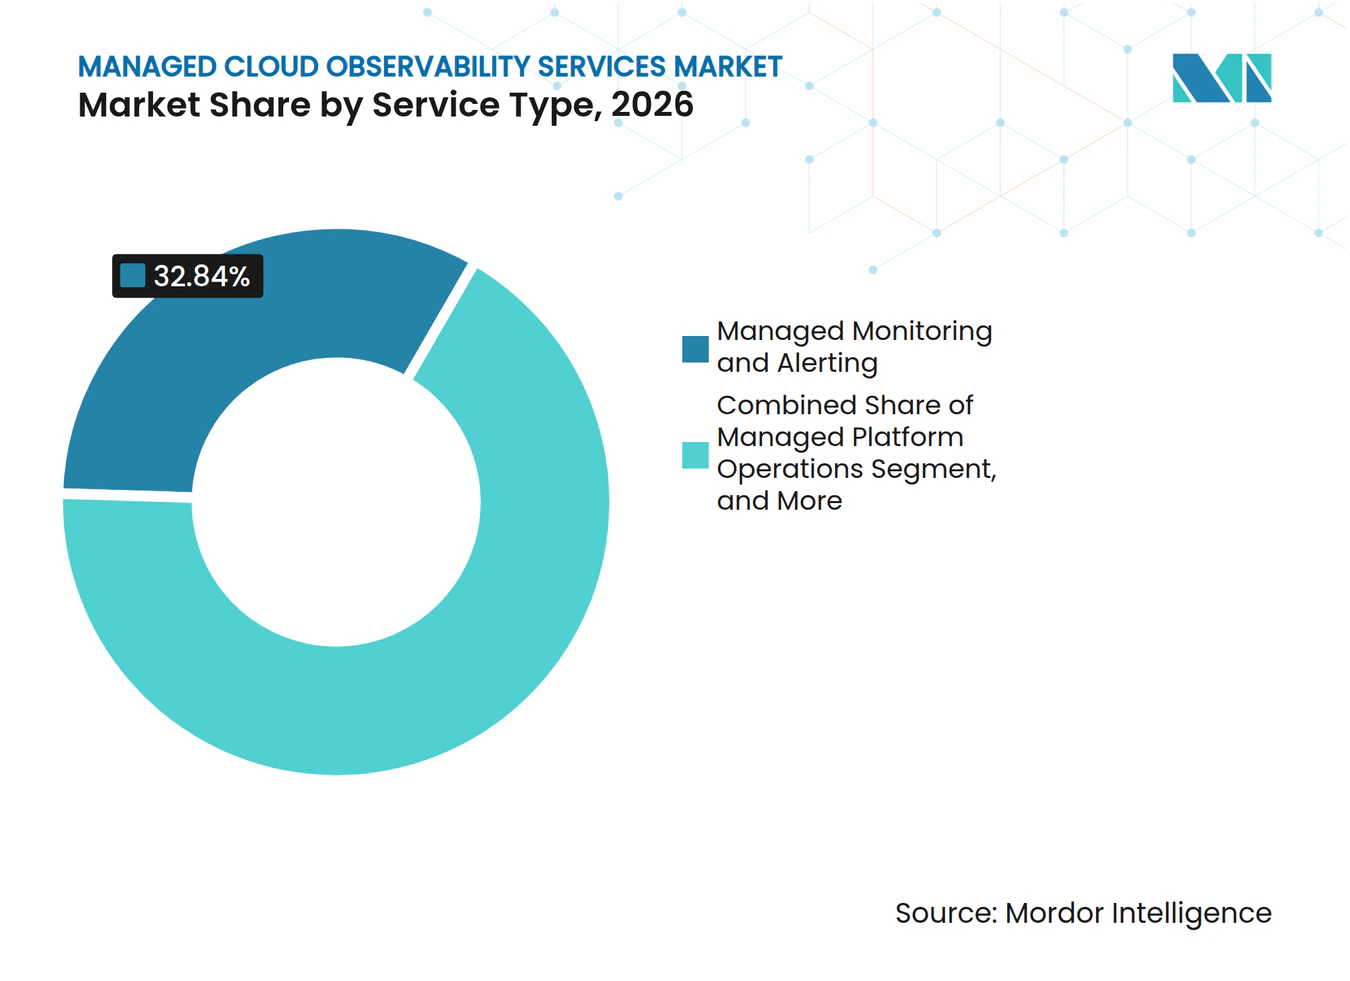
Reliability Engineering Is Gaining Ground on Monitoring FoundationsManaged monitoring and alerting held 32.84% of the Managed cloud observability services market share in 2026. It is the starting point for many engagements because dashboards, alerts, and notification workflows are visible to operations teams every day. Monitoring helps clients identify service issues and establish basic operational control. Platform operations and incident response extend this capability through platform lifecycle management and on-call escalation. Governance, reporting, and compliance are also important for BFSI, healthcare, and public-sector customers with audit obligations.
Managed optimization and reliability engineering is projected to expand at a 22.80% CAGR through 2032. The Managed cloud observability services market size for this service reflects a move from availability measures to capacity efficiency and error-budget management. Kyndryl's offering with Dynatrace combines AI Bridge with more than 7,000 automation playbooks. The work focuses on diagnosis time, alert-noise reduction, and reliability performance. Providers can differentiate by connecting telemetry to these operating outcomes.



By Deployment Model:
Hybrid Architectures Are Challenging Provider-Hosted LeadershipProvider-hosted services accounted for 58.72% of the Managed cloud observability services market size in 2026. This model provides a fully operational platform without requiring clients to manage infrastructure, scale events, or handle upgrade cycles. Grafana Labs reported that the share of organizations using observability software-as-a-service in some capacity rose from 42% in 2025 to a majority in 2026.[4] This supports demand for externally operated platforms among enterprises with established cloud programs. Customer-hosted options remain relevant where clients retain their own compute environment.
Distributed and hybrid-hosted services are projected to expand at a 23.40% CAGR through 2032. Data-residency requirements, edge latency, and regulated workloads can prevent all telemetry from passing through a shared cloud environment. The Managed cloud observability services market, therefore, includes an increasing need for split architectures with managed operational support. Integrated Research introduced dedicated virtual private cloud instances and regional hosting with Prognosis Elevate in November 2025. These designs make cross-environment correlation expertise more valuable to clients.
By Organization Size:
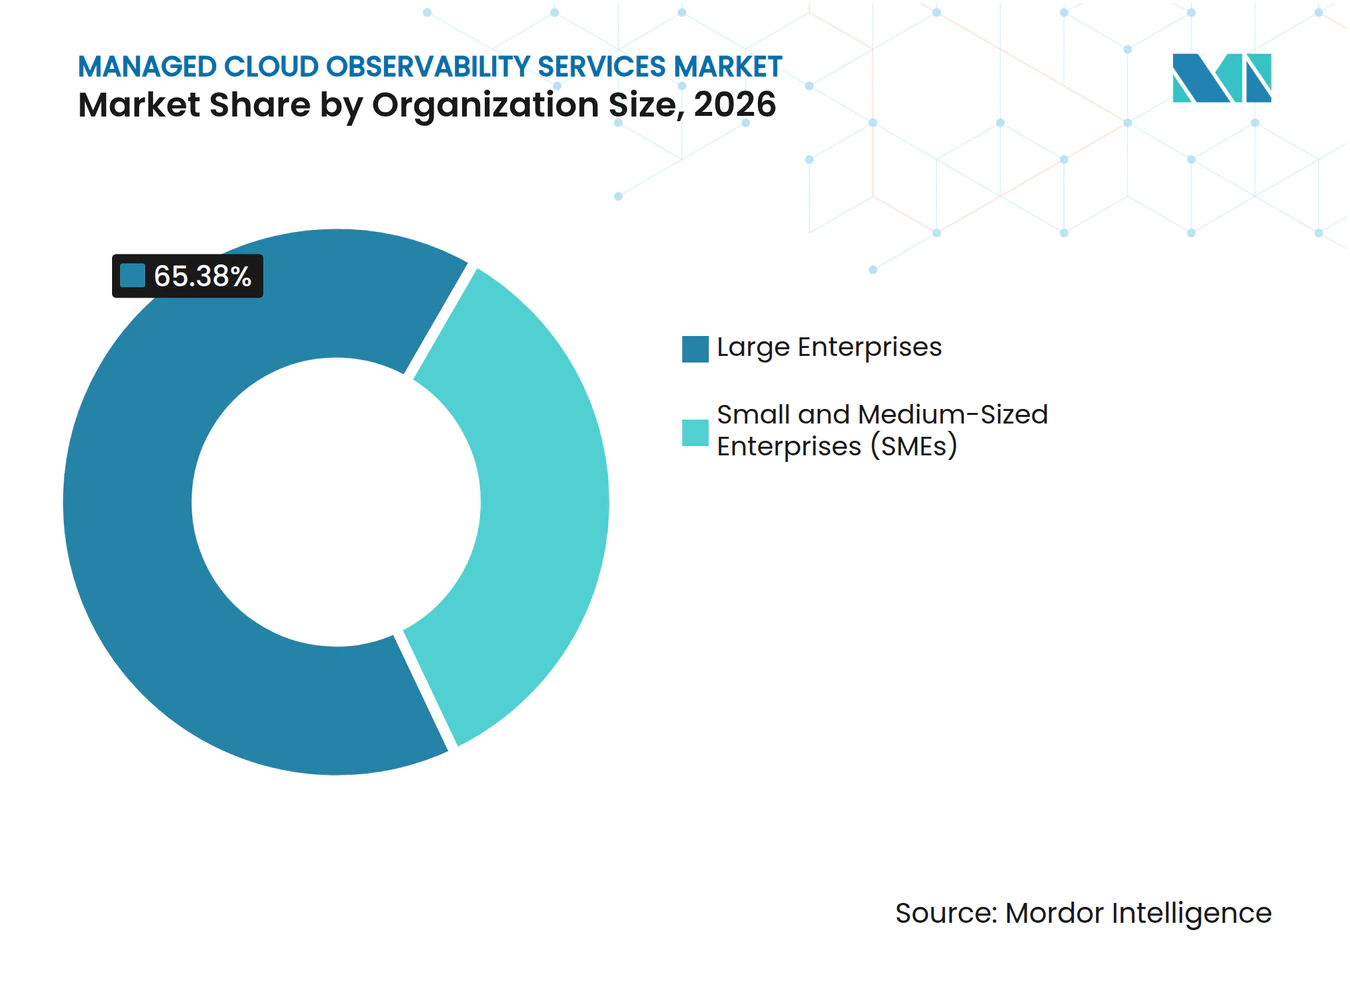
SME Entry Accelerates as Pricing Models EvolveLarge enterprises held 65.38% of revenue in 2026. Their multi-vendor estates and global operating requirements can support broad managed engagements. These organizations may generate billions of telemetry data points each day and require teams that operate across several regions. Kyndryl's Murata Manufacturing agreement covers managed services for 1,000 AWS-hosted systems through June 2029. Such multi-year work shows why large organizations are important accounts in the Managed cloud observability services market.
SMEs are projected to expand at a 20.60% CAGR through 2032. Consumption-based and fixed annual-price options can lower the barrier to entry for companies without a dedicated reliability team. This is relevant to organizations with 50 to 2,000 employees that need cloud-scale operating support. SaaS-native companies, fintech startups, and digital healthcare organizations may need this support while internal SRE capacity remains limited. The Managed cloud observability services industry can expand its client base by offering clear, scoped packages that retain monitoring and incident-response capabilities.

By End-User Industry:
Healthcare Is the Fastest-Growing VerticalIT and telecom accounted for 28.64% of revenue in 2026. Telecom operators and IT service providers often monitor their own systems while supporting client environments. This requires observability across internal platforms and managed estates. BFSI, manufacturing and industrial, retail and e-commerce, government and public sector, energy and utilities, natural resources, media, entertainment, and gaming also contribute to the Managed cloud observability services market. Operational technology convergence and streaming-scale content delivery increase telemetry requirements in these sectors.
Healthcare and life sciences is projected to expand at a 23.10% CAGR through 2032. Healthcare organizations need audit logs, access controls, and breach investigation capabilities for cloud-hosted patient data. Dynatrace expanded HIPAA-compliant observability across AWS, Microsoft Azure, and Google Cloud in June 2026. The Managed cloud observability services market size for healthcare reflects demand for immutable log storage and audit-ready reporting. Providers can protect sensitive telemetry at the pipeline source.
Geography Analysis
North America held 37.42% of the Managed cloud observability services market share in 2026. The region has high multi-cloud use, established outcome-based contracts, and mature site reliability engineering and AIOps activity. Public-sector cloud operations provide an additional source of demand. Kyndryl received a Texas Department of Information Resources contract in March 2026 that gives agencies access to managed services across security, resiliency, cloud, applications, data, and AI.[5]
Europe represents a significant share of the Managed cloud observability services market, with data sovereignty influencing service design. GDPR, the EU Data Act, and the European Health Data Space can lead clients to consider hybrid and customer-hosted architectures. These arrangements can keep telemetry in European jurisdictions. Data residency requirements make regional hosting and client-specific models important. Managed designs can retain local control while supporting cross-environment visibility.
Asia-Pacific is projected to expand at a 22.20% CAGR through 2032. New Relic reported that AI was the region's leading driver of observability investment and that high-impact outages cost USD 2.2 million on average, compared with USD 1.8 million globally. India showed high urgency, with 31% of organizations reporting multiple business-impacting outages several times each day. Grafana Labs expanded Grafana Cloud to AWS Tokyo in January 2026 for Japanese data-sovereignty preferences. South Korea, Australia, Southeast Asia, China, South America, the Middle East, and Africa are building demand as cloud complexity rises faster than internal capacity.
Competitive Landscape
Market Concentration
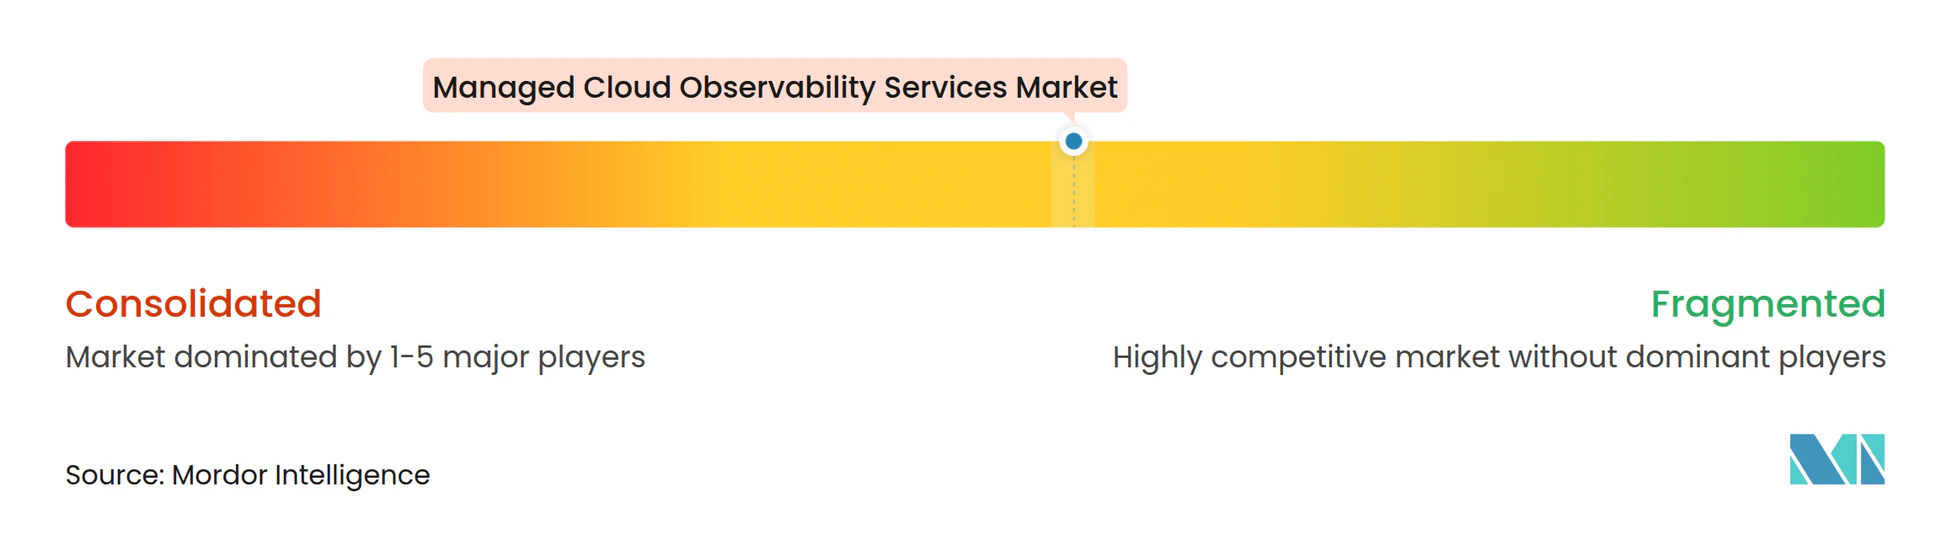
The Managed cloud observability services market is moderately consolidated among leading global IT services firms. Kyndryl, IBM, Accenture, Infosys, TCS, Wipro, HCL Technologies, and Cognizant compete for large contracts through delivery scale, platform partnerships, and automation. Their services often combine AIOps with tools from Dynatrace, Splunk, and New Relic. Kyndryl has disclosed more than 7,000 automation playbooks in its AI Bridge platform.
Infosys and LogicMonitor announced a collaboration in May 2025 targeting 30% faster diagnosis and 70% fewer redundant alerts. Accenture Federal Services deployed a Managed Enterprise Platform using Splunk Enterprise for a U.S. federal financial agency. Wipro was selected by Vorwerk in 2025 for a 5-year transformation to consolidate applications, infrastructure, and cybersecurity workloads onto a unified monitoring platform. These moves show how large providers extend observability into broader managed contracts.
Rackspace Technology, NTT DATA, Mission Cloud Services, Ensono, cloudEQ, and DXC Technology compete through hyperscaler alignment, cloud-native delivery, and mid-market pricing. Rackspace introduced a consumption-based Cloud Management Platform with intent-driven automation in August 2025. The Managed cloud observability services market still has room for AI factory operations, GPU governance, LLM inference latency, and agentic AI observability. No listed company has disclosed a dominant position in these specialized services. Their competitive position depends on how effectively they combine specialized capabilities with cost-conscious delivery.
Managed Cloud Observability Services Industry Leaders
-
Accenture plc
-
IBM Corporation
-
Amazon Web Services, Inc.
-
Microsoft Corporation
-
Cisco Systems, Inc.
- *Disclaimer: Major Players sorted in no particular order
Managed Cloud Observability Services Market Companies Covered in this Report
- Accenture plc
- Amazon Web Services, Inc.
- Atos SE
- Canonical Group Limited
- cloudEQ Inc.
- Cognizant Technology Solutions Corporation
- Deloitte Touche Tohmatsu Limited
- DXC Technology Company
- HCL Technologies Limited
- IBM Corporation
- Infosys Limited
- Cisco Systems, Inc.
- Microland Limited
- Mission Cloud Services, Inc.
- NETbuilder Limited
- NTT DATA, Inc.
- Rackspace Technology, Inc.
- Tata Consultancy Services Limited
- Tech Mahindra Limited
- Wipro Limited
Recent Industry Developments in Managed Cloud Observability Services Market
- October 2026: Canon IT Solutions launched an observability service and an incident management service under its SOLTAGE MSP brand in Japan, using Dynatrace's AI-driven platform to deliver system-wide visualization and faster incident response across on-premises, cloud, and SaaS environments.
- September 2026: New Relic overhauled its Google Cloud Platform monitoring integration for the Japan market, launching "Google Cloud Platform Observability" in August 2026 to deliver security-enhanced, real-time observability architecture at parity with its AWS integration, extending multicloud managed observability support across all 3 major hyperscalers for Japanese enterprise clients.
- June 2026: NTT DATA formally assumed the Texas Department of Information Resources' Public Cloud Manager role under contract DIR-STS-PCM-513, displacing Rackspace Technology. The multiyear agreement covers managed cloud services across AWS, Microsoft Azure, Google Cloud, and Oracle for Texas state agencies, with year-1 AWS discounts of 21% and a mandate to deliver visibility, transparency, and cloud governance tools to state organizations.
- April 2026: BeeX and SB C&S jointly launched the "BeeXPlus MSP Monitoring Service" in Japan, a fixed annual-price managed monitoring package for multi-cloud environments providing 24×7 alert response with predictable cost structures.
Global Managed Cloud Observability Services Market Report Scope
The Managed Cloud Observability Services Market encompasses third-party managed services that support continuous monitoring, operations, reliability, performance optimization, and governance of cloud-based applications, infrastructure, and distributed IT environments. The market includes Managed Platform Operations, Managed Monitoring and Alerting, Managed Incident Response and On-Call, Managed Optimization and Reliability Engineering, and Managed Governance, Reporting, and Compliance. These services encompass observability platform administration, telemetry management, proactive anomaly detection, incident triage and resolution, site reliability engineering (SRE), performance optimization, service-level monitoring, and compliance reporting. Market revenue includes recurring managed service fees and directly associated operational support charges, while excluding standalone observability software subscriptions, infrastructure consumption charges, and one-time consulting or implementation services not bundled with ongoing managed operations.
The Managed Cloud Observability Services Market Report is segmented by Service Type (Managed Platform Operations, Managed Monitoring and Alerting, Managed Incident Response and On-Call, Managed Optimization and Reliability Engineering, and Managed Governance, Reporting, and Compliance), Deployment Model (Provider-Hosted Managed Observability Services, Customer-Hosted Managed Observability Services, and Distributed and Hybrid-Hosted Managed Observability Services), Organization Size (Small and Medium-Sized Enterprises and Large Enterprises), End-User Industry (Banking, Financial Services, and Insurance; IT and Telecom; Healthcare and Life Sciences; Retail and E-Commerce; Manufacturing and Industrial; Government and Public Sector; Energy, Utilities, and Natural Resources; Media, Entertainment, and Gaming; and Other End-User Industries), and Geography (North America, South America, Europe, Asia-Pacific, Middle East, and Africa). Market sizes and forecasts are presented in value terms (USD).
Segmentation Overview
| Managed Platform Operations |
| Managed Monitoring and Alerting |
| Managed Incident Response and On-Call |
| Managed Optimization and Reliability Engineering |
| Managed Governance, Reporting, and Compliance |
| Provider-Hosted Managed Observability Services |
| Customer-Hosted Managed Observability Services |
| Distributed and Hybrid-Hosted Managed Observability Services |
| Small and Medium-Sized Enterprises (SMEs) |
| Large Enterprises |
| Banking, Financial Services, and Insurance |
| IT and Telecom |
| Healthcare and Life Sciences |
| Retail and E-Commerce |
| Manufacturing and Industrial |
| Government and Public Sector |
| Energy, Utilities, and Natural Resources |
| Media, Entertainment, and Gaming |
| Other End-user Industries |
| North America | United States |
| Canada | |
| Mexico | |
| South America | Brazil |
| Argentina | |
| Rest of South America | |
| Europe | United Kingdom |
| Germany | |
| France | |
| Italy | |
| Spain | |
| Rest of Europe | |
| Asia-Pacific | China |
| Japan | |
| India | |
| South Korea | |
| Australia | |
| Rest of Asia-Pacific | |
| Middle East | United Arab Emirates |
| Saudi Arabia | |
| Rest of Middle East | |
| Africa | South Africa |
| Nigeria | |
| Rest of Africa |
| By Service Type | Managed Platform Operations | |
| Managed Monitoring and Alerting | ||
| Managed Incident Response and On-Call | ||
| Managed Optimization and Reliability Engineering | ||
| Managed Governance, Reporting, and Compliance | ||
| By Deployment Model | Provider-Hosted Managed Observability Services | |
| Customer-Hosted Managed Observability Services | ||
| Distributed and Hybrid-Hosted Managed Observability Services | ||
| By Organization Size | Small and Medium-Sized Enterprises (SMEs) | |
| Large Enterprises | ||
| By End-User Industry | Banking, Financial Services, and Insurance | |
| IT and Telecom | ||
| Healthcare and Life Sciences | ||
| Retail and E-Commerce | ||
| Manufacturing and Industrial | ||
| Government and Public Sector | ||
| Energy, Utilities, and Natural Resources | ||
| Media, Entertainment, and Gaming | ||
| Other End-user Industries | ||
| By Geography | North America | United States |
| Canada | ||
| Mexico | ||
| South America | Brazil | |
| Argentina | ||
| Rest of South America | ||
| Europe | United Kingdom | |
| Germany | ||
| France | ||
| Italy | ||
| Spain | ||
| Rest of Europe | ||
| Asia-Pacific | China | |
| Japan | ||
| India | ||
| South Korea | ||
| Australia | ||
| Rest of Asia-Pacific | ||
| Middle East | United Arab Emirates | |
| Saudi Arabia | ||
| Rest of Middle East | ||
| Africa | South Africa | |
| Nigeria | ||
| Rest of Africa | ||
Key Questions Answered in the Report
What is the Managed cloud observability services market size?
The market size is projected to increase from USD 0.52 billion in 2026 and USD 0.61 billion in 2027 to USD 1.34 billion by 2032, at a 17.51% CAGR over the forecast period.
What is driving demand for managed cloud observability services?
Multi-cloud complexity, AI workload visibility needs, and a shortage of specialized engineering talent are increasing demand for externally managed operations.
Which service type leads managed cloud observability services?
Managed monitoring and alerting leads with a 32.84% share in 2026, while optimization and reliability engineering has the highest projected CAGR of 22.80% through 2032.
Which deployment model is expanding fastest?
Distributed and hybrid-hosted services are projected to expand at a 23.40% CAGR through 2032 because regulated and edge workloads need more flexible telemetry architectures.
Which end-user sector has the highest projected expansion?
Healthcare and life sciences is projected to expand at a 23.10% CAGR through 2032, supported by audit, data-protection, and compliance requirements.
Which region has the highest projected expansion?
Asia-Pacific is projected to expand at a 22.20% CAGR through 2032, supported by AI investment, outage costs, and increasing cloud complexity.