
Market Overview
| Study Period | 2020 - 2031 |
|---|---|
| Forecast Data Period | 2026 - 2031 |
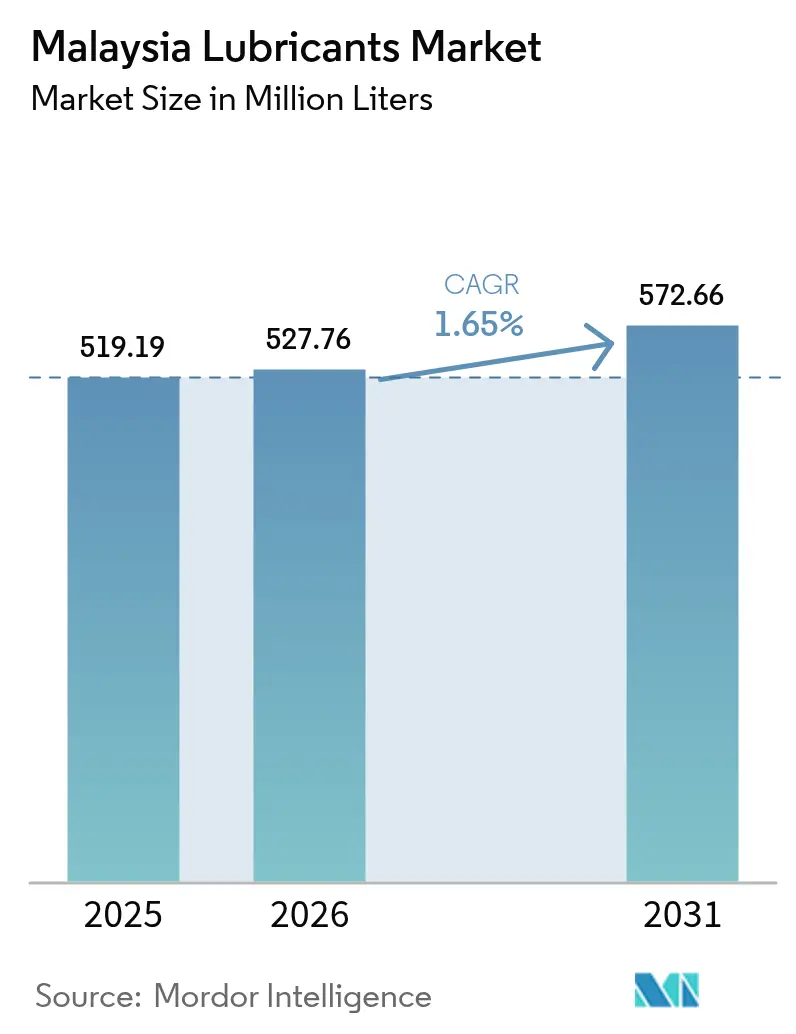
| Base Year Market Size (2025) | 519.19 Million liters |
| Market Volume (2026) | 527.76 Million liters |
| Market Volume (2031) | 572.66 Million liters |
| Growth Rate (2026 - 2031) | 1.65 % |
| Market Concentration | High |
Major Players *Disclaimer: Major Players sorted in no particular order Image © Mordor Intelligence. Reuse requires attribution under CC BY 4.0. | |
Malaysia Lubricants Market Analysis by Mordor Intelligence
Malaysia Lubricants Market size in 2026 is estimated at 527.76 million liters, growing from 2025 value of 519.19 million liters with 2031 projections showing 572.66 million liters, growing at 1.65% CAGR over 2026-2031. Growth remains steady rather than spectacular because the market is already mature, yet it benefits from a wider vehicle parc, new manufacturing capacity, and infrastructure spending that require dependable fluid performance. Passenger cars dominate the national fleet, making Malaysia the only ASEAN country where four-wheelers outnumber two-wheelers, which lifts demand for premium engine oils. Government execution of the 12th Malaysia Plan and the National Industrial Master Plan 2030 (NIMP 2030) adds incremental volume in industrial, construction, and high-tech manufacturing applications. Meanwhile, the electric-vehicle (EV) rollout, longer drain intervals, and rising equipment efficiency limit total volume growth, prompting suppliers to shift toward higher-value synthetic and specialty formulations rather than bulk mineral grades.
Key Report Takeaways
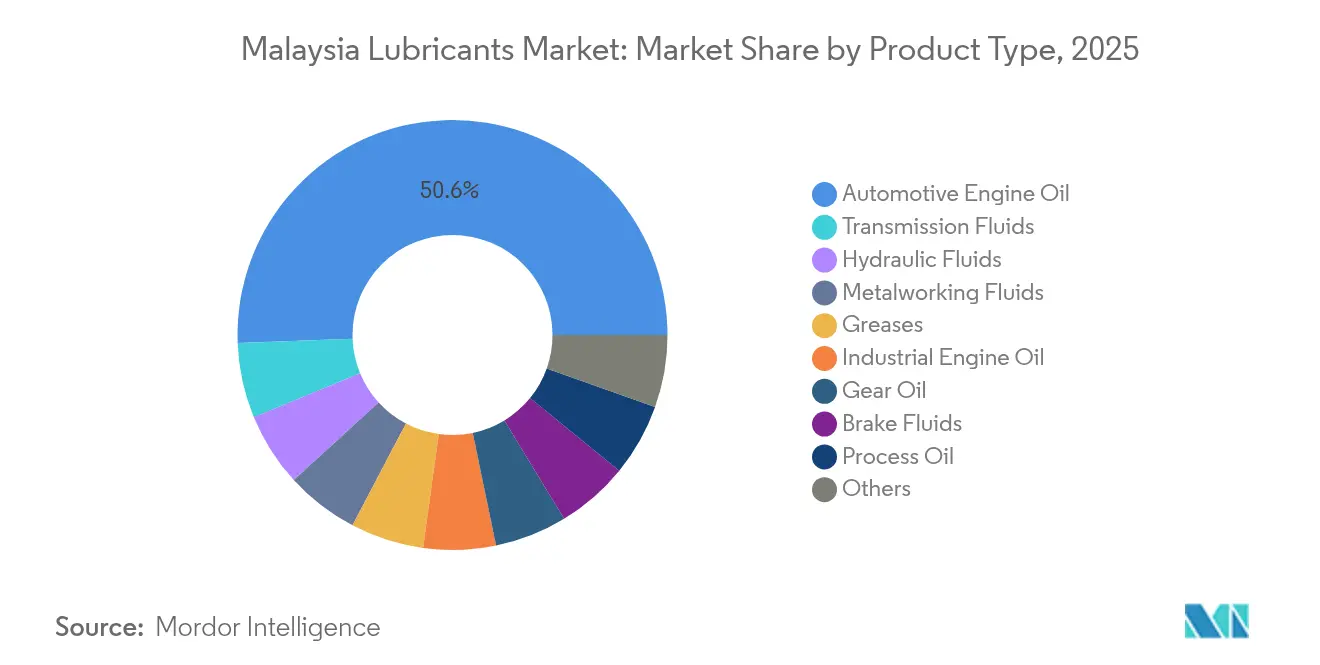
- By product type, automotive engine oil accounted for 50.60% of Malaysia's lubricants market share in 2025. Transmission fluids are projected to experience the fastest product-level expansion, at a 2.50% CAGR, between 2026 and 2031.
- By end-user industry, the automotive segment led with 69.65% revenue share in 2025, while industrial applications are forecast to expand at a 2.87% CAGR through 2031.
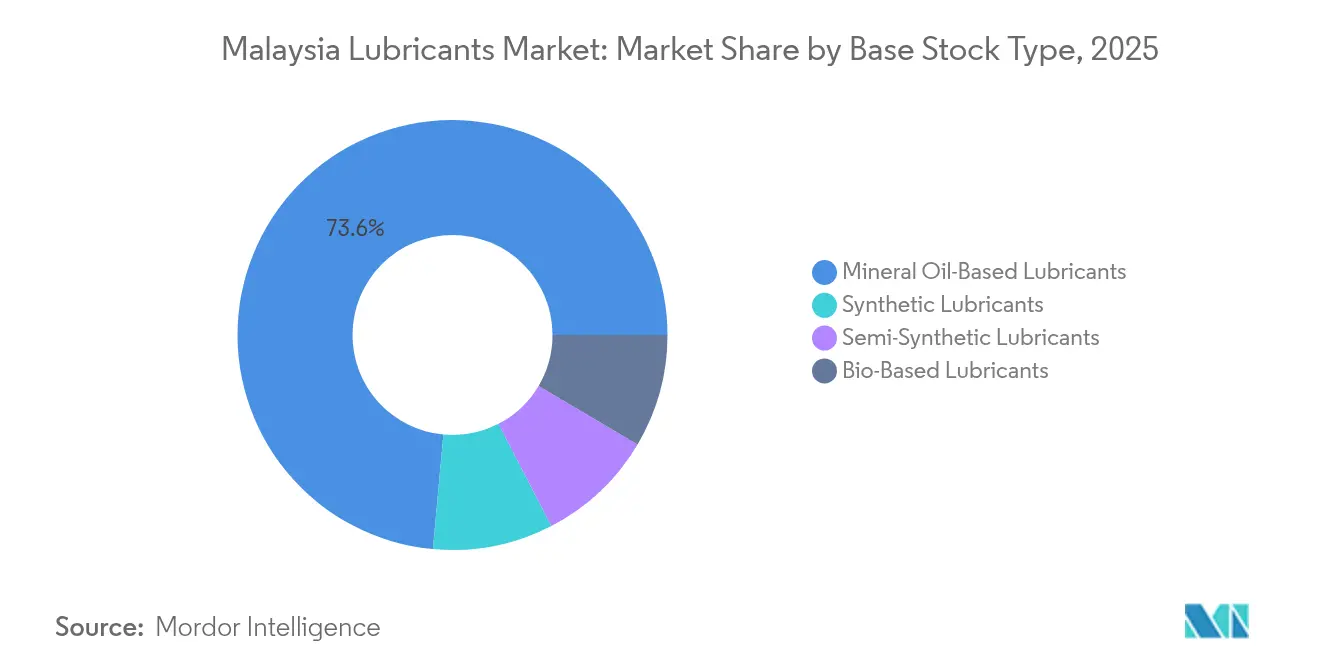
- By base-stock type, mineral-oil grades captured 73.55% of the Malaysian lubricants market size in 2025; however, synthetic formulations are projected to grow at a 2.14% CAGR through 2031.
Note: Market size and forecast figures in this report are generated using Mordor Intelligence’s proprietary estimation framework, updated with the latest available data and insights as of 2026.
Malaysia Lubricants Market Trends and Insights
Drivers Impact Analysis*
| Drivers | (~) % Impact on CAGR Forecast | Geographic Relevance | Impact Timeline |
|---|---|---|---|
| Rising vehicle parc and new-car sales | +0.8% | National, concentrated in Peninsular Malaysia | Medium term (2-4 years) |
| Industrial and infrastructure expansion | +0.6% | National, with early gains in Johor, Selangor, Penang | Long term (≥ 4 years) |
| Shift toward synthetic/high-performance lubricants | +0.4% | National, premium segments in urban centers | Long term (≥ 4 years) |
| Government mega-projects under 12th Malaysia Plan | +0.3% | National infrastructure corridors | Medium term (2-4 years) |
| E-commerce emergence for lubricant retail (Tier-2 cities) | +0.2% | Tier-2 cities, rural distribution networks | Short term (≤ 2 years) |
| Source: Mordor Intelligence | |||
Rising Vehicle Parc and New-Car Sales Drive Sustained Demand
Total vehicle sales reached 816,747 units in 2024, a 2.1% gain that supports lubricant volume growth despite market maturity[1]Malaysian Automotive Association, “Total Industry Volume 2024,” maa.org.my. Passenger cars already outnumber two-wheelers, so demand shifts toward higher-grade automotive engine oils rather than motorcycle lubricants. The implementation of Euro 5 fuel standards prompts workshops and motorists to switch to low-sulfur, full-synthetic formulations that protect catalytic after-treatment systems. Commercial vehicles also contribute because larger sump capacities and stricter fleet maintenance schedules offset slower passenger-car sales growth. Industry associations expect continuous parc expansion through 2030, particularly in the Klang Valley, Penang, and Johor, anchoring base-level consumption.
Industrial and Infrastructure Expansion Under 12th Malaysia Plan
Malaysia aims to create 700,000 high-skill manufacturing jobs by 2030 and double its high-tech export share to 6%[2]ASEAN+3 Macroeconomic Research Office, “NIMP 2030 and Semiconductors,” amro-asia.org. Semiconductor, electronics, and petrochemical projects require reliable hydraulic fluids, metalworking fluids, and process oils that withstand stringent clean-room or high-temperature environments. Manufacturing investments reached RM152 billion in 2023, with foreign investors accounting for nearly 70% of the chemical sector's capital inflows, indicating confidence in continued industrial growth. Infrastructure projects, such as the Johor-Singapore Special Economic Zone, East Coast Rail Link, and Pengerang Integrated Complex, increase lubricant demand for construction machinery, heavy-duty engines, and petrochemical equipment throughout the build-out phase and in routine plant operations.
Synthetic and High-Performance Lubricant Adoption Accelerates
Turbocharging, direct injection, and tightened emissions rules require low-volatility, high-temperature-stable lubricants. Euro 5 compliance forces workshops to recommend low-SAPS and low-sulfur products that resist oxidation while protecting after-treatment systems. PETRONAS introduced the Iona e-fluid series in 2025 to serve EV transmissions, battery thermal management, and specialty greases. Academia has confirmed that nanoparticle-enhanced palm-oil esters can cut friction by 26-34%, presenting local feedstock pathways for sustainable high-performance grades. This shift improves average unit value even as total liters sold rise slowly.
Government Mega-Projects Create Infrastructure Lubricant Demand
The 12th Malaysia Plan allocates multi-billion-ringgit outlays across roads, mass transit, and industrial corridors. Pengerang Integrated Complex received RM7.5 billion and hosts world-scale refining and petrochemical assets that both consume and manufacture base oils. Heavy-equipment fleets engaged on rail lines, industrial zones, and port expansions need hydraulic fluids, gear oils, and greases with high load-carrying capacity and all-weather operability. Sabah and Sarawak mining developments similarly depend on severe-duty engine oils for excavators and haul trucks. The National Energy Transition Roadmap adds niche demand for turbine oils and dielectric fluids used in wind and grid-scale battery installations.
Restraints Impact Analysis*
| Restraints | (~) % Impact on CAGR Forecast | Geographic Relevance | Impact Timeline |
|---|---|---|---|
| Longer oil-drain intervals and engine efficiency gains | -0.4% | National, accelerated in urban areas with newer vehicles | Medium term (2-4 years) |
| Accelerating electric-vehicle adoption | -0.3% | National, concentrated in Klang Valley and major cities | Long term (≥ 4 years) |
| Crude-oil price volatility pressuring margins | -0.2% | National, affecting all market participants | Short term (≤ 2 years) |
| Source: Mordor Intelligence | |||
Longer Oil-Drain Intervals Constrain Volume Growth
Modern synthetics enable drain intervals of 15,000-20,000 kilometers on a single fill, compared with 5,000-10,000 kilometers for older mineral formulations. This sharply lowers annual liter consumption per vehicle, even though the number of kilometers driven continues to rise. Fleet managers rely on in-service oil analysis to extend drains without compromising warranty coverage. Consequently, volume erosion within entry-level mineral categories offsets gains from the rising car population, and producers bolster revenues by marketing higher-margin full synthetics. Workshops adapt by offering bundled services—such as filter changes, alignment, and cabin-air filtration—to compensate for reduced lubricant frequency.
Electric Vehicle Adoption Reshapes Long-Term Demand Patterns
Despite a low current market share, federal incentives and the expansion of charging networks are accelerating adoption in major cities. EVs remove conventional engine oil demand but create needs for e-gear oils, dielectric coolants, and greases engineered for electromagnetic compatibility. PETRONAS, Grantt, and several independents launched EV-specific fluids in 2024-25 to address this emerging segment. Heavy-duty electrification lags because payload and range constraints still favor diesel; therefore, diesel engine oils remain a stable backbone of the Malaysia lubricants market through the forecast horizon.
*Our forecasts treat driver/restraint impacts as directional, not additive. The impact forecasts reflect baseline growth, mix effects, and variable interactions.
Segment Analysis
By Product Type: Automotive Engine Oil Dominance Faces Transmission Fluid Growth
Automotive engine oil accounted for 50.60% of the Malaysia lubricants market share in 2025. A large and growing car population sustains baseline demand, while stricter OEM specifications accelerate the migration from API SN to SP and ILSAC GF-6 categories, which offer higher oxidative stability. Transmission fluids are the fastest-growing product, registering a 2.50% CAGR as automatic, dual-clutch, and continuously variable gearboxes proliferate. Hybrid vehicles further expand this need due to dedicated e-transmission lubrication circuits. The Malaysian lubricants market size, linked to hydraulic fluids, metalworking fluids, and process oils, also rises because semiconductor plants, precision machining centers, and chemical complexes require contamination-free operations and extended fluid life.



By End-User Industry: Automotive Leadership Challenged by Industrial Growth
Automotive applications retained a 69.65% share in 2025, reflecting the high passenger-car base and routine maintenance culture among Malaysian drivers. Industrial demand grows at the fastest rate of 2.87% CAGR as investors pour capital into electronics assembly, data center infrastructure, and chemicals. The Malaysian lubricants market size for heavy equipment includes hydraulic and gear oils used in construction machinery, as well as on rail, power, and port projects. Marine consumption is steady thanks to bunkering activities in Port Klang and offshore exploration and production operations in Sabah and Sarawak. Aerospace and MRO volumes remain comparatively small but contain stringent quality requirements that elevate unit values.
By Base Stock Type: Mineral Oil Dominance Faces Synthetic Transition
Mineral oil grades represented 73.55% of the total liters in 2025, due to their lower cost per change and wide availability. Synthetic volumes climb at a 2.14% CAGR as OEMs shift warranty specifications and motorists prioritize fuel efficiency. Semi-synthetics cater to cost-sensitive segments that require partial performance gains, bridging the transition. Bio-based lubricants, anchored in palm-oil esters, remain a niche market but demonstrate functional parity in flash point and viscosity index tests, offering a path toward sustainable sourcing when supported by RSPO certification and localized additive packages.
Geography Analysis
Peninsular Malaysia contributes the bulk of consumption, led by the Klang Valley, where high vehicle density, industrial parks, and port traffic converge. Johor’s lubricant demand accelerates alongside the Pengerang complex and cross-border trade with Singapore. Northern states, such as Penang, benefit from electronics manufacturing clusters, driving up precision metalworking fluid volumes. Sabah and Sarawak have specialized needs for marine, mining, and upstream oil service lubricants, although distribution costs are higher due to the distance. E-commerce adds incremental reach into Tier-2 towns and rural areas, smoothing regional disparities in product availability.
Regulatory Landscape
Malaysia regulates lubricants through consumer-protection labeling, product standards, and environmental controls on used oil. A key recent change is the Trade Descriptions (Certification and Marking of Engine Oil for Motor Vehicle) Order 2024, enforced from April 2025, which makes the SIRIM label compulsory for engine lubricants marketed in Malaysia and requires certification via SIRIM QAS International to curb counterfeit products. Petron Malaysia received a SIRIM Genuine Product License in September 2025 under this scheme.
On environmental compliance, the Department of Environment (DOE) administers the Environmental Quality Act 1974 and related scheduled-waste rules. Waste oil is treated as scheduled waste, and recovery facilities need licensing. The DOE also publishes specifications for recovered waste oil (including maximum contaminant limits such as Lead 100 ppm, Arsenic 5 ppm, and Cadmium 2 ppm). The Department of Standards Malaysia (including the Industry Standards Committee on Petroleum and Gas, ISC H) supports the development of Malaysian Standards that complement OEM and international performance categories used in the market.
Value Chain Analysis
The Malaysia lubricants value chain starts with base oils and additive packages, then moves into blending, packaging, and multi-channel distribution to automotive, industrial, marine, and heavy-equipment users. The supply base combines domestic production and imports, with higher-performance base stocks (Group II/III) and advanced additives more dependent on imports. Integrated players such as PETRONAS, through PETRONAS Lubricants International, link upstream and downstream capabilities and help stabilize availability for premium formulations.
Blending and private or OEM supply are handled by large brands and local manufacturers, including PETRONAS Lubricants International and local blenders such as Weblube Group, JP Lubricant Group, and Enerlube Group. Go-to-market routes cover fuel-station networks and workshops for passenger vehicles, direct or contract supply for fleets and industrial plants, and growing e-commerce reach into Tier-2 towns. With tighter authenticity requirements around SIRIM-labeled engine oils, traceable distribution and compliant packaging and marking become more important for both local and imported products.
Competitive Landscape
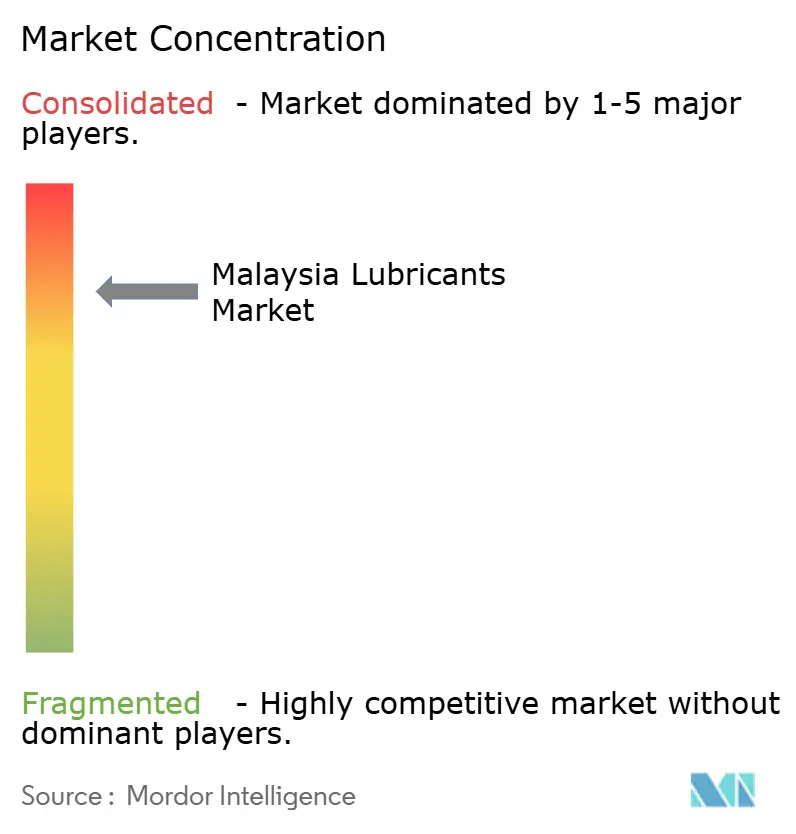
The Malaysia Lubricants Market is consolidated in nature. PETRONAS retains domestic leadership through end-to-end integration that spans crude production, base-oil refining, blending, and retailing across its national service-station footprint. Shell, ExxonMobil, Castrol, and Chevron maintain strong brand equity and broader OEM endorsements, fueling intense rivalry in passenger-car and heavy-duty segments. Shell’s adoption of PurePlus gas-to-liquid technology for API SQ compliance differentiates its top-tier engine oils. Local blenders such as UMW Lubetech, which commissioned a 60 million-liter facility in 2023, compete on price and customized formulations, particularly in industrial oils and greases.
Malaysia Lubricants Industry Leaders
Shell plc
Petroliam Nasional Berhad (PETRONAS)
BP Plc (Castrol)
Exxon Mobil Corporation
TotalEnergies
- *Disclaimer: Major Players sorted in no particular order

Market Opportunities and Future Outlook
Compliance-driven formalization is creating whitespace for branded, fully traceable engine oils, because the compulsory SIRIM label enforcement (effective April 2025) raises the operational bar for importers, packers, and parallel channels. That shift pushes purchasing toward authenticated supply chains, creating room for workshops, distributors, and manufacturers that can document certification, batch traceability, and consistent product performance across API and ILSAC-aligned grades used by newer passenger cars.
Industrial and specialty fluids are a second opportunity area, supported by named initiatives and product moves linked to Malaysia's industrial agenda and electrification. PETRONAS Activity Outlook 2026-2028 highlights a strategic shift toward specialty chemicals and specialized fluids (including PETRONAS Iona for EV-related needs and data center cooling). PETRONAS Lubricants International also launched the PETRONAS Pro Series in Kuala Lumpur in April 2026 as a flagship industrial lubricant range. In parallel, transformer or insulating oils and broader circularity services around used-oil collection and compliant recovery align with DOE oversight of waste oil as scheduled waste, offering capable players differentiation beyond commodity mineral volumes.
Recent Industry Developments
- April 2026: PETRONAS Lubricants International launched the PETRONAS Pro Series as a new flagship industrial lubricant range at a trade engagement session in Kuala Lumpur. The range increases focus on higher-value industrial formulations in a mature volume market and supports deeper penetration into manufacturing and infrastructure end users.
- June 2025: BP Plc initiated the sale process for its Castrol lubricants business as part of a wider divestment program targeted for completion by 2027. Any change in ownership has implications for brand investment, distributor strategies, and competitive intensity in premium automotive and industrial lubricants in Malaysia.
- April 2024: PETRONAS Lubricants International signed a collaboration agreement with Glide Technology Sdn Bhd to manufacture and distribute PETRONAS Tranol Glide premium insulating oils in Malaysia. Strengthening local availability of insulating oils supports demand tied to power equipment and grid assets, reinforcing PETRONAS presence in specialty electrical and industrial lubricant applications.


Research Methodology Framework and Report Scope
Market Definition and Coverage
For this study, the Malaysia lubricants market is defined as the lubricating oils and greases consumed within Malaysia across automotive and industrial applications, measured as total demand and translated into value using application-level pricing assumptions.
Scope exclusions: We exclude fuels, base oils traded without finished lubricant formulation, and aftermarket additives sold as standalone chemical products.
Segmentation Overview
- By Product Type
- Automotive Engine Oil
- Industrial Engine Oil
- Transmission Fluids
- Gear Oil
- Brake Fluids
- Hydraulic Fluids
- Greases
- Process Oil (Including Rubber Process Oil and White Oil)
- Metalworking Fluids
- Turbine Oil
- Transformer Oil
- Other Product Types
- By End-user Industry
- Automotive
- Passenger Vehicles
- Commercial Vehicles
- Two-Wheelers
- Marine
- Aerospace
- Heavy Equipment
- Construction
- Mining
- Agriculture
- Industrial
- Power Generation
- Metallurgy and Metalworking
- Textiles
- Oil and Gas
- Other End-Use Industries
- Automotive
- By Base Stock Type
- Mineral Oil-Based Lubricants
- Synthetic Lubricants
- Semi-Synthetic Lubricants
- Bio-Based Lubricants
Data Sources, Market Sizing, and Validation
Desk Research
Desk work started with building a clean view of lubricant demand drivers in Malaysia, and then mapping them to where lubricants are actually consumed. We relied on public data series such as Department of Statistics Malaysia publications, Bank Negara Malaysia macro indicators, customs trade statistics, and transport and vehicle registration releases from agencies such as JPJ. We also reviewed standards and technical references (such as SAE viscosity and API performance categories) because product mix changes can move average selling prices even when liters grow slowly.
To convert demand indicators into a market model, we used secondary sources such as company annual reports, investor presentations, distributor announcements, and reputable press coverage on plant expansions, blending capacity, and industrial activity. In a few spots, subscription databases were used for company financials and intelligence, patent checks, and shipment-level import/export signals to cross-check material flows. The desk sources listed above are illustrative only, and many other public references were used to collect data, validate assumptions, and clarify gaps.
Primary Interviews and Surveys
Primary work focused on validating the real consumption pattern behind the desk indicators, especially by end-use, channel mix, and price realization. We spoke with lubricant blenders, importers, distributors, workshops, fleet and industrial maintenance teams, and trade experts so the model could be corrected where published statistics lag or use different classifications. For Malaysia, the emphasis was placed on capturing differences in drain intervals, synthetic penetration, and industrial maintenance cycles, which were then used to tighten volume and pricing assumptions.
Distribution of primary research fieldwork respondents
| Company type | Respondent position |
|---|---|
| Top tier: 33% | CXOs: 14% |
| Mid tier: 53% | Functional/Unit leaders: 37% |
| Smaller Players: 14% | Managers: 49% |
Market-Sizing & Forecasting
Sizing was built using a top-down and bottom-up mix, where national demand is reconstructed from the key lubricant consuming pools in the country and then checked with supplier and channel signals. On the top-down side, we used vehicle parc and usage patterns, industrial output and machinery intensity, the share of synthetic versus mineral formulations, and average drain intervals to translate activity into liters. Because the market is sensitive to product mix, the pricing layer was applied by use case, where typical pack size, OEM-grade requirements, and workshop versus direct industrial supply differences were considered.
To keep totals realistic, selective bottom-up checks were added, such as roll-ups from a sampled set of blenders and importers, distributor throughput discussions, and a sanity check using typical ASP multiplied by estimated liters for major application buckets. Where gaps remained (for example, fragmented workshop demand), we used penetration and replacement-rate logic and then re-tested the output with interview feedback. Forecasting was done using scenario analysis, where macro indicators, vehicle additions, manufacturing momentum, and expected shifts toward longer drain oils were varied and then aligned to what most primary respondents considered a practical path.
Data Validation & Update Cycle
We validated the model through several rounds of checks so the final numbers do not rely on one data stream. Outputs were compared against independent signals such as lubricant import trends, industrial activity movements, and reported changes in vehicle registrations, and any sharp variance was re-opened. When an outlier appeared, assumptions were reviewed, the math was rechecked, and the relevant respondents were contacted again to confirm whether a structural change had occurred.
Before publication, the estimate goes through internal analyst review steps, including unit consistency checks between liters and value, and a final scan for currency and timing alignment. Reports are refreshed annually, and interim updates are triggered when material events occur, such as major pricing shifts, regulation-driven formulation changes, or large capacity moves. Right before delivery, a fresh analyst pass is completed so clients receive the most current view available.
Mordor Intelligence's Malaysia Lubricants Market Size Measured Against Other Published Estimates
It is common to see different published market sizes for Malaysia lubricants because the market can be measured in liters or value, and because product boundaries are not always aligned across sources. Differences also come from how analysts treat workshop-driven demand, industrial direct supply, and whether price is modeled as a single average or by application.
The spread usually widens when price timing and currency conversion are handled differently, or when older price points are carried forward without being revalidated with channel feedback. By locking the ASP update cadence to recent pack-price checks and applying a consistent FX timing rule, followed by re-contacting sources when model outputs drift, the final number is kept more stable year to year, which is a refresh choice applied by Mordor Intelligence.
Benchmark comparison
| Source | Market Size | Gaps in Research Methodology |
|---|---|---|
| Mordor Intelligence | USD 0.52 B (2025) | |
| Regional Consultancy A | USD 0.43 B (2025) | Often uses a single blended price for all lubricant types and may assume faster shifts to longer drain intervals, which can understate value when premium grades grow. |
| Trade Journal B | USD 0.61 B (2024) | May include adjacent process oils or broader industrial fluids in the same bucket and can apply spot-year currency conversion, which lifts the reported USD value in some years. |
Across the three figures, the main differences trace back to what is counted as a lubricant, which year is used, and how pricing and FX are applied. Our approach stays traceable because liters are tied to demand pools first, and value is then layered using application-level pricing checks that are re-tested during updates, so the final estimate can be replicated and explained clearly.


Key Questions Answered in the Report
How large is the Malaysia lubricants market in 2026?
Total demand equals 527.76 million liters in 2026, on course for 572.66 million liters by 2031 at a 1.65% CAGR.
Which product sells the most?
Automotive engine oil leads with 50.60% share in 2025, reflecting the country’s large passenger-car base.
What segment is expanding fastest?
Transmission fluids are set for the quickest gain, posting a 2.50% CAGR through 2031 because advanced gearboxes need specialized fluids.
Why are synthetics growing in Malaysia?
Euro 5 fuel standards, turbocharged engines, and longer drain intervals push workshops toward full-synthetic oils that resist oxidation and protect after-treatment systems.
How will EVs change lubricant demand?
EVs reduce the volume of engine oil yet create new needs for e-transmission, cooling, and dielectric fluids, prompting suppliers to launch dedicated e-fluid lines.
Who dominates distribution?
PETRONAS holds the widest retail footprint, but e-commerce platforms increasingly serve Tier-2 cities and rural workshops with next-day lubricant delivery.
Page last updated on:


 Your data is secure and never sold or shared.


