
Luxury Goods Market Size and Share
Luxury Goods Market Analysis by Mordor Intelligence
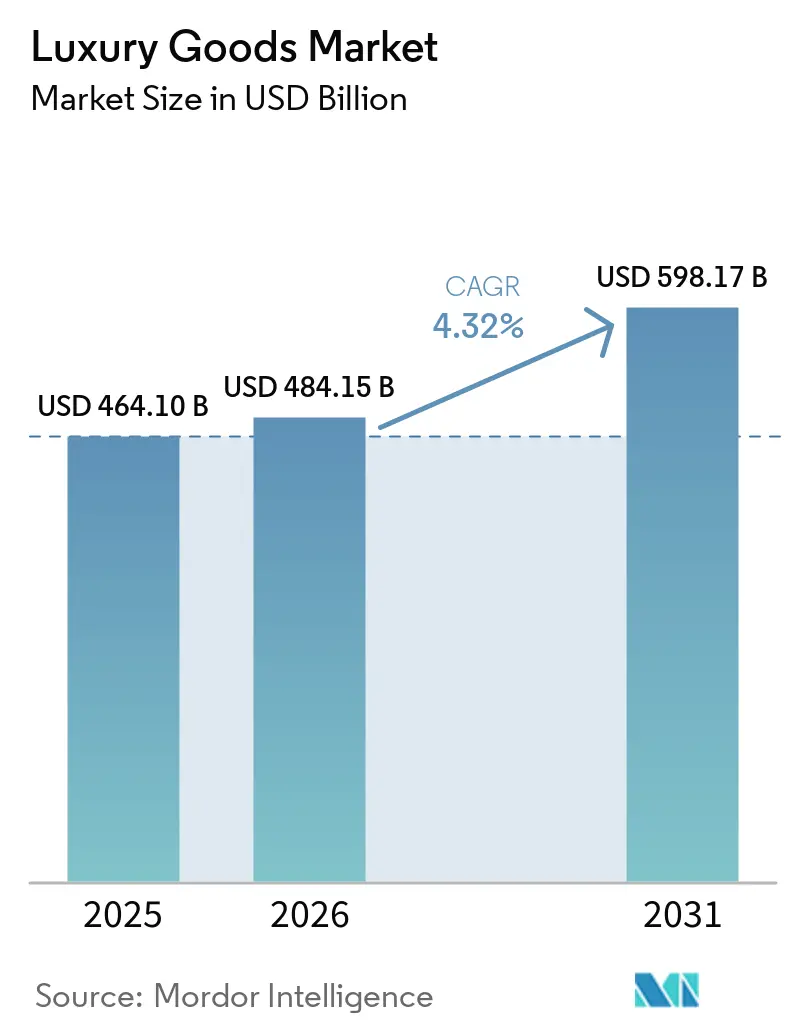
The luxury goods market size is expected to increase from USD 484.2 billion in 2026 to USD 505.1 billion in 2027 and reach USD 610.4 billion by 2032, growing at a CAGR of 3.86% over 2027-2032.
New wealth in the United States and material renewal in cashmere products support demand, while price sensitivity restrains occasional buyers. Production investment, boutique expansion, and top-customer engagement provide complementary routes to commercial growth. US-Israeli military operations against Iran, begun in February 2026, added a Middle Eastern headwind through weaker local demand and tourist flows. The choice between brand-controlled outlets and independent resellers also affects retained margins and pricing control. Growth therefore rests on affluent buyers in wealth-rich markets such as the United States offsetting planned spending cuts among price-sensitive customers and lost tourist spending in the Middle East.
Key Report Takeaways
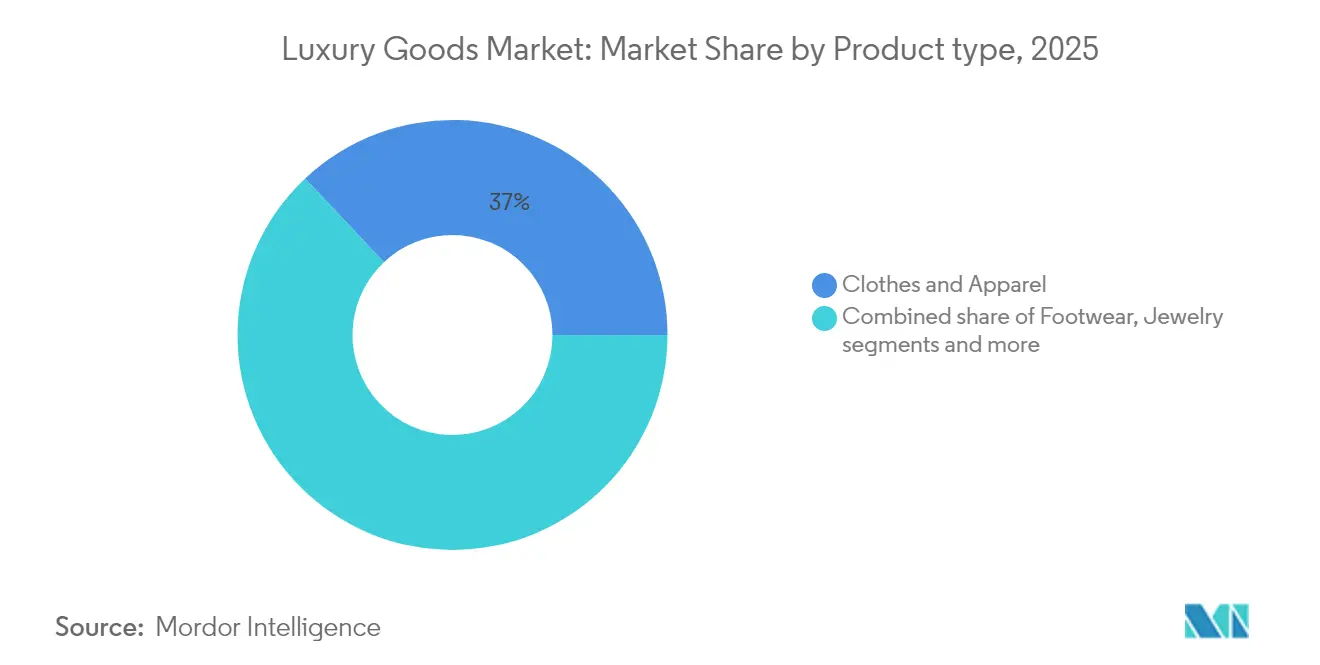
- By product type, clothing and apparel led with a 36.93% share of the luxury goods market size in 2026, while watches are forecast to grow fastest at a CAGR of 4.2% over 2027-2032.
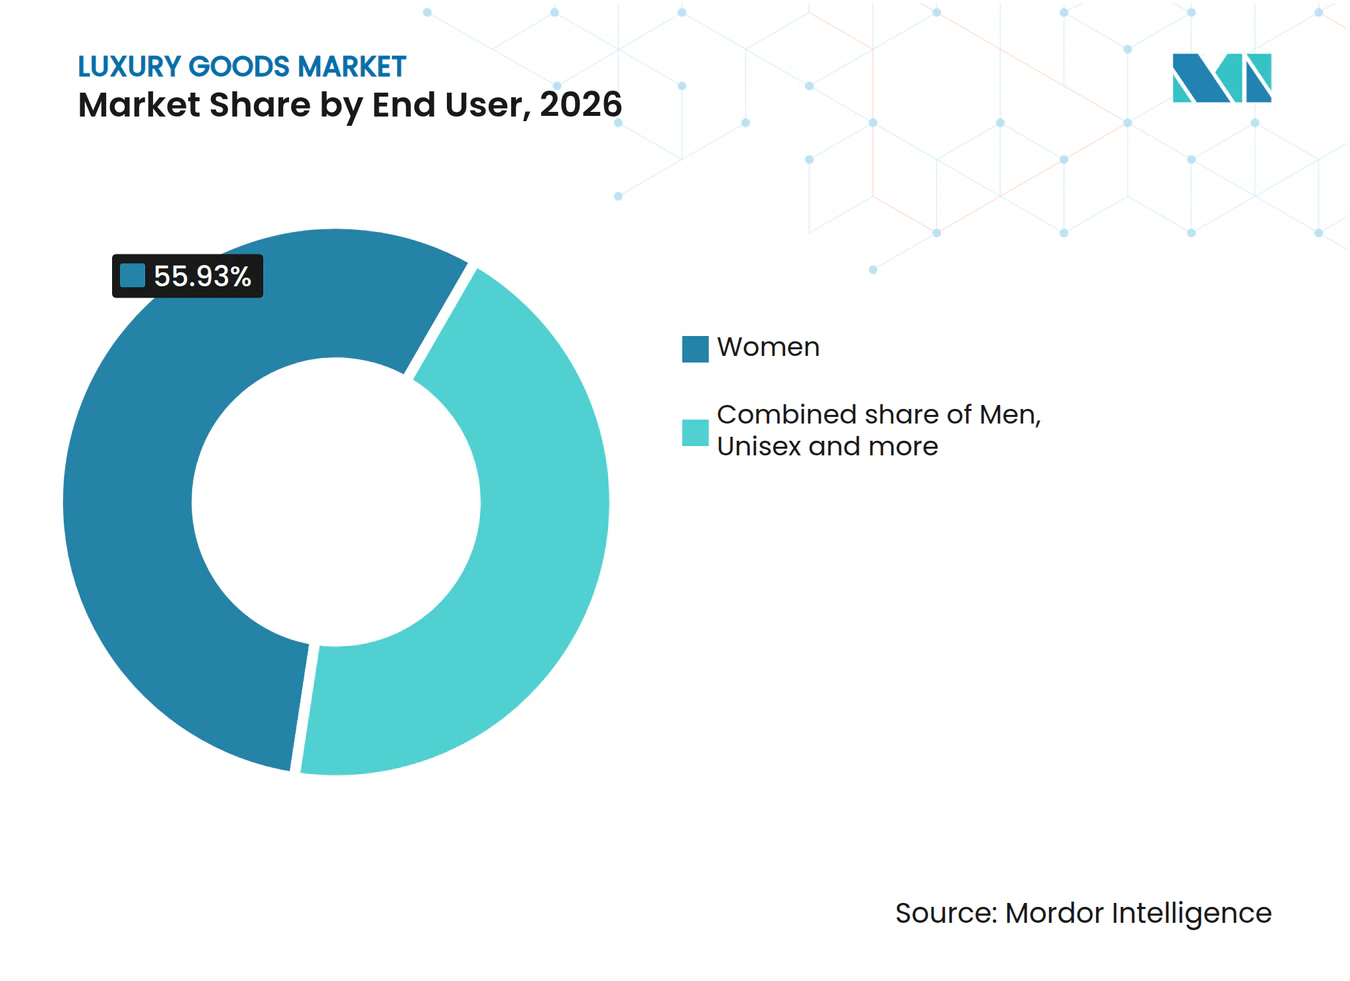
- Women led the end-user category with a 55.93% luxury goods market share in 2026, and men are projected to grow fastest at a CAGR of 4.25% over 2027-2032.
- Among distribution channels, single-brand stores accounted for 38.16% of spending in 2026, whereas online stores are expected to grow fastest at a CAGR of 4.75% over 2027-2032.
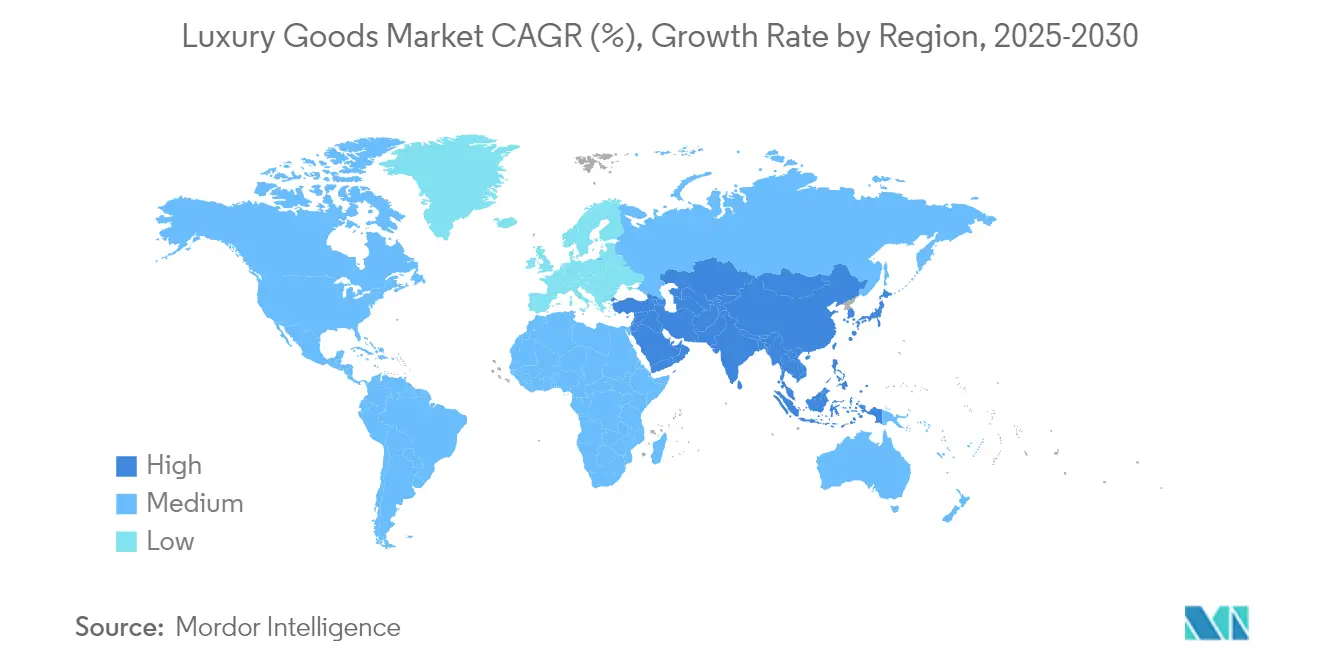
- Europe was the leading geography with 51.82% of spending in 2026, while Asia-Pacific is forecast to grow fastest at a CAGR of 5.2% over 2027-2032.
Note: Market numbers in this report are based on Mordor Intelligence's proprietary estimation framework, which combines nine months of actuals with Q4 projections for base year 2026.
Market Trends and Insights
Drivers Impact Analysis of Luxury Goods Market*
| Driver | (~) % Impact on CAGR Forecast | Geographic Relevance | Impact Timeline |
|---|---|---|---|
| Consumer Shift Toward Sustainable and Eco-Certified Luxury Products | +0.7% | Mainland China and United Arab Emirates | Long term (≥ 4 years) |
| Influence of Social Media and Celebrity Endorsement | +1.2% | United Kingdom, United States, China and Japan | Short term (≤ 2 years) |
| Rising Disposable Income and Wealth Accumulation | +2.1% | The United States | Medium term (2-4 years) |
| Product Innovation in terms of Raw Material and Design | +1.1% | France, Italy, Spain and United States | Medium term (2-4 years) |
| Consumers' Inclination Towards Limited Edition Products | +0.4% | Southeast Asia and Mainland China | Short term (≤ 2 years) |
| Growth of Experience-Based Luxury and Personalization Services | +0.5% | Europe, United States and Asia | Medium term (2-4 years) |
| Source: Mordor Intelligence | |||
Consumer Shift Toward Sustainable and Eco-Certified Luxury Products
Generational and geographic differences make sustainability a targeted demand proposition for luxury brands. In 2026, 29% of surveyed aspirational luxury clients across 11 markets ranked sustainability among their top purchase influences, down 2 percentage points from 2025.[1] The share was 32% among Gen Z and millennials, compared with 25% among Gen X and baby boomers. Sustainability influenced 40% of surveyed aspirational clients in each of Mainland China and the United Arab Emirates. However, 25% of surveyed aspirational clients expressed skepticism toward brand sustainability claims. For luxury brands, the geographic gap favors country-specific sustainability positioning, while skepticism limits the selling power of an unsupported claim.
Influence of Social Media and Celebrity Endorsement
Social channels can connect product discovery with a transaction, giving them a commercial role beyond visibility alone. In February 2025, 27% of UK fashion and beauty shoppers who followed influencer recommendations reported luxury purchases directly through platforms such as TikTok and Instagram. In EY’s 2026 survey across 11 markets, 13% of aspirational luxury clients ranked celebrity, influencer, or social-circle influence among up to 5 factors affecting their most recent luxury purchase. The UK finding establishes a direct selling route, while the broader survey places social influence among several buying considerations. Selling through the recommendation platform can give a brand the transaction itself, in addition to the influence measured in the wider survey.
Rising Disposable Income and Wealth Accumulation
An expanding stock of personal wealth can enlarge the pool of customers able to consider high-priced personal goods. Global personal wealth increased 10.8% in 2025 in US-dollar terms, according to UBS’s Global Wealth Report. UBS reported that more than 440,000 people in the United States became US-dollar millionaires that year, nearly half of worldwide additions. This concentration gives US-facing luxury brands a more defined customer-acquisition opportunity than the global wealth increase alone suggests. For brands with US selling networks, proximity to much of the new millionaire population offers an advantage over suppliers whose reach is concentrated elsewhere.
Product Innovation in terms of Raw Material and Design
Material development can support luxury product differentiation when an identifiable collection is backed by a broader sourcing capability. Loro Piana developed the Loro Capsule from surplus cashmere supplied by LVMH Maisons, with most products containing 30% closed-loop recycled materials. Across its Maisons’ products and packaging, LVMH reported that 41% of materials came from recycling processes in 2025. Louis Vuitton’s long-term worldwide material-supplier partnerships addressed its volume, quality, and innovation requirements in 2025. The capsule gives buyers a concrete composition difference, while recycling across the group’s products and packaging places material renewal within a broader sourcing strategy.
Restraints Impact Analysis of Luxury Goods Market*
| Restraint | (~) % Impact on CAGR Forecast | Geographic Relevance | Impact Timeline |
|---|---|---|---|
| Proliferation of counterfeit Products | -0.7% | Austria, Belgium, Germany and Italy | Long term (≥ 4 years) |
| Lesser demand from price sensitive consumers | -0.6% | United States, United Kingdom, China and Japan | Short term (≤ 2 years) |
| Stringent Regulatory Environment and Compliance Costs | -0.3% | European Economic Area countries | Medium term (2-4 years) |
| Economic Uncertainty and Inflation Impact on Consumer Spending | -0.5% | United States, United Kingdom, France and Singapore | Short term (≤ 2 years) |
| Source: Mordor Intelligence | |||
Proliferation of counterfeit Products
Concealment within legitimate textile shipments makes counterfeit luxury fashion a distribution problem as well as a lost-sale problem. In May 2025, the European Anti-Fraud Office reported that an operation begun with its 2024 inquiries had resulted in national authorities seizing more than 1.8 million counterfeit designer clothing, footwear, and accessory items. Seizures occurred in Austria, Belgium, Germany, Italy, and non-EU countries, and the operation found goods concealed behind legitimately declared textiles. Deceptive goods can enter trade flows alongside authentic textiles and divert potential revenue, a constraint that product differentiation alone cannot remove.
Lesser demand from price sensitive consumers
Price sensitivity can reduce the value of a luxury transaction as well as the likelihood of another purchase. In EY’s 2026 survey across 11 markets covering clothing, shoes, bags, watches, jewelry, and accessories, 100% of the infrequent, price-sensitive “Drifting aspirational” segment planned lower spending over the next 12 months. Another 22% of surveyed aspirational clients were regular buyers who remained engaged but reported lower spending and trading down in ticket size. These create different commercial exposures, with occasional buyers presenting a retention problem and engaged regular buyers presenting a lower-ticket problem. A brand can preserve customer interest and still face reduced revenue per transaction, so engagement is an incomplete defense against weaker spending.
*Our forecasts treat driver/restraint impacts as directional, not additive. The impact forecasts reflect baseline growth, mix effects, and variable interactions.
Luxury Goods Market Segment Analysis
By Product Type:
Apparel Scale and Watchmaking MomentumClothing and apparel accounted for a 36.93% share of the luxury goods market size in 2026, making it the largest segment. Hermès reported EUR 4.53 billion (USD 5.11 billion) in 2025 revenue from its combined Ready-to-wear and Accessories métier. The combined métier accounted for 28% of Hermès revenue in 2025, down from 29% in 2024, and grew 6% at constant exchange rates in 2025. A leading position in consumer spending can coexist with a declining weight for the combined apparel and accessories business within an individual house’s sales.
Watches are the fastest-growing segment, with a projected CAGR of 4.2% over 2027-2032. Richemont’s Specialist Watchmakers sales rose 8% at constant exchange rates and 6% at actual rates in April-June 2026 versus April-June 2025.[2] Sales increased across most of its watchmaking maisons, with Vacheron Constantin, Jaeger-LeCoultre, and A. Lange & Söhne standing out. Growth across most maisons and regions, led by the Americas and Japan, gave Richemont’s Specialist Watchmakers business a recovery spanning several brands and markets.


By End User:
Women Anchor Spending as Menswear Renews Its OfferWomen represented a 55.93% luxury goods market share in 2026, making them the largest segment. Burberry reported womenswear growth in Q1 FY2026/27, when all 4 of its divisions grew together for the first time in 3 years. Because womenswear grew alongside the other 3 divisions, women’s demand contributed to a group-wide upturn rather than offsetting weakness elsewhere in the house. Altiant’s Q3 2026 tracker of global affluent and high-net-worth respondents found that purchases of leather goods and cosmetics and fragrances over the prior 12 months skewed clearly toward women.
Men are the fastest-growing segment, with a projected CAGR of 4.25% over 2027-2032. HUGO BOSS reported BOSS Menswear revenue growth of 3% on a currency-adjusted basis in 2025 versus 2024. The company linked performance to campaigns and BECKHAM x BOSS collections that increased engagement, particularly through social media. BOSS Menswear represented 78% of HUGO BOSS sales in 2025, so the currency-adjusted gain came in the group’s largest brand line, where the campaign-led engagement it cited carried the most revenue.
By Distribution Channel:
Dedicated Networks and Digital Customer DevelopmentSingle-brand stores held 38.16% of spending in 2026, making them the largest distribution segment. LVMH’s Fashion and Leather Goods brands operated around 2,300 exclusive boutiques at December 31, 2025.[3] This extensive dedicated network gives the format a substantial physical selling base through which houses can present their own goods under their own banners. Because these boutiques carry the houses’ own brands, the network gives LVMH a direct route to consumers for its Fashion and Leather Goods ranges without depending on third-party retailers.
Online stores are the fastest-growing segment, with a projected CAGR of 4.75% over 2027-2032. LuxExperience reported that Mytheresa’s net sales grew 11.5% at constant currency in FY2026 compared with FY2025. Mytheresa’s top-customer count also increased 18% in Q4 FY2026 compared with Q4 FY2025. The results connect an expanding customer cohort with a growing online sales business, giving the digital channel a commercial mechanism beyond wider reach alone. Alongside attracting new visitors, developing top-customer relationships offers online luxury retailers a focused route to demand.
Geography Analysis
Europe Luxury Goods Market
Europe held a 51.82% luxury goods market share in 2026, making it the largest geography. Hermès recorded EUR 1.92 billion (USD 2.24 billion) in European destination sales in the first half of 2026, up 6% at constant exchange rates from the first half of 2025. Over that comparison period, its sales grew 1.8% in France and 8.8% in the rest of Europe at constant exchange rates. Faster growth outside France gave the house a European demand base extending beyond its French home market.
Asia-Pacific Luxury Goods Market
Asia-Pacific is the fastest-growing geography, with a projected CAGR of 5.2% over 2027-2032. Prada Group’s regional retail sales rose 15% in the first half of 2026 versus the first half of 2025, or 6% organically excluding Versace, both at constant exchange rates. The Prada brand made further progress in the second quarter, while Miu Miu grew throughout the half. The existing portfolio supplied regional retail growth beyond the contribution from adding Versace to the reported business.
In North America, US-native luxury brands grew roughly 10% to 15% year over year in Q1 2026, excluding dollar swings. In South America, Brazilian footprint expansion supported the 2025 Americas outlook, while Dior’s largest Brazilian store opened July 24, 2026 in São Paulo, combining women’s and men’s fashion, home goods, jewelry, accessories, footwear, and fragrances. In Middle East and Africa, US-Israeli military operations against Iran began February 28, 2026, and the Gulf luxury consumer base contracted between 15% and 25% in early 2026. Richemont’s Middle East and Africa sales fell 3% at constant exchange rates in the quarter ended March 31, 2026 versus the prior year, reflecting slower local demand and reduced tourist flows. US brand growth and Brazil’s larger Dior footprint show distinct routes to commercial expansion, while a smaller Gulf buyer base limits the customers available to regional sellers.
Mordor Intelligence provides coverage of the luxury goods market across other key regional markets, including Middle East, each with their regulatory frameworks and demand patterns. Detailed country-level analysis extends to Russia incorporating local coverage and market participation, as required.
Regulatory Framework and Outlook
The comparison assesses selected jurisdictions from the perspective of luxury apparel producers and importers. Ratings reflect the operational work attached to bringing covered textiles to sale, including product information, quality controls, and stock disposition. Current attractiveness weighs those duties, while future direction distinguishes scheduled extensions from continuity under operative instruments.
Regulatory Table of Luxury Goods Market
| Decision factor | United States | France | China | Brazil | Saudi Arabia |
|---|---|---|---|---|---|
| Primary authority | Federal Trade Commission | Directorate General for Competition, Consumer Affairs, and Fraud Control | State Administration for Market Regulation; county-level-and-higher local market-supervision departments | Inmetro | Saudi Standards, Metrology and Quality Organization |
| Key instruments or direction | Textile Fiber Products Identification Act rules, subject to exemptions and exclusions | EU Regulation 1007/2011 for products containing at least 80% textile fibers by weight; unsold-textile and footwear destruction phase-in | Mandatory GB 18401-2010; fiber-product measures effective July 1, 2026 | Law No. 5,956/1973; Decree No. 75,074/1974; Inmetro Ordinance No. 118/2021 | Technical Regulation of Textile Products, Issue 2, mandatory from July 12, 2024 |
| Commercial effect | Required fiber information on covered labels or invoices | Fiber-composition labels for covered textiles; constraints on destroying unsold textiles and footwear | Producer quality-safety systems; sellers inspect incoming goods and retain records for at least 2 years | Permanent fiber information on each textile-product unit | Covered textile goods must meet the mandatory technical regulation |
| Current policy attractiveness | High | Medium | Medium | Medium | Medium |
| Future direction of policy attractiveness | No change | Hardening | No change | No change | No change |
| Source: Mordor Intelligence | |||||
The high US rating reflects fiber-information duties permitting labels or invoices, subject to statutory exemptions and exclusions, while the FTC’s 2025 review plan and separate digital-care-label petition support continuity. France’s medium rating reflects EU Regulation 1007/2011 fiber-composition labeling and the EU ban on destroying unsold textiles and footwear, with large-enterprise application from July 19, 2026 and medium-sized-enterprise application from July 19, 2030 supporting hardening. China’s producer quality-safety systems and sellers’ incoming inspections with records retained for at least 2 years, together with Brazil’s permanent labels on each unit, entail more prescriptive operational controls and support medium ratings and continuity. Saudi Arabia’s second edition of the Technical Regulation of Textile Products has been mandatory since July 12, 2024, and SASO’s listing shows no later edition, supporting a medium rating and no change in direction.
Value Chain Stages
The comparison follows material access, finished-goods production, and consumer retailing, where integration changes who captures the final selling margin. In 2025, LVMH introduced closer monitoring of strategic partners’ capacity and work-in-progress traceability following allegations concerning the Italian textile value chain. That response makes partner oversight part of production resilience, connecting the credibility of the supply chain with the goods ultimately offered under the brand.
Value Chain Analysis Table of Luxury Goods Market
| Primary activity | Key participants | Value capture | Bottleneck | Resilience response |
|---|---|---|---|---|
| Material access and specialist expertise | Materials-access specialists such as LVMH Métiers d’Art | Material and specialist-service earnings | Potential climate-related pressure on LVMH material quality and availability | Broaden qualified material access through specialist networks |
| Finished-goods manufacture | Integrated leather-goods manufacturers such as Hermès and Louis Vuitton | Branded finished-goods sales | Partner capacity and production traceability in textile supply | LVMH supplier visits, worker discussions, and capacity checks |
| Consumer retailing | Brand-controlled retailers such as LVMH’s Fashion and Leather Goods businesses | Retained retail margins | Consistent brand presentation and sales reception across controlled outlets | Align outlet operations with the brand’s required selling environment |
| Source: Mordor Intelligence | ||||
Distribution control can keep retail earnings within the brand group, as LVMH’s margin-retention model illustrates. That control retains the retail layer’s margin without insulating production from climate-related disruption, which LVMH identifies as a risk to raw-material quality, quantity, costs, and sourcing. Distribution ownership determines who captures retail earnings, while material access determines whether production can supply the goods that generate them.
Competitive Landscape
Market Concentration
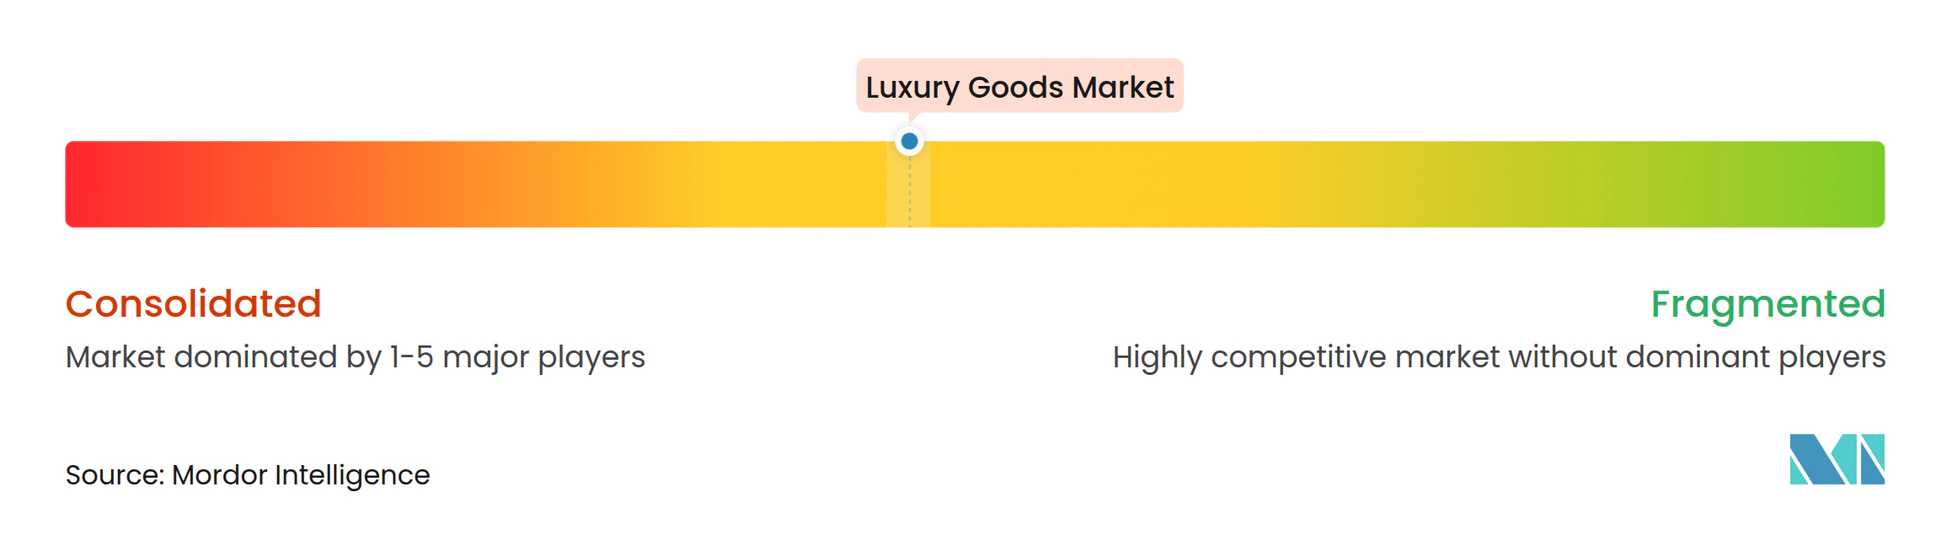
Competition is moderately concentrated around established houses and diversified groups, with specialist product portfolios creating several centers of competitive strength. Major participants include Hermès International SA, Kering SA, Chanel SA, Compagnie Financière Richemont SA, and LVMH Moët Hennessy Louis Vuitton SE. Hermès’ Leather Goods and Saddlery sales grew 13% at constant exchange rates in 2025, supported by collection appeal and increased production capacity. The contribution from added capacity places supply expansion alongside collection appeal as a competitive strength in Hermès’ leather-goods business.
Retail expansion and product specialization offer different ways to deepen that commercial position across luxury categories. Chanel opened more than 40 boutiques in 2025, including in Japan, Mainland China, the Middle East, and Mexico. Richemont’s Jewellery Maisons, which include Cartier and Van Cleef & Arpels, grew sales 14% at constant exchange rates in the year ended March 31, 2026, while LVMH’s Sephora opened around 100 stores in 2025. These approaches give competitors different control points, with boutique investment extending a house’s physical selling presence and specialized maisons retaining a focused product proposition. Chanel’s expansion gives buyers more brand-operated points of purchase in newer markets such as the Middle East and Mexico.
Distribution control also creates a competitive boundary wherever suppliers work with independent retailers. In October 2025, the European Commission fined Kering’s Gucci, Richemont’s Chloé, and Loewe for resale-price practices covering the European Economic Area. Those practices ended in April 2023 and had restricted independent online and physical retailers’ pricing across almost all the brands’ apparel, leather goods, shoes, and fashion accessories. The case makes pricing independence a material consideration when brands choose between their own outlets and third-party distribution. Independent resellers add reach, but the supplier gives up equivalent control over the final retail price.
Luxury Goods Industry Leaders
-
Hermès International SA
-
Kering SA
-
Chanel SA
-
Compagnie Financière Richemont SA
-
LVMH Moët Hennessy Louis Vuitton SE
- *Disclaimer: Major Players sorted in no particular order
Luxury Goods Market Companies Covered in this Report
- LVMH Moët Hennessy Louis Vuitton SE
- Kering SA
- Compagnie Financière Richemont SA
- Chanel SA
- Hermès International SA
- Rolex SA
- The Swatch Group Ltd.
- Burberry Group Plc
- Capri Holdings Ltd
- Breitling SA
- Tapestry Inc.
- Moncler SpA
- Giorgio Armani SpA
- PVH Corp.
- Dolce & Gabbana Srl
- Audemars Piguet Holding SA
- Estée Lauder Companies Inc.
- Tod's S.p.A.
- MCM Global AG
- OTB Group
Key Opportunities for Market Participants
The comparison assesses openings for selling new luxury personal goods through apparel preparation, domestic-travel shopping, and brand-store conversion. Each play addresses a different commercial decision, from what information accompanies a garment to where a shopper completes the purchase. Policy timing and customer behavior shape the openings, while adoption uncertainty and the need to convert local interest into sales limit the expansion justified by each play.
Market Opportunities Table of Luxury Goods Market
| Opportunity | Why now | Buyer / lead segment | Recommended play | Main barrier | Likely beneficiaries |
|---|---|---|---|---|---|
| EU-ready luxury apparel assortments | Textile Digital Product Passport rule adoption scheduled for Q3-Q4 2027 | Luxury apparel buyers served by EU-facing brands | Prepare product provenance alongside future garment collections | Sector requirements and adoption timing | Apparel maisons with documented supplier networks |
| Domestic-travel fashion conversion in Mainland China | In 2025, 54% of surveyed Mainland China luxury consumers identified luxury fashion as a category they were most likely to spend more on during domestic travel | Mainland China luxury-fashion shoppers traveling domestically | Target destination-store assortments to the travel-shopping occasion | Converting stated intent into purchases | Luxury-fashion brands and local retail partners |
| Focused selling through existing brand stores | Brand stores were the final purchase channel for 71% of EY’s 2026 surveyed recent luxury-fashion, watch, or jewelry buyers across 11 markets | Recent luxury-fashion, watch, and jewelry buyers | Connect product selection with a final brand-store purchase | Location-specific sales must justify added selling capacity | Brands with existing consumer-facing stores |
| Source: Mordor Intelligence | |||||
The strongest near-term opening is to improve conversion inside brand stores, a format already used by surveyed recent luxury buyers. A focused travel-shopping assortment gives suppliers a way to address a defined occasion before committing to broader footprint expansion. The EU passport work is the longer-dated step, since textile-specific Digital Product Passport rules are scheduled for adoption in Q3-Q4 2027.
Recent Industry Developments in Luxury Goods Market
- Sep 2026: Moncler opened its largest global flagship on Fifth Avenue in New York, offering its collections, collaborations, and performance gear.
- Jul 2026: Dior opened its largest store in Brazil at São Paulo’s Shopping Cidade Jardim, combining women’s and men’s fashion, home goods, jewelry, accessories, footwear, and fragrances.
- Mar 2026: Kering and L’Oréal finalized their beauty partnership after competition-authority approval, confirming L’Oréal’s acquisition of Kering Beauté, including Creed, and beauty and fragrance licenses for Kering houses.
Luxury Goods Market Report Scope and Research Methodology
Market Definition and Coverage
Luxury goods market measures annual consumer spending on luxury personal goods sold worldwide. It covers branded goods whose price premiums reflect brand equity, craftsmanship, or scarcity.
Scope exclusions: Luxury automobiles, luxury travel and hospitality services, second-hand luxury goods, fine wines and spirits, and separately charged luxury personalization or experience services are excluded.
Segments Covered in This Report
- By Product Type
- Clothing and Apparel
- Footwear
- Eyewear
- Handbags and Wallets
- Jewelry
- Watches
- Beauty and Personal Care
- By End User
- Men
- Women
- Unisex
- By Distribution Channel
- Single Brand Stores
- Multi Brand Stores
- Online Stores
- Other Distribution Channels
- By Geography
- North America
- United States
- Canada
- Rest of North America
- Europe
- United Kingdom
- Germany
- France
- Italy
- Spain
- Rest of Europe
- Asia-Pacific
- China
- Japan
- India
- South Korea
- Australia
- Rest of Asia-Pacific
- South America
- Brazil
- Argentina
- Rest of South America
- Middle East and Africa
- Saudi Arabia
- South Africa
- Rest of Middle East and Africa
- North America
Data Sources, Market Sizing, and Validation
Desk Research
The analyst uses sources such as UN Comtrade trade flows to track relevant product categories, Eurostat household final-consumption data to frame consumer spending, EUIPO counterfeiting studies to assess leakage from legitimate sales, and LVMH's published reporting to cross-check category and channel activity. These sources provide independent trade, household, regulatory, and company signals that help interpret annual retail spending across the global luxury-goods market.
Company filings, investor materials, and reputable press coverage add reported revenue, geography, and channel evidence, which analysts compare with public statistical series and one another. These sources are not exhaustive, and further sources inform collection, validation, and clarification.
Primary Interviews and Surveys
Structured interviews and surveys draw on brand, retail, merchandising, and e-commerce leaders, alongside managers who monitor product-level sales, channels, and regional demand. Respondents help test secondary-source interpretations, identify gaps in the consumer-retail boundary, and triangulate assumptions when company reporting, trade data, and household indicators do not align.
Distribution of primary research fieldwork respondents
| Company type | Respondent position | Region |
|---|---|---|
| Top tier: 30% | CXOs: 20% | APAC: 38% |
| Mid tier: 45% | Functional/Unit leaders: 35% | EMEA: 34% |
| Smaller Players: 25% | Managers: 45% | Americas: 28% |
Market-Sizing & Forecasting
The model estimates worldwide annual retail value in USD by first anchoring the global total to final-consumer spending on the included personal goods, then checking selected product, buyer, channel, and regional roll-ups against company disclosures and trade evidence. Household spending by category, affluent-household and wealth trends, inflation and currency movements, cross-border tourism, and trade flows for relevant goods provide complementary indicators of demand, prices, and geographic allocation. Segment shares are built from category-level sales disclosures, retailer and channel evidence, consumer purchase patterns, and regional spending indicators, with the resulting product, end-user, channel, and regional shares reconciled to their relevant total. Forecasts use scenario analysis that links expected consumer spending and wealth formation with local prices, tourism, and channel shifts, while primary experts can test each variable's direction and the reasonableness of segment forecasts. Where selected supplier or retailer roll-ups and sampled average selling price times unit-volume checks are available, they serve as selective bottom-up checks on the top-down result, and missing product or company detail is handled by retaining the nearest supported category evidence and testing the resulting range against independent indicators.
Data Validation & Update Cycle
Analysts triangulate company disclosures, household and trade indicators, consumer research, and independent market signals, then investigate unusual movements and variances across years, product groups, channels, and regions before sign-off. A second analyst reviews source fit, calculations, and explanations, and the research team recontacts relevant respondents when a material contradiction or unresolved gap could change the interpretation. The dataset is refreshed annually, updated between cycles after material market events, and checked again in a fresh pre-delivery review.
Mordor Intelligence's Luxury Goods Market Sizing Compared With Other Published Estimates
Published estimates can differ in the transactions and products they count and the inputs used to model demand. Luxury goods market measures annual consumer spending on luxury personal goods sold worldwide.
Key Gap Drivers include the study's defined coverage and market-specific modeling choices. Segment shares are built from category-level sales disclosures, retailer and channel evidence, consumer purchase patterns, and regional spending indicators, with the resulting product, end-user, channel, and regional shares reconciled to their relevant total.
Benchmark comparison
| Source | Market Size | Gaps in Research Methodology |
|---|---|---|
| Mordor Intelligence | USD 505.1 B (2027) | |
| Global Consultancy A | USD 439.11 B (2025) | At its 2025 base, this estimate is 13.1% below this report's 2027 value of USD 505.1 B, 2 years later. The published estimate uses a 2025 base and projects continued growth through 2031, so it predates the report's measurement year. |
| Global Research Publisher B | USD 471.5 B (2025) | At its 2025 base, this estimate is 6.6% below this report's 2027 value of USD 505.1 B, 2 years later. The published estimate uses a 2025 base and projects a growing global market through 2030, so it predates the report's measurement year. |
Mordor Intelligence's analysts triangulate company disclosures, household and trade indicators, consumer research, and independent market signals, then investigate unusual movements and variances across years, product groups, channels, and regions before sign-off.
Key Questions Answered in the Report
What is the luxury goods market size and growth outlook?
The size is expected to increase from USD 484.2 billion in 2026 to USD 505.1 billion in 2027 and USD 610.4 billion by 2032, with a CAGR of 3.86% over 2027-2032.
What drives demand for luxury personal goods?
Wealth accumulation, social commerce, and material innovation support demand. In 2026, 29% of surveyed aspirational luxury clients across 11 markets also ranked sustainability among their top purchase influences.
Which product type leads luxury personal-goods spending?
Clothing and apparel held 36.93% of spending in 2026, while watches are forecast to grow fastest at a CAGR of 4.2% over 2027-2032.
Which companies are prominent in the luxury personal-goods industry?
Prominent participants include Hermès International SA, Kering SA, Chanel SA, Compagnie Financière Richemont SA, and LVMH Moët Hennessy Louis Vuitton SE.
What could limit luxury personal-goods demand?
Counterfeits and price sensitivity constrain legitimate sales. In EY’s 2026 survey, 100% of the infrequent, price-sensitive “Drifting aspirational” segment planned lower spending over the next 12 months.
Which regions lead luxury personal-goods sales and growth?
Europe held 51.82% of spending in 2026. Asia-Pacific is forecast to grow fastest, at a CAGR of 5.2% over 2027-2032.