
LTL Cross-Docking Services Market Size and Share
Market Overview
| Study Period | 2020 - 2031 |
|---|---|
| Market Size (2026) | USD 15.83 Billion |
| Market Size (2031) | USD 19.94 Billion |
| Growth Rate (2026 - 2031) | 4.72 % |
| Fastest Growing Market | Asia-Pacific |
| Largest Market | North America |
| Market Concentration | Medium |
Major Players *Disclaimer: Major Players sorted in no particular order Image © Mordor Intelligence. Reuse requires attribution under CC BY 4.0. | |
LTL Cross-Docking Services Market Analysis by Mordor Intelligence
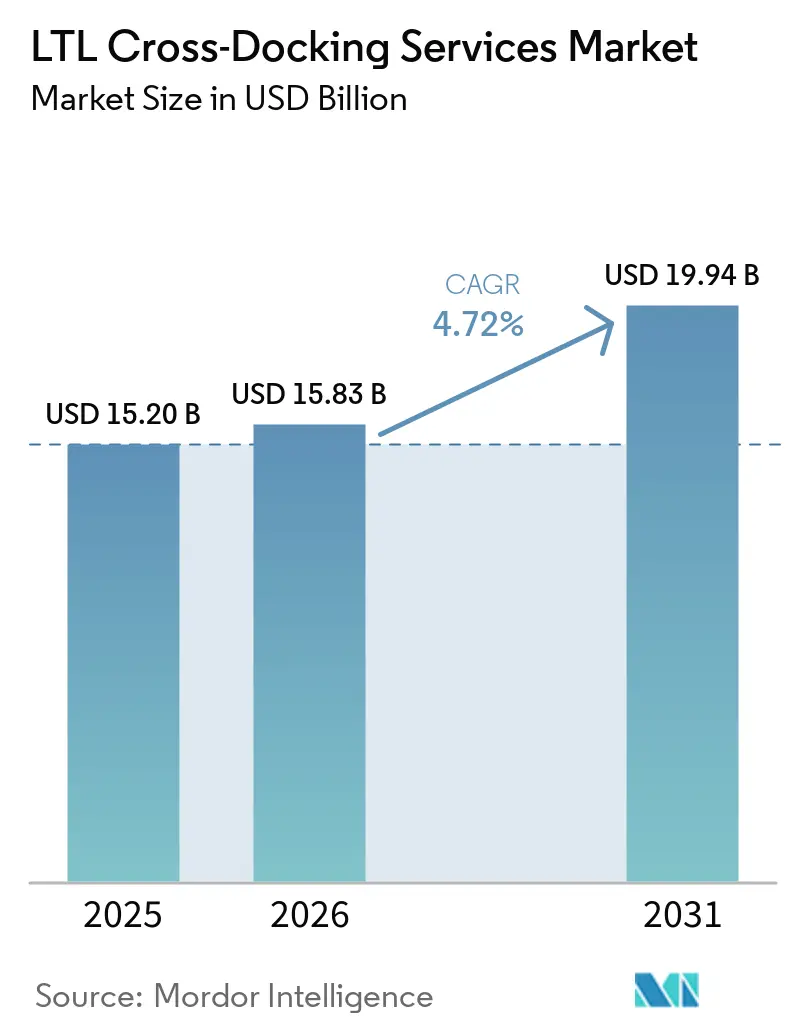
The LTL cross-docking services market size was valued at USD 15.20 billion in 2025 and estimated to grow from USD 15.83 billion in 2026 to reach USD 19.94 billion by 2031, at a CAGR of 4.72% during the forecast period (2026-2031).
The LTL cross-docking services market is supported by freight patterns that require frequent transfers across multiple delivery points. Omnichannel retail has shifted replenishment away from large warehouse movements and toward smaller, more frequent consignments. This places more importance on consolidation points that can combine partial loads before linehaul movement. Providers are competing on terminal coverage, shipment visibility, and the ability to handle time-sensitive freight.[1]Capacity constraints at urban terminals remain a practical limit on how quickly networks can absorb higher shipment volumes.
Key Report Takeaways
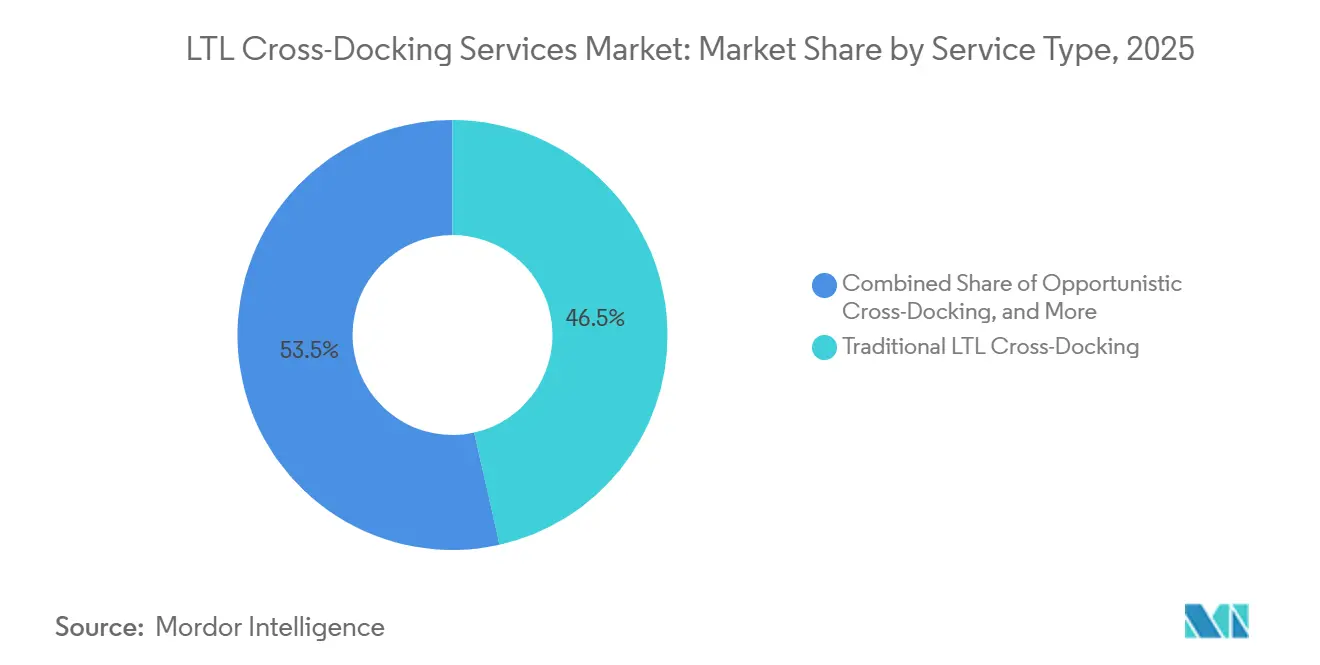
- By service type, traditional LTL cross-docking held 46.50% of the LTL cross-docking services market share in 2025, while opportunistic cross-docking registered at a 6.55% CAGR through 2031.
- By ownership model, third-party logistics providers held 45.15% of the LTL cross-docking services market size in 2025, while freight brokers and digital freight platforms registered at a 6.42% CAGR through 2031.
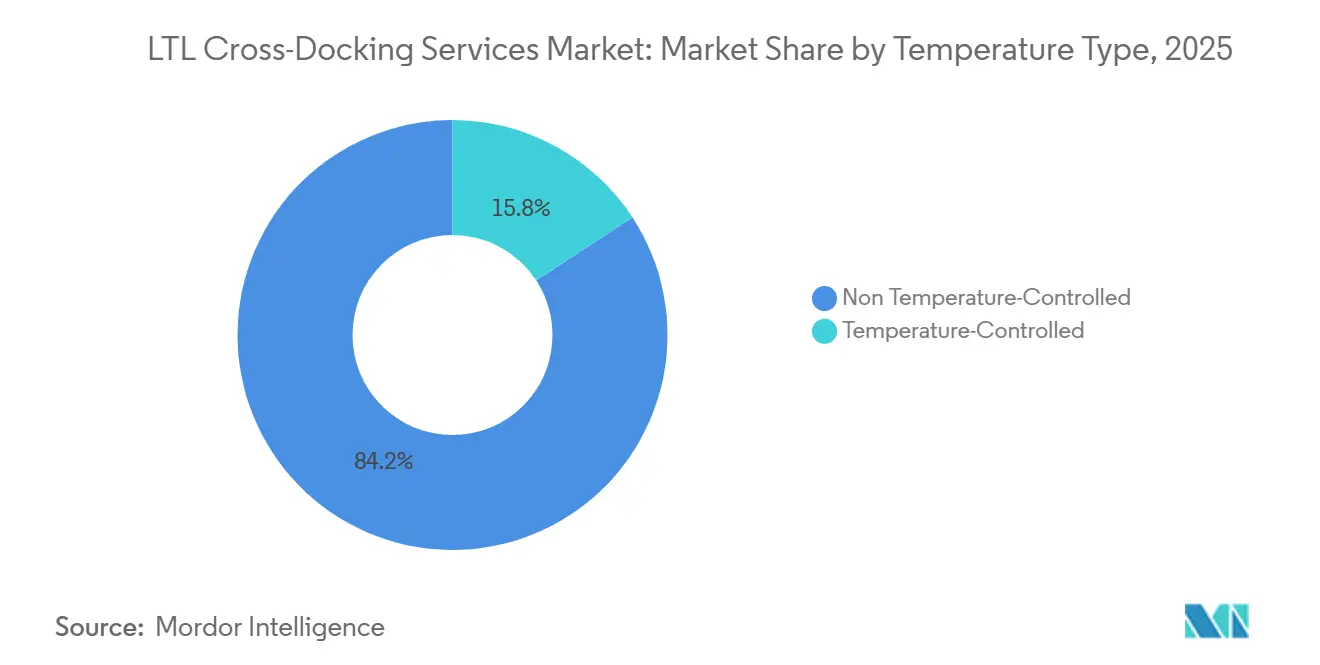
- By temperature, non-temperature-controlled freight held 84.20% of the LTL cross-docking services market share in 2025, while temperature-controlled cross-docking registered at a 6.20% CAGR through 2031.
- By end-user industry, food and beverage held 22.35% of the LTL cross-docking services market size in 2025, while retail and e-commerce registered at a 6.67% CAGR through 2031.
- By geography, North America held 35.50% of the LTL cross-docking services market share in 2025, while Asia-Pacific registered at a 6.39% CAGR through 2031.
Note: Market size and forecast figures in this report are generated using Mordor Intelligence’s proprietary estimation framework, updated with the latest available data and insights as of January 2026.
Global LTL Cross-Docking Services Market Trends and Insights
Drivers Impact Analysis*
| Driver | % Impact on CAGR Forecast | Geographic Relevance | Impact Timeline |
|---|---|---|---|
| E-Commerce and Omnichannel Freight Fragmentation | +1.5% | Global; highest density in North America and Asia-Pacific | Short term (≤2 years) |
| Regionalized Manufacturing and Nearshoring | +0.9% | North America (United Stsates-Mexico corridor); EU near-shoring zones | Medium term (2–4 years) |
| Shipper Demand for Lower Touches and Faster Replenishment | +0.7% | North America; Western Europe | Short term (≤2 years) |
| Digital Dock-to-Dock Coordination | +0.5% | Global; early adoption concentrated in North America and Asia-Pacific | Medium term (2–4 years) |
| Cold-Chain and Time-Critical LTL Expansion | +0.6% | North America; Western Europe; Asia-Pacific core | Medium term (2–4 years) |
| Network Density and Trailer Utilization Imperatives | +0.4% | North America; European Union | Long term (≥4 years) |
| Source: Mordor Intelligence | |||
E-Commerce and Omnichannel Freight Fragmentation
E-commerce is changing the shipment mix handled across regional freight networks. Orders increasingly combine small parcels, mixed pallets, and freight for many delivery locations. Carriers need consolidation to achieve viable trailer use on shared linehaul corridors. The LTL cross-docking services market therefore benefits when retail replenishment requires frequent and multi-destination movements. Walmart selected C.H. Robinson as 1 of 3 providers for its Prepaid Consolidation program in May 2026. The program routes supplier freight through consolidation locations before delivery to Walmart regional distribution centers, linking supplier transport arrangements to a standardized inbound process.[2]This model places a greater premium on providers that can connect suppliers with broad consolidation networks.
Regionalized Manufacturing and Nearshoring
Manufacturing activity in Mexico’s northern industrial areas creates freight flows that suit cross-docking. Production from multiple supplier locations can require consolidation before a northbound movement crosses the border. This is particularly relevant to automotive, aerospace, and consumer electronics supply chains. Mexico’s Ministry of Economy reported foreign direct investment inflows above USD 20 billion in the first quarter of 2025, with activity concentrated in Baja California, Nuevo Leon, and Coahuila. These states feed freight corridors that converge at border crossings, including Laredo, El Paso, and Nogales. Chihuahua recorded USD 47.55 billion in exports by the second quarter of 2025, which added pressure to the El Paso and Ysleta crossings. The LTL cross-docking services market gains from this fragmentation because freight from separate origins can be combined into more viable linehaul movements.
Shipper Demand for Lower Touches and Faster Replenishment
Inventory-light supply chains place greater weight on short cycle times from production to store shelf. Cross-docking supports this aim by moving freight through a transfer point instead of holding it in storage. Fewer handling events can also reduce the opportunities for freight damage. Food, beverage, retail, and consumer goods shippers value dependable delivery windows because late deliveries can interrupt store replenishment.[3] The LTL cross-docking services market has a practical role in these networks because it links inbound freight with scheduled outbound loads. Purpose-built transfer facilities can give carriers and logistics providers a service argument that extends beyond transport cost.
Digital Dock-to-Dock Coordination
Real-time coordination is changing cross-dock terminals from transfer locations into active freight-matching points. Digital systems can assign doors and sequence work around outbound needs rather than a first-arrival process. This can improve the use of dock space when terminals handle dense freight flows. XPO developed linehaul optimization models in 2025 and started accelerating their use across the service-center network in 2026. The company stated that a 1% improvement in pickup and delivery efficiency could produce USD 9 million in annual bottom-line benefit. C.H. Robinson expanded BidBoardX to more than 83,000 contract carriers across North America in June 2026, broadening access to committed freight and carrier capacity. These tools help the LTL cross-docking services market handle routing decisions that are difficult to manage through manual processes.
Restraints Impact Analysis*
| Restraint | % Impact on CAGR Forecast | Geographic Relevance | Impact Timeline |
|---|---|---|---|
| Synchronization Risk Across Inbound and Outbound Windows | -0.8% | Global | Short term (≤2 years) |
| Dock Congestion and Terminal Capacity Constraints | -0.7% | North America; Western Europe | Medium term (2–4 years) |
| Skilled Labor and Driver Availability | -0.6% | North America; European Union | Long term (≥4 years) |
| High Integration and Automation Capex | -0.5% | Global; particularly smaller operators | Medium term (2–4 years) |
| Source: Mordor Intelligence | |||
Synchronization Risk Across Inbound and Outbound Windows
Cross-docking relies on close alignment between inbound arrivals and outbound departures. An inbound delay can leave freight without its scheduled onward movement. This can create detention charges, missed departures, and longer transit times. Inland freight can become unpredictable after containers leave a port because rail disruptions, drayage constraints, and uneven cargo arrivals affect the schedule. C.H. Robinson reported in June 2026 that inland container movement was creating more friction than terminal congestion in some conditions. Smaller operators are more exposed when they lack tools for exception management and alternate routing.
Dock Congestion and Terminal Capacity Constraints
Terminal capacity remains constrained in several dense freight corridors. Limited space in urban industrial areas can delay facility expansion and limit flexibility for time-sensitive shipments. Operators then face pressure to use doors, tractors, and trailers more intensively. This can narrow the service windows available for freight transfers.[4] Major carriers continue to invest in service centers and real estate, but land acquisition, permitting, and construction add lead time. The restraint affects the LTL cross-docking services market most directly, where high shipment frequency meets limited terminal capacity.
*Our forecasts treat driver/restraint impacts as directional, not additive. The impact forecasts reflect baseline growth, mix effects, and variable interactions.
Segment Analysis
By Service Type: Opportunistic Models Gain Ground on Traditional Frameworks
Traditional LTL cross-docking held 46.50% of the LTL cross-docking services market share in 2025. It remains the main load-matching framework for established hub-and-spoke carrier networks in North America and Europe. Consolidation cross-docking supports inbound flows toward distribution centers. Deconsolidation cross-docking supports distribution from larger shipments toward multiple retail destinations. Both approaches are used across consumer goods, industrial materials, and automotive supply chains. These models depend on planned terminal networks and established lane schedules. Their value is strongest where carriers can consistently match inbound and outbound movements. Traditional facilities also give shippers a familiar process for moving partial loads through regional and national networks.
Opportunistic cross-docking registered at a 6.55% CAGR through 2031. Its growth reflects the use of real-time visibility tools that can direct freight through available terminal capacity. Operators can avoid a preassigned node when a different location offers a faster movement or better trailer fill. This approach helps address congestion on selected lanes. It also allows asset-light providers to use capacity across more than 1 operator’s terminal network. The model is most relevant when a planned connection changes because a shipment arrives late, a departure fills early, or a nearby terminal has usable space. Dispatch teams can respond to the current condition of a network rather than rely solely on a fixed routing plan. This can protect transit performance for freight that has several transfer points. It can also reduce the risk that unused trailer space leaves a terminal while freight waits at another location. Providers still need disciplined handling rules, accurate shipment information, and clear accountability when freight moves through a partner terminal. The operating model is, therefore, more flexible, but it does not remove the need for local service control. The LTL cross-docking services market benefits when providers can convert terminal visibility into reliable routing decisions. The strongest operators combine physical terminal coverage with scheduling tools that improve load matching.

By Ownership Model: 3PLs Anchor the LTL Cross-Docking Services Industry While Digital Platforms Expand
Third-party logistics providers accounted for 45.15% of the LTL cross-docking services market size in 2025. Their position is based on multi-shipper consolidation, broad coverage, and established carrier relationships. A 3PL can combine freight from several customers into more efficient outbound movements. This can be useful where individual shippers lack sufficient volume on a lane. These providers also manage transport, consolidation, and reporting within a single operating structure. Their integrated model can help retailers and manufacturers meet delivery requirements across multiple destinations. The LTL cross-docking services industry, therefore, retains a strong role for providers that have both customer depth and carrier access.
Freight brokers and digital freight platforms registered at a 6.42% CAGR through 2031. Shippers use these intermediaries to access spot and committed capacity across multiple LTL operators. C.H. Robinson’s BidBoardX expansion in June 2026 provides access to committed freight for more than 83,000 contract carriers across North America. Asset-based LTL carriers retain an important position because owned terminals and linehaul capacity can support dependable service on complex runs. The other ownership category includes shipper-controlled programs, retail-managed consolidation centers, and hybrid asset models. Walmart’s prepaid consolidation program shows how retailers can take a more direct role in inbound freight coordination. This can shift volume toward providers that meet retailer requirements for technology and compliance. Digital tools improve carrier choice, but they do not replace the importance of physical terminal capability. Brokers can make procurement easier by presenting more carrier options and by bringing together smaller shipments that would otherwise move separately. Their service is particularly useful when shippers need flexibility across lanes rather than a single fixed network. At the same time, platform access alone cannot resolve missed connections, freight exceptions, or local dock constraints. Those issues still depend on carrier operations and terminal relationships. The LTL cross-docking services market is, therefore, shaped by the interaction between asset owners and intermediaries, rather than by a simple replacement of one model with another.
By Temperature: Non Temperature-Controlled Freight Leads While Cold Chain Capacity Expands
Non-temperature-controlled freight held 84.20% of the LTL cross-docking services market size in 2025. Dry goods, industrial materials, and durable consumer products make up most freight moving through conventional LTL networks. These shipments can move through standard transfer facilities without specialized temperature management. Their large base gives general freight operators a central role in the LTL cross-docking services market. Standardized processes, shared linehaul routes, and high trailer use support their economics. The category includes many everyday product flows that need regional and national distribution. Its scale also gives operators a broad base over which to spread terminal and network costs.
Temperature-controlled cross-docking registered at a 6.20% CAGR through 2031. Pharmaceutical cold-chain needs and fresh food distribution support demand for more specialized transfer capacity. UPS announced a USD 48 million investment in 27 temperature-controlled freight cross-dock facilities in June 2026. The facilities support short-term storage and air-to-ground transfers across 2° C to 8° C, 15° C to 25° C, and frozen conditions. IATA CEIV Pharma certification adds a compliance hurdle for pharmaceutical handling. Temperature records and lot-level shipment control also shape how operators serve food and pharmaceutical customers. These requirements favor providers that have already invested in certified facilities, controls, and trained operating teams. They also make it harder to treat a cold-chain transfer as a standard dock movement. Facility design, storage ranges, loading practices, and handoff records all need to match the product requirements. A missed temperature control step can affect the value of the shipment and the customer relationship. Large operators can spread these investments across wider volumes and networks. Temperature-controlled operations remain smaller, but their service needs differ materially from dry freight. The LTL cross-docking services market has room for specialist carriers and logistics providers where certification and handling discipline matter as much as network reach.
By End-User Industry: Food and Beverage Leads While Retail and E-Commerce Grow Fastest
Food and beverage accounted for 22.35% of the LTL cross-docking services market share in 2025. Perishable goods logistics and narrow delivery windows make this end-user group a reliable source of cross-dock freight. Grocery and specialty food distribution require regular replenishment across many locations. Cross-docking supports these movements by reducing storage time between inbound and outbound transport. Food and beverage shippers also place weight on product handling and delivery consistency. Accurate shipment dimensions have become more important under density-based freight classification. This encourages disciplined staging and measurement before freight enters an LTL network. The segment’s scale keeps it important to providers serving retail replenishment programs.
Retail and e-commerce registered at a 6.67% CAGR through 2031. Online retail creates demand for flexible freight flows that serve many destinations rather than one large warehouse delivery. Cross-docking supports this pattern by combining partial loads and separating them near the destination network. A retailer can use the same network to move merchandise toward stores, regional fulfillment points, and other downstream locations. This creates a need for providers that can manage changing order mixes without losing control of the shipment. Manufacturing and industrial goods use the model for inbound component consolidation and outbound distribution. Automotive networks use it when parts from multiple suppliers need coordinated movement. Healthcare and pharmaceuticals use it where temperature control and delivery timing are important. Consumer electronics and technology use it to support multi-site distribution. Different end users may have different product requirements, but they share a need for predictable handoffs. This makes freight visibility, dock discipline, and carrier coordination relevant across several verticals. The breadth of these end users reduces reliance on a single demand source within the LTL cross-docking services market.
Geography Analysis
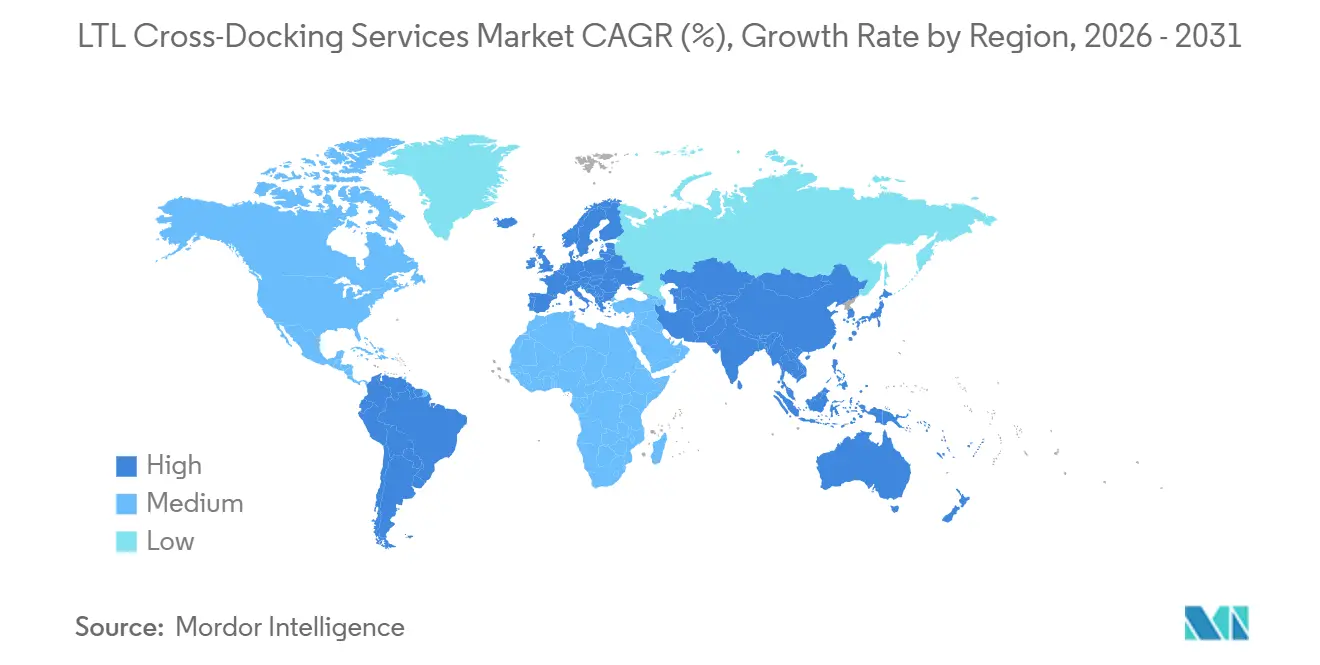
North America held 35.50% of the global market value in 2025. The region benefits from dense hub-and-spoke LTL infrastructure, high e-commerce activity, and expanding freight movements between the United States and Mexico. Cross-dock activity is concentrated in the Northeast, Midwest, and Texas-Mexico border corridors. Chihuahua’s exports reached USD 47.55 billion by the second quarter of 2025, a 35.7% year-over-year increase. This placed more northbound consolidation pressure on the El Paso and Ysleta crossings. Canada’s intermodal infrastructure supports cross-border freight flows into major United States distribution corridors. The region also has a large installed base of LTL terminals that can handle regular transfer activity. Cross-border freight often requires coordination among manufacturers, carriers, customs processes, and destination networks. This makes predictable handoffs especially important on busy border lanes. The LTL cross-docking services market benefits from the region’s mature carrier network and heavy use of regional distribution.
Europe has important cross-docking activity in Germany, France, the United Kingdom, and the Benelux region. These locations support continental distribution across closely connected road networks. Deutsche Bahn opened a 38,000 m² container storage yard at the Ulm-Dornstadt intermodal terminal in July 2026. The expansion is intended to more than double road-to-rail cargo transfer capacity at the location by 2028. Rhenus opened a cross-dock warehouse in Kaunas, Lithuania, in May 2026 and introduced daily departures to German and Polish hub networks. These developments show the value placed on connections between road, rail, and regional groupage networks. European providers also need to coordinate freight movements across national borders and varied local delivery patterns. The Middle East and Africa region is developing through Saudi Arabia and the UAE, which act as consolidation locations for pharmaceutical and retail supply chains. Infrastructure gaps and higher setup costs limit near-term penetration in parts of Sub-Saharan Africa. The LTL cross-docking services market has a more established role in Europe’s high-density corridors than in regions where terminal networks remain less developed.
Asia-Pacific is forecast to grow at a 6.39% CAGR from 2026 to 2031. Manufacturing diversification, e-commerce growth, and logistics infrastructure investment support this pace. China accounted for a major share of regional freight and logistics revenue in 2025 and sustains freight volumes through manufacturing exports and domestic e-commerce networks. India is forecast to grow rapidly, supported by industrial corridor development and digital commerce. Vietnam is a key ASEAN node where electronics and textile producers move partial loads from several sites before international consolidation. Maersk opened a 180,000 m² contract logistics facility near Kuala Lumpur in mid-2025, pointing to the importance of Southeast Asia in regional network planning. The region contains mature freight systems and developing networks that are expanding at different speeds. This increases the importance of local operating knowledge and partner coverage. Providers need to connect factories, ports, airports, and inland destinations without treating Asia-Pacific as a single operating environment. The LTL cross-docking services market can serve this diversity by linking production clusters with regional consolidation points.
Competitive Landscape
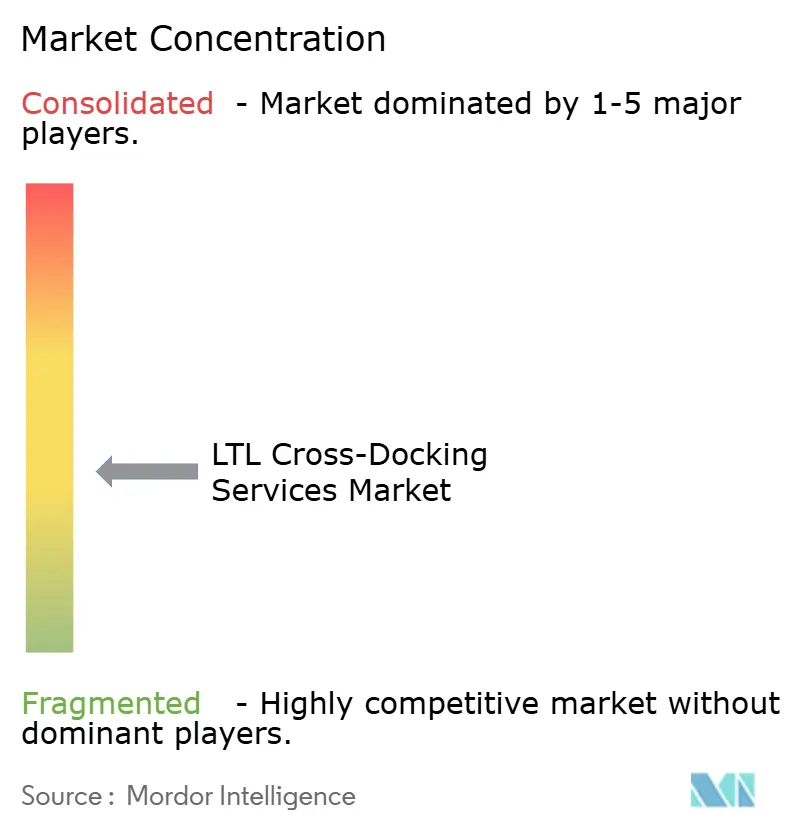
The LTL cross-docking services market is moderately fragmented. FedEx Freight, Old Dominion, XPO, Saia, and Estes Express have network density advantages through their terminal footprints and linehaul networks. These operators are well-positioned on premium and time-definite lanes where service reliability is important. Third-party logistics providers and digital platforms can compete effectively in selected lanes and freight categories. Their ability to aggregate capacity can be valuable to shippers who want carrier choice. FedEx Freight completed its spinoff as an independent public company in June 2026. The company is directing sales activity toward healthcare, grocery, and data center verticals, where cross-dock reliability and temperature precision have high value. The separation places greater attention on the company’s freight network and on the verticals that rely on consistent service. Established carriers retain an advantage when a shipment requires several coordinated transfer points. Their operating knowledge is built into terminal routines, linehaul schedules, and local delivery relationships. This makes it difficult for a new provider to match all parts of the service at once. However, shippers can still divide freight among several providers when they want a mix of coverage, pricing, and specialized handling. Competition is, therefore, strongest where service requirements are clear and capacity can be compared across providers.
New service models are also reshaping competition. Amazon announced an open-market LTL service in June 2026 that extends freight operations to United States business destinations. This adds competition in economy freight lanes, while premium time-definite tiers remain more closely linked to established LTL network capabilities. CMA CGM acquired FedEx Supply Chain in October 2026 at an enterprise value of USD 1.4 billion. The transaction would nearly triple CEVA’s North American contract logistics operations to more than 240 locations, subject to regulatory approval FEDEX. The deal would expand CEVA’s ability to compete in consolidation and managed transportation. Large networks remain difficult to reproduce quickly because terminals, carrier relationships, and operating procedures take time to build. The transaction also brings contract logistics locations into a wider transportation organization. That can help a provider coordinate consolidation activity with warehouse, managed transport, and freight forwarding services. The value of this broader offer depends on how consistently a provider manages handoffs between those operations. Providers with strong local execution can turn a larger network into a more dependable freight option. Providers without disciplined processes may find that more locations do not automatically produce better service.
Technology separates providers at both the carrier and logistics-provider levels. Freight-mix and pricing tools can help carriers make better use of available capacity and protect service performance. Kenco deployed operational automation tools to improve freight and fulfillment activity. Specialized pharmaceutical-grade and food-safe facilities outside major corridors can offer attractive opportunities because certified capacity is limited. UPS’s investment in temperature-controlled transfer facilities shows that established operators are adding capabilities in this area UPS. Regional carriers are also expanding cross-border offerings as Mexico-related freight grows. The LTL cross-docking services market still rewards providers that combine physical coverage, service consistency, and usable freight data. Technology supports this outcome when it makes a dock operation easier to control for employees and customers. It has less value when information cannot be converted into a practical response to a late truck, a damaged pallet, or an unavailable door. Operators therefore need to pair digital tools with trained teams and clear escalation processes. In temperature-sensitive freight, these operating disciplines also need to preserve the required product conditions during every transfer.
LTL Cross-Docking Services Industry Leaders
-
FedEx
-
XPO, Inc.
-
Estes Express Lines
-
Old Dominion Freight Line
-
Saia, Inc.
- *Disclaimer: Major Players sorted in no particular order
Recent Industry Developments
- September 2026: Old Dominion Freight Line, Inc. approved development of a USD 10 million, 40-door cross-dock warehouse in Baton Rouge, Louisiana, as part of a USD 380 million capital expenditure plan for 2026. The plan allocates USD 180 million specifically to real estate and service center expansion, reinforcing Old Dominion's strategy of adding terminal density in high-growth Southern markets ahead of an anticipated freight volume recovery.
- June 2026: R+L Carriers opened a new service center in Georgetown, Kentucky, replacing a prior Lexington facility and increasing freight capacity across the critical north-south corridor between Cincinnati and Knoxville.
- June 2026: R+L Carriers opened a new service center in Rock Hill, South Carolina, its fourth terminal in the state, expanding Mid-South region coverage and operational flexibility for coast-to-coast LTL shipments.
- June 2026: United Parcel Service, Inc. invested USD 48 million in 27 temperature-controlled freight cross-dock facilities across the United States and the rest of the Americas, Europe, and Asia. The IATA CEIV Pharma-compliant facilities support short-term pharmaceutical storage and air-to-ground transfers at temperature ranges of 2° C to 8° C, 15° C to 25° C, and frozen, targeting demand from GLP-1 injectables, mRNA therapies, and cancer treatment.
Global LTL Cross-Docking Services Market Report Scope
| Traditional LTL Cross-Docking |
| Consolidation Cross-Docking |
| Deconsolidation Cross-Docking |
| Opportunistic Cross-Docking |
| Third-Party Logistics Providers |
| Asset-Based LTL Carriers |
| Freight Brokers and Digital Freight Platforms |
| Others |
| Temperature-Controlled |
| Non Temperature-Controlled |
| Retail and E-Commerce |
| Food and Beverage |
| Manufacturing and Industrial Goods |
| Automotive |
| Healthcare and Pharmaceuticals |
| Consumer Electronics and Technology |
| Other Industries |
| North America | United States |
| Canada | |
| Mexico | |
| South America | Brazil |
| Argentina | |
| Peru | |
| Chile | |
| Rest of South America | |
| Europe | Germany |
| United Kingdom | |
| France | |
| Italy | |
| Spain | |
| Russia | |
| Nordics (Denmark, Finland, Iceland, Norway, and Sweden) | |
| Rest of Europe | |
| Asia-Pacific | China |
| India | |
| Japan | |
| South Korea | |
| Australia | |
| Southeast Asia (ASEAN) | |
| Rest of Asia-Pacific | |
| Middle East and Africa | Saudi Arabia |
| United Arab Emirates | |
| Qatar | |
| South Africa | |
| Nigeria | |
| Egypt | |
| Rest of Middle East and Africa |
| By Service Type | Traditional LTL Cross-Docking | |
| Consolidation Cross-Docking | ||
| Deconsolidation Cross-Docking | ||
| Opportunistic Cross-Docking | ||
| By Ownership Model | Third-Party Logistics Providers | |
| Asset-Based LTL Carriers | ||
| Freight Brokers and Digital Freight Platforms | ||
| Others | ||
| By Temperature | Temperature-Controlled | |
| Non Temperature-Controlled | ||
| By End-User Industry | Retail and E-Commerce | |
| Food and Beverage | ||
| Manufacturing and Industrial Goods | ||
| Automotive | ||
| Healthcare and Pharmaceuticals | ||
| Consumer Electronics and Technology | ||
| Other Industries | ||
| By Geography | North America | United States |
| Canada | ||
| Mexico | ||
| South America | Brazil | |
| Argentina | ||
| Peru | ||
| Chile | ||
| Rest of South America | ||
| Europe | Germany | |
| United Kingdom | ||
| France | ||
| Italy | ||
| Spain | ||
| Russia | ||
| Nordics (Denmark, Finland, Iceland, Norway, and Sweden) | ||
| Rest of Europe | ||
| Asia-Pacific | China | |
| India | ||
| Japan | ||
| South Korea | ||
| Australia | ||
| Southeast Asia (ASEAN) | ||
| Rest of Asia-Pacific | ||
| Middle East and Africa | Saudi Arabia | |
| United Arab Emirates | ||
| Qatar | ||
| South Africa | ||
| Nigeria | ||
| Egypt | ||
| Rest of Middle East and Africa | ||
Key Questions Answered in the Report
What is driving demand for LTL cross-docking services?
Omnichannel retail, nearshoring, and the need for faster replenishment support demand for consolidation and multi-destination freight movements.
How large is the LTL cross-docking services market?
The market was valued at USD 15.20 billion in 2025 and is estimated at USD 15.83 billion in 2026. It is forecast to reach USD 19.94 billion by 2031.
Which service type leads LTL cross-docking?
Traditional LTL cross-docking led with 46.50% of market value in 2025. Opportunistic cross-docking has the highest forecast growth rate at 6.55% through 2031.
Which end-user segment is growing fastest?
Retail and e-commerce registered at a 6.67% CAGR through 2031, supported by flexible, multi-destination freight needs.
Why is temperature-controlled cross-docking growing?
Pharmaceutical cold-chain requirements and fresh food distribution support a 6.20% CAGR for temperature-controlled cross-docking through 2031.
Which region has the strongest position in LTL cross-docking?
North America held 35.50% of market value in 2025, while Asia-Pacific has the highest forecast regional CAGR at 6.39% through 2031.