
Liquefied Natural Gas (LNG) Ship-to-Ship Port Bunkering Services Market Size and Share
Market Overview
| Study Period | 2021 - 2032 |
|---|---|
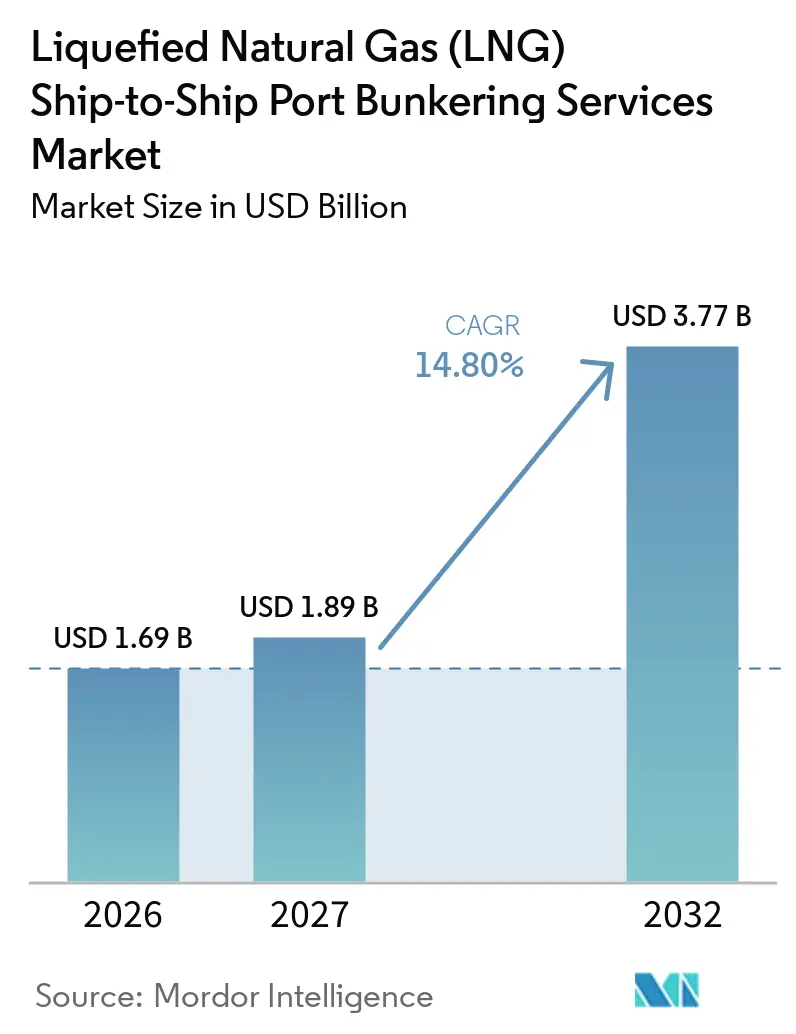
| Market Size (2027) | USD 1.89 Billion |
| Market Size (2032) | USD 3.77 Billion |
| Growth Rate (2027 - 2032) | 14.80 % |
| Fastest Growing Market | Asia-Pacific |
| Largest Market | Europe |
| Market Concentration | Medium |
Major Players *Disclaimer: Major Players sorted in no particular order Image © Mordor Intelligence. Reuse requires attribution under CC BY 4.0. | |
Liquefied Natural Gas (LNG) Ship-to-Ship Port Bunkering Services Market Analysis by Mordor Intelligence
The liquefied natural gas (LNG) ship-to-ship port bunkering services market size is valued at USD 1.69 billion in 2026 and is estimated to reach USD 1.89 billion in 2027 and USD 3.77 billion by 2032, registering a CAGR of 14.80% from 2027 to 2032.
The liquefied natural gas (LNG) ship-to-ship port bunkering services market is being pulled by rising use of dual-fuel vessels and the need to manage emissions obligations on Europe-connected routes. FuelEU Maritime has applied well-to-wake GHG-intensity requirements since January 2025, placing lifecycle fuel performance at the center of compliance planning for ships above 5,000 GT.[1] The liquefied natural gas (LNG) ship-to-ship port bunkering services market also benefits from infrastructure that can handle liquefied biomethane and e-methane without physical changes to cryogenic transfer systems, vapor-return lines, or hose connections. Competition is shifting toward integrated supply models that combine LNG sourcing, terminal access, bunkering vessels, and customer agreements. This favors providers that can support repeat high-volume transfers while supplying verified fuel information for lifecycle reporting, because customers are increasingly evaluating physical fuel delivery, fuel quality, emissions evidence, berth planning, and operational reliability as part of one procurement decision.
Key Report Takeaways
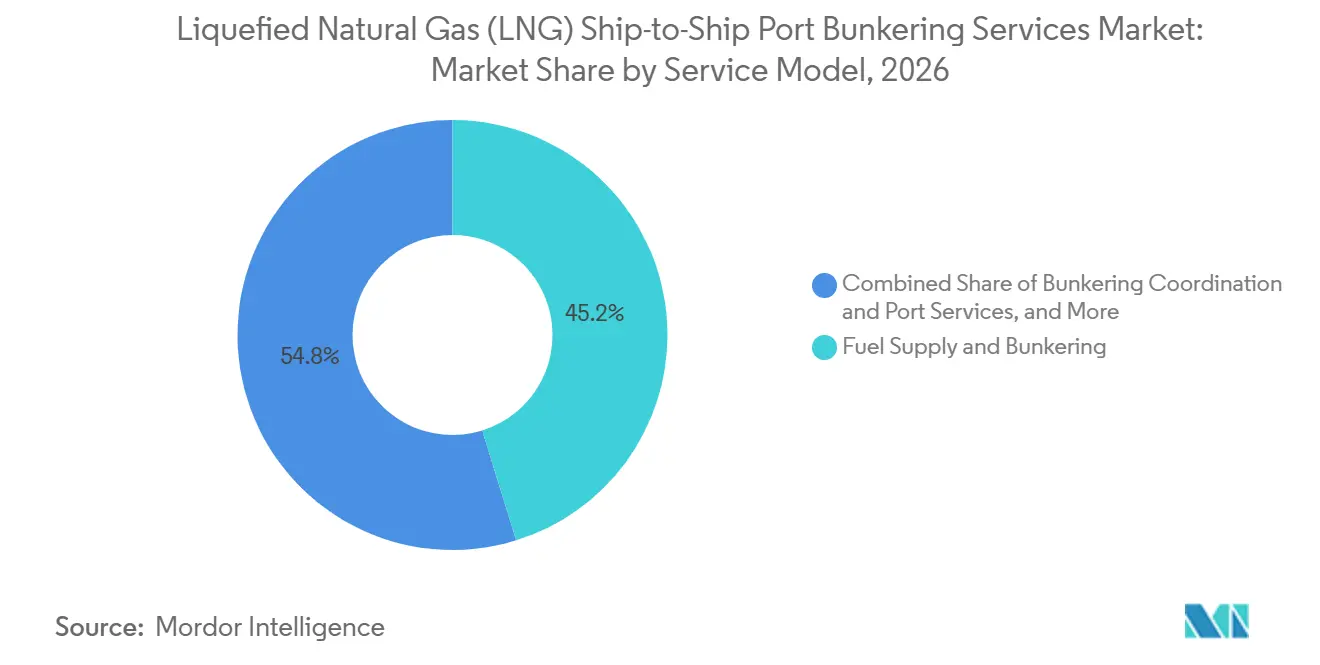
- By service model, fuel supply and bunkering held 45.20% of the liquefied natural gas (LNG) ship-to-ship port bunkering services market share in 2026, while bunkering coordination and port services recorded the highest projected CAGR at 16.31% through 2032.
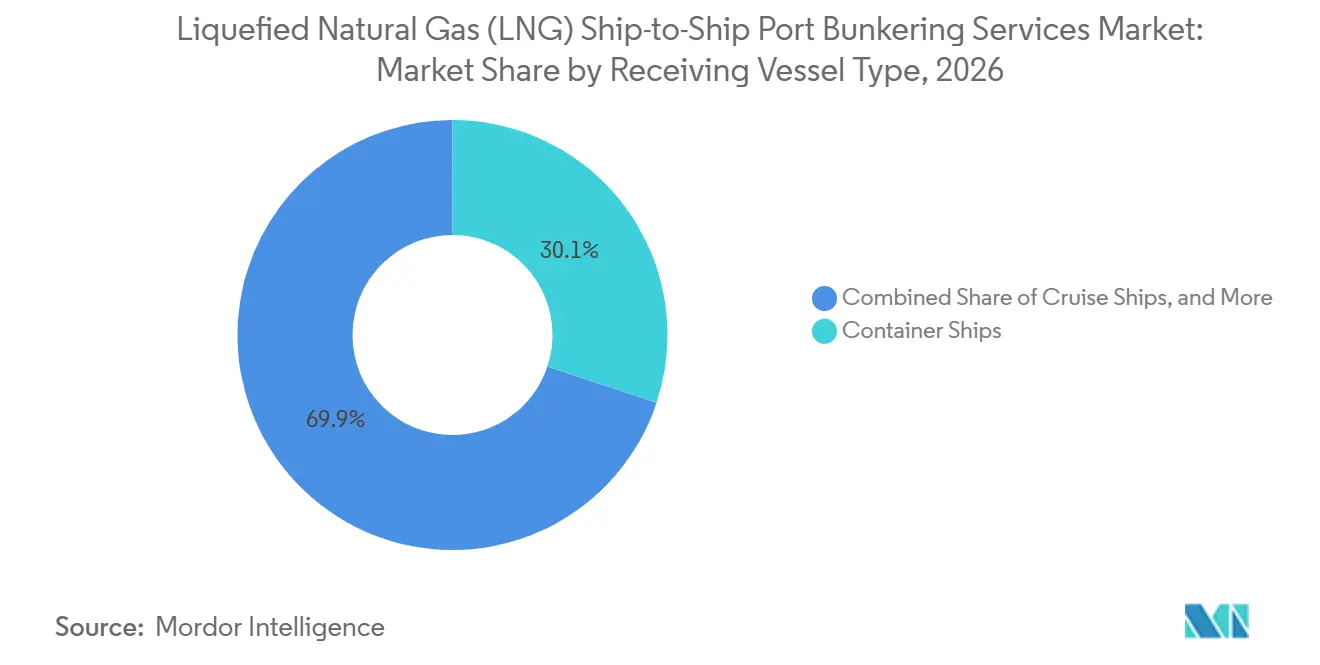
- By receiving vessel type, container ships held 30.10% of the liquefied natural gas (LNG) ship-to-ship port bunkering services market size in 2026, while cruise ships recorded the highest projected CAGR at 16.60% through 2032.
- By geography, Europe held 34.90% of the liquefied natural gas (LNG) ship-to-ship port bunkering services market share in 2026, while Asia-Pacific recorded the highest projected CAGR at 16.79% through 2032.
Note: Market numbers in this report are based on Mordor Intelligence's proprietary estimation framework, which combines nine months of actuals with Q4 projections for base year 2026.
Global Liquefied Natural Gas (LNG) Ship-to-Ship Port Bunkering Services Market Trends and Insights
Drivers Impact Analysis*
| Driver | (~) % Impact on CAGR Forecast | Geographic Relevance | Impact Timeline |
|---|---|---|---|
| IMO and Regional GHG and Air-Quality Compliance | +3.2% | Global, highest near-term impact in Europe and ECA-covered waters | Medium term (2-4 years) |
| Growth of LNG-Fuelled Container and Cruise Fleets | +3.8% | Global, concentrated in Asia, Europe, the Caribbean, and the Mediterranean | Medium term (2-4 years) |
| Expansion of LNG Bunker-Vessel Networks at Strategic Ports | +2.4% | North America, Asia-Pacific, and Southern Europe | Medium term (2-4 years) |
| Faster Refueling and Reduced Port-Call Disruption Through STS Transfer | +1.8% | Global, especially Singapore, Rotterdam, Algeciras, and Savannah | Short term (≤ 2 years) |
| Bio-LNG and E-Methane Compatibility of Existing LNG Bunkering Assets | +1.5% | Europe, with expansion to Asia-Pacific as regional rules align | Medium term (2-4 years) |
| Sea-Based Reloading and Floating Supply Models at Congested Hubs | +1.0% | Asia-Pacific, with expansion to the Middle East and Africa | Medium term (2-4 years) |
| Source: Mordor Intelligence | |||
IMO and Regional GHG and Air-Quality Compliance
FuelEU Maritime created a firm compliance framework for the liquefied natural gas (LNG) ship-to-ship port bunkering services market from January 2025. The regulation applies well-to-wake GHG-intensity limits to ships above 5,000 GT on EU-connected voyages. It sets a 2025 baseline target 2% below the sector reference and tightens the reduction requirement to 6% by 2030 and 80% by 2050.[2] The EU ETS also includes methane and nitrous oxide from 2026, increasing the value of credible fuel data and engine-performance records. The IMO approved its Net-Zero Framework in draft form at MEPC 83 in April 2025, introducing a global well-to-wake standard and compliance-credit mechanism for ships above 5,000 GT. These requirements encourage operators to establish dependable supply and documentation arrangements through the liquefied natural gas (LNG) ship-to-ship port bunkering services market.
Growth of LNG-Fuelled Container and Cruise Fleets
The dual-fuel vessel fleet provides the clearest demand base for the liquefied natural gas (LNG) ship-to-ship port bunkering services market. LNG accounted for 80% of alternative-fuel vessel orders in 2025, while LNG-fueled vessels represented 90% of the alternative-fuel orderbook during the first half of 2026. Approximately 800 LNG-capable vessels were in service by mid-2026, with a further 600 on order. Container ships create the core requirement because they sail on fixed schedules and need high-volume deliveries at established liner hubs. Cruise vessels also offer predictable fuel windows because passenger itineraries are planned well in advance. This vessel growth supports demand for bunkering providers that can coordinate fuel, berth access, and safe transfer operations across multiple regions.
Expansion of LNG Bunker-Vessel Networks at Strategic Ports
The liquefied natural gas (LNG) ship-to-ship port bunkering services market is supported by a larger and more capable bunker-vessel fleet. The fleet grew from 9 vessels in 2017 to 67 by mid-2026, with 42 additional units under construction for delivery through 2029. Fifty-eight percent of operational vessels carry at least 10,000 cubic meters, allowing providers to serve larger container ships and car carriers without multiple transfers.[3] In May 2026, MOL formalized its first annual LNG bunkering contract at the Port of Vancouver with Seaspan Energy, extending regular service into the Pacific Northwest. Singapore awarded 8 five-year LNG bunkering licenses effective September 2026, expanding the provider base at a major international hub. These investments improve supply reliability and allow the liquefied natural gas (LNG) ship-to-ship port bunkering services market to serve a wider range of trade lanes, including routes that require a bunker provider to deliver a large volume in a narrow port window without disrupting cargo, passenger, or vehicle-handling operations.
Faster Refueling and Reduced Port-Call Disruption Through STS Transfer
Ship-to-ship transfer allows fuel delivery to be coordinated with cargo handling at appropriate terminals. Simultaneous cargo and bunkering operations help vessels avoid a separate refueling call, which supports schedule reliability for high-utilization ships. This is especially relevant for container services where a delay at one port can affect several downstream calls. Peninsula Petroleum commissioned an 18,000 cubic meter bunker vessel to serve larger fuel tanks on new dual-fuel container ships. FueLNG completed its 500th ship-to-ship LNG bunkering operation in Singapore in August 2025. The United States Department of Energy narrowed oversight of ship-to-ship LNG transfers in February 2025, enabling Crowley Maritime’s Progress barge to broaden service along the United States Southeast coast.
Restraints Impact Analysis*
| Restraint | (~) % Impact on CAGR Forecast | Geographic Relevance | Impact Timeline |
|---|---|---|---|
| High Capital Intensity of LNG Bunker Vessels and Cryogenic Assets | -1.8% | Global, greatest in South America, MEA, and secondary North American ports | Long term (≥ 4 years) |
| Methane-Slip and Well-To-Wake Emissions Uncertainty | -1.2% | Global, with high relevance in EU jurisdictions and IMO discussions | Medium term (2-4 years) |
| LNG Price Volatility and Competition from Methanol, Ammonia, and Biofuels | -1.0% | Global, with particular exposure in Europe and major trading hubs | Medium term (2-4 years) |
| Port-Specific Permitting, Compatibility, and Emergency-Response Constraints | -0.7% | South America, MEA, and secondary Asian ports | Medium term (2-4 years) |
| Source: Mordor Intelligence | |||
High Capital Intensity of LNG Bunker Vessels and Cryogenic Assets
Capital intensity constrains the liquefied natural gas (LNG) ship-to-ship port bunkering services market outside established hubs. A standard 7,500 cubic meter LNG bunker vessel carries a construction cost of USD 50 million, while 20,000 cubic meter units exceed USD 80 million. Cryogenic containment, vapor-return systems, and required safety infrastructure contribute to this high entry cost. Long-term charters can reduce the ownership burden, as shown by ExxonMobil’s time-charter approach and Naturgy’s agreement for the Mistral LNG. Vessel delivery cycles of 24 to 30 months also limit the ability of the supply to respond quickly to a demand increase.[4] These conditions concentrate the liquefied natural gas (LNG) ship-to-ship port bunkering services market among well-capitalized energy suppliers and infrastructure-backed specialists.
Methane-Slip and Well-To-Wake Emissions Uncertainty
Methane slip remains a significant technical and regulatory issue for the liquefied natural gas (LNG) ship-to-ship port bunkering services market. Research recorded methane-slip rates of 2.5 to 21 g/kWh across low-pressure dual-fuel engine load profiles on newbuild vessels. The EU ETS includes methane in 2026, while FuelEU Maritime relies on methane factors that can differ from measured vessel performance. This can influence fleet procurement and fuel-selection decisions where operators remain uncertain about future compliance treatment in the liquefied natural gas (LNG) ship-to-ship port bunkering services market, particularly when long-term vessel choices are tied to reporting obligations and fuel-access arrangements. Certified bio-LNG and e-methane can improve lifecycle performance, but globally consistent mass-balance and book-and-claim rules remain limited. The liquefied natural gas (LNG) ship-to-ship port bunkering services market, therefore, needs reliable lifecycle records and transparent certification practices as compliance costs become more material.
*Our forecasts treat driver/restraint impacts as directional, not additive. The impact forecasts reflect baseline growth, mix effects, and variable interactions.
Segment Analysis
By Service Model: Fuel Supply Anchors Revenue While Coordination Services Scale
Fuel supply and bunkering accounted for 45.20% of the liquefied natural gas (LNG) ship-to-ship port bunkering services market size in 2026 because physical LNG delivery remains the largest revenue line within every ship-to-ship operation. Bunkering operations and transfer handling include cryogenic hose management, vapor return, metering, and safety work during the transfer. Eastern Pacific Shipping recorded 530 cumulative LNG bunkering operations by the end of 2025 and 700 operations in August 2026 across 32 ports. Measurement, documentation, and compliance services are also gaining relevance as operators need auditable lifecycle fuel records. ISO 20519 supports consistent metering, quantity calculation, and custody-transfer documentation for ship-to-ship LNG operations.
Bunkering coordination and port services are projected to register at a 16.31% CAGR through 2032 as SIMOPS planning, permitting, safety-zone management, and fuel scheduling become more complex. The liquefied natural gas (LNG) ship-to-ship port bunkering services industry is shifting toward integrated service models that combine supply, coordination, operational support, and verified documentation. Route-based fuel planning is important when vessels move between mature hubs and locations with limited LNG availability. The TotalEnergies and CMA CGM joint venture combines terminal reload access at Gate Terminal in Rotterdam with final ship-to-ship delivery in the ARA region. Its structure combines fuel supply and coordination through a single logistics arrangement. The joint venture plans supply of up to 360,000 tonnes annually from 2028 through 2040. This model indicates how service boundaries are narrowing as customers seek a single provider for supply reliability and compliance support.

By Receiving Vessel Type: Container Ships Lead While Cruise Demand Expands
Container ships held 30.10% of the liquefied natural gas (LNG) ship-to-ship port bunkering services market share in 2026, reflecting the scale and regular port calls of large dual-fuel liner fleets. Container ships drove 95% of China’s LNG bunkering volume growth in 2025 and accounted for 83% of incremental consumption in Singapore. Major liner groups create repeat demand for bunker operators on Asia, Europe, and transpacific routes. Tankers, car carriers, ferries, and Ro-Ro vessels also represent material demand cohorts. Singapore’s vehicle-carrier bunkering nearly tripled in 2025, supported by COSCO, MOL, and K Line activity. This vessel mix increases the need for bunker ships with both large capacity and scheduling flexibility in the liquefied natural gas (LNG) ship-to-ship port bunkering services market, where a provider may need to support liner, cruise, tanker, and car-carrier calls within the same trading area.
Cruise ships expand at a 16.60% CAGR through 2032 and form the fastest-growing receiving vessel group. Their fixed itineraries provide clear bunkering windows, which support predictable service planning. Avenir LNG completed the first ship-to-ship LNG bunkering for Royal Caribbean’s Icon of the Seas at Roatan, Honduras, in 2025. HD Hyundai received Approval in Principle in September 2026 for a 12,000 cubic meter bunker-vessel concept for cruise applications. The concept supports transfers without a floating pontoon and may expand coverage at tender-based ports. The liquefied natural gas (LNG) ship-to-ship port bunkering services industry can use these vessel-specific configurations to address locations that lack fixed bunkering infrastructure.
Geography Analysis
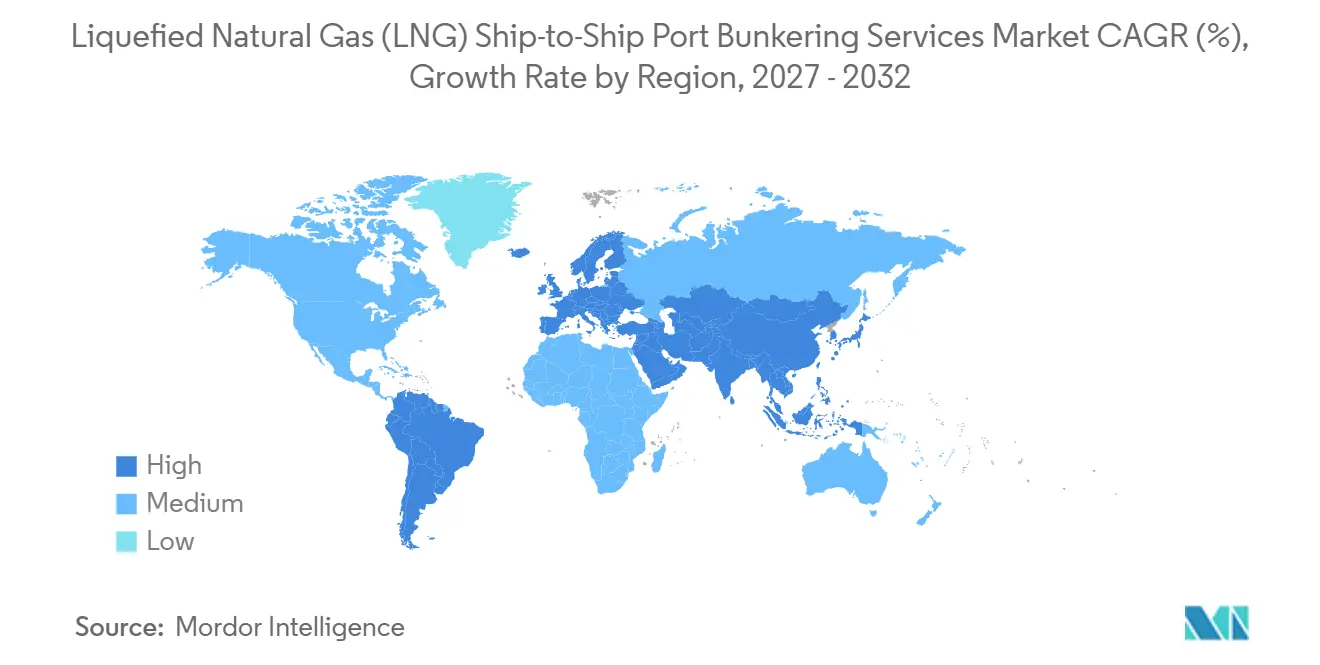
Europe held 34.90% of the liquefied natural gas (LNG) ship-to-ship port bunkering services market size in 2026. The region combines dense ECA traffic, mature bunkering corridors in ARA and the Western Mediterranean, and early implementation of FuelEU Maritime and the EU ETS. Antwerp-Bruges reported a 214% year-over-year increase in LNG bunkering volumes in the first quarter of 2026. Rotterdam and Antwerp-Bruges together recorded a 44% increase during the same period, while bio-LNG sales at major EU ports rose sixfold in the first half of 2026. Iberian Peninsula volumes grew 113%, or 212,000 tons, in 2025. Gasum’s long-term capacity reservation at Klaipeda for 2033-2040 is set to support the continuing role of the Baltic region in maritime LNG supply.
Asia-Pacific records the highest regional CAGR at 16.79% through 2032 in the liquefied natural gas (LNG) ship-to-ship port bunkering services market. Singapore recorded a 48% year-over-year rise in LNG bunker fuel consumption during the first quarter of 2026 to 150,000 tons. The eight new LNG bunkering licenses, effective September 2026, added ExxonMobil, Shell, and a TotalEnergies-Sembcorp Fuels joint venture to the supply base. Chinese ports accounted for nearly 80% of Asia’s 2025 volume growth. Shanghai International Port Group, CNOOC, and PetroChina account for 25% of global LNG bunkering supply. Hokkaido Gas completed Hokkaido’s first international cruise LNG bunkering in 2025, showing a truck-to-ship model for secondary Japanese cruise ports.
North America delivered 833,000 tons of LNG bunkering in 2025, a 57% increase from 2024. The United States contributed 578,000 tons, as the United States East Coast corridor developed through Jacksonville, Port Canaveral, Savannah, and the Bahamas. MOL’s annual Vancouver agreement with Seaspan Energy adds a repeat supply framework on the Pacific Northwest car-carrier route. South America, the Middle East and Africa remain earlier-stage markets with an important supply role. QatarEnergy targets first LNG from North Field expansion in the fourth quarter of 2026 and output of 126 million tons annually by 2027. The liquefied natural gas (LNG) ship-to-ship port bunkering services market in these regions may depend on the availability of terminals, marine logistics, and credible customer demand, while floating supply and relay approaches can provide an interim pathway where dedicated shore-side storage and loading infrastructure are not yet available.
Competitive Landscape
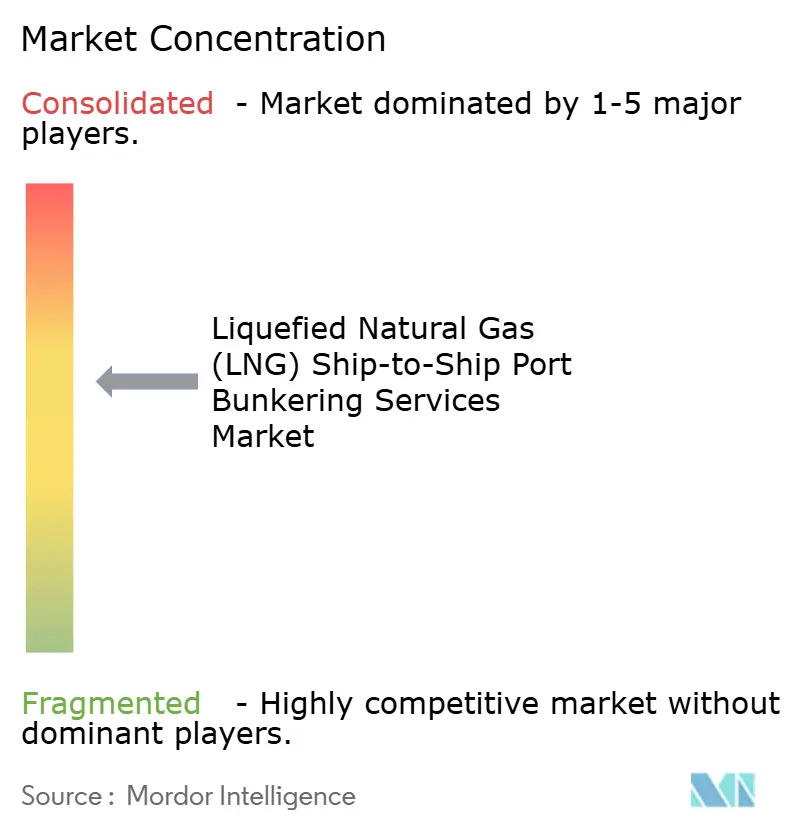
The liquefied natural gas (LNG) ship-to-ship port bunkering services market is moderately consolidated at the upper tier. Shell, TotalEnergies, and Gasum hold leading positions in Northern European ship-to-ship volumes through multi-vessel fleets and long-term agreements with anchor customers. Shell operated 11 bunkering vessels across Asia, Europe, and the Americas, with 4 additional high-capacity vessels planned for 2027-2028 delivery. The TotalEnergies and CMA CGM venture connects a 20,000 cubic meter vessel at Rotterdam with Gate Terminal reload access and long-term customer supply. ExxonMobil entered LNG marine bunkering in October 2025 through time charters for vessels of 20,000 cubic meters and 18,000 cubic meters. These moves show that energy companies are seeking greater control over delivery logistics and customer relationships in the liquefied natural gas (LNG) ship-to-ship port bunkering services market, linking upstream LNG access to marine delivery capability, terminal coordination, and long-duration customer supply commitments.
The mid-market is consolidating while specialist operators maintain strong regional relevance. Molgas Energy Group acquired Titan Clean Fuels in October 2025, creating a combined fleet of 7-8 operational vessels in Northwest Europe and the Mediterranean. Naturgy and Enagas agreed to charter the 18,900 cubic meter Mistral LNG for Iberia, the Strait of Gibraltar, and the Canary Islands from 2028. Gasum expanded its northern European capability through Klaipeda capacity and FuelEU Maritime pooling work with Viking Line and Wallenius SOL. GTT’s membrane-tank approval shows how equipment design can broaden cargo-loading flexibility, even though GTT does not operate bunkering services. The liquefied natural gas (LNG) ship-to-ship port bunkering services market remains open to operators that can combine supply access, vessels, documentation, and local operating permissions.
The most visible opportunities are in under-served cruise ports, certified bio-LNG supply, and emerging regional bunkering corridors. Certified lower-carbon methane can provide a service premium when it improves a customer’s lifecycle compliance position. NYK Line began continuous bio-LNG use for car carriers in July 2025 through Titan Clean Fuels under mass-balance ISCC EU certification. This arrangement illustrates how fuel certification can shape the commercial offer beyond physical delivery. Sea-based reloading can also reduce bottlenecks at congested ports where terminal access constrains fuel availability.
Liquefied Natural Gas (LNG) Ship-to-Ship Port Bunkering Services Industry Leaders
-
Shell plc
-
TotalEnergies SE
-
Gasum Oy
-
FueLNG Pte Ltd.
-
Molgas Energy Holding B.V.
- *Disclaimer: Major Players sorted in no particular order
Recent Industry Developments
- September 2026: NYK Line completed the acquisition of a 50% stake in Avenir LNG from Stolt-Nielsen Gas Ltd., forming a joint ownership structure for Avenir LNG's global bunker vessel fleet to expand LNG and bio-LNG STS bunkering across the Baltic, Mediterranean, and Atlantic.
- August 2026: The European Commission approved the TotalEnergies and CMA CGM 50/50 LNG bunkering JV under the EU Merger Regulation, clearing the partnership to deploy a 20,000-cbm LNG bunker vessel at Rotterdam by the end of 2028, backed by a 360,000-ton/year LNG supply contract through 2040.
- June 2026: Gasum secured 8-year LNG and bio-LNG capacity at Lithuania's Klaipeda LNG terminal for the 2033-2040 cycle, strengthening its STS bunkering supply chain across Northwestern Europe and the Danish Straits.
- February 2026: NYK Line, in partnership with Ocean Yield AS, signed multiple long-term charter contracts with Cheniere Marketing International for new LNG carriers fitted with X-DF2.1 iCER dual-fuel engines and 200,000 cubic meters membrane tanks, with delivery from 2028.
Global Liquefied Natural Gas (LNG) Ship-to-Ship Port Bunkering Services Market Report Scope
| Fuel Supply & Bunkering |
| Bunkering Operations & Transfer Handling |
| Bunkering Coordination & Port Services |
| Measurement, Documentation & Compliance Services |
| Container Ships |
| Cruise Ships |
| Tankers |
| Bulk and General Cargo Ships |
| Ferries and Ro-Ro Ships |
| Car Carriers / PCTCs |
| Other Vessel Types |
| North America | United States |
| Canada | |
| Mexico | |
| South America | Brazil |
| Argentina | |
| Peru | |
| Chile | |
| Rest of South America | |
| Europe | Germany |
| United Kingdom | |
| France | |
| Italy | |
| Spain | |
| Russia | |
| Nordics (Denmark, Finland, Iceland, Norway, and Sweden) | |
| Rest of Europe | |
| Asia-Pacific | China |
| India | |
| Japan | |
| South Korea | |
| Australia | |
| Southeast Asia (ASEAN) | |
| Rest of Asia-Pacific | |
| Middle East and Africa | Saudi Arabia |
| United Arab Emirates | |
| Qatar | |
| South Africa | |
| Nigeria | |
| Egypt | |
| Rest of Middle East and Africa |
| By Service Model | Fuel Supply & Bunkering | |
| Bunkering Operations & Transfer Handling | ||
| Bunkering Coordination & Port Services | ||
| Measurement, Documentation & Compliance Services | ||
| By Receiving Vessel Type | Container Ships | |
| Cruise Ships | ||
| Tankers | ||
| Bulk and General Cargo Ships | ||
| Ferries and Ro-Ro Ships | ||
| Car Carriers / PCTCs | ||
| Other Vessel Types | ||
| By Geography | North America | United States |
| Canada | ||
| Mexico | ||
| South America | Brazil | |
| Argentina | ||
| Peru | ||
| Chile | ||
| Rest of South America | ||
| Europe | Germany | |
| United Kingdom | ||
| France | ||
| Italy | ||
| Spain | ||
| Russia | ||
| Nordics (Denmark, Finland, Iceland, Norway, and Sweden) | ||
| Rest of Europe | ||
| Asia-Pacific | China | |
| India | ||
| Japan | ||
| South Korea | ||
| Australia | ||
| Southeast Asia (ASEAN) | ||
| Rest of Asia-Pacific | ||
| Middle East and Africa | Saudi Arabia | |
| United Arab Emirates | ||
| Qatar | ||
| South Africa | ||
| Nigeria | ||
| Egypt | ||
| Rest of Middle East and Africa | ||
Key Questions Answered in the Report
What is the size of the liquefied natural gas (LNG) ship-to-ship port bunkering services market?
The sector is valued at USD 1.69 billion in 2026 and reaches USD 3.77 billion by 2032 at a 14.80% CAGR, as demand is supported by LNG-fueled vessel deployment, regulatory compliance needs, and the availability of ship-to-ship delivery at established ports.
Which service model leads the liquefied natural gas (LNG) ship-to-ship port bunkering services market?
Fuel supply & bunkering leads with a 45.20% share in 2026, while bunkering coordination & port services grow at a 16.31% CAGR through 2031 because operators increasingly need berth planning, scheduling support, stakeholder coordination, and documentation in addition to physical fuel transfer.
Which vessel category creates the most LNG bunker demand?
Container ships hold 30.10% in 2026, supported by frequent fuel needs on major liner routes, large LNG-capable vessel deployment, and access to commercially developed bunker networks that can handle high-capacity deliveries during constrained port calls.
Which region grows fastest for LNG bunkering services?
Asia-Pacific grows at a 16.79% CAGR through 2032, supported by strong activity in Singapore, investment in regional bunkering infrastructure, and a growing ability to serve container, cruise, and other LNG-fueled vessels across established Asian trade routes.
Why are shipping companies using ship-to-ship LNG bunkering?
The approach can fit fuel delivery into port calls and may allow bunkering to proceed alongside cargo operations at suitable terminals, helping vessels protect schedule reliability while avoiding a separate fuel stop where local safety procedures and transfer conditions allow it.
What constrains wider LNG bunkering deployment?
Large capital requirements, methane-slip compliance exposure, fuel-price uncertainty, and port permitting constraints can delay wider deployment, particularly in secondary ports that lack regular vessel demand, terminal access, dedicated berths, or experienced emergency-response arrangements, where a provider may not achieve the vessel utilization needed to support the investment.