Market Overview
| Study Period | 2020 - 2031 |
|---|---|
| Forecast Data Period | 2026 - 2031 |
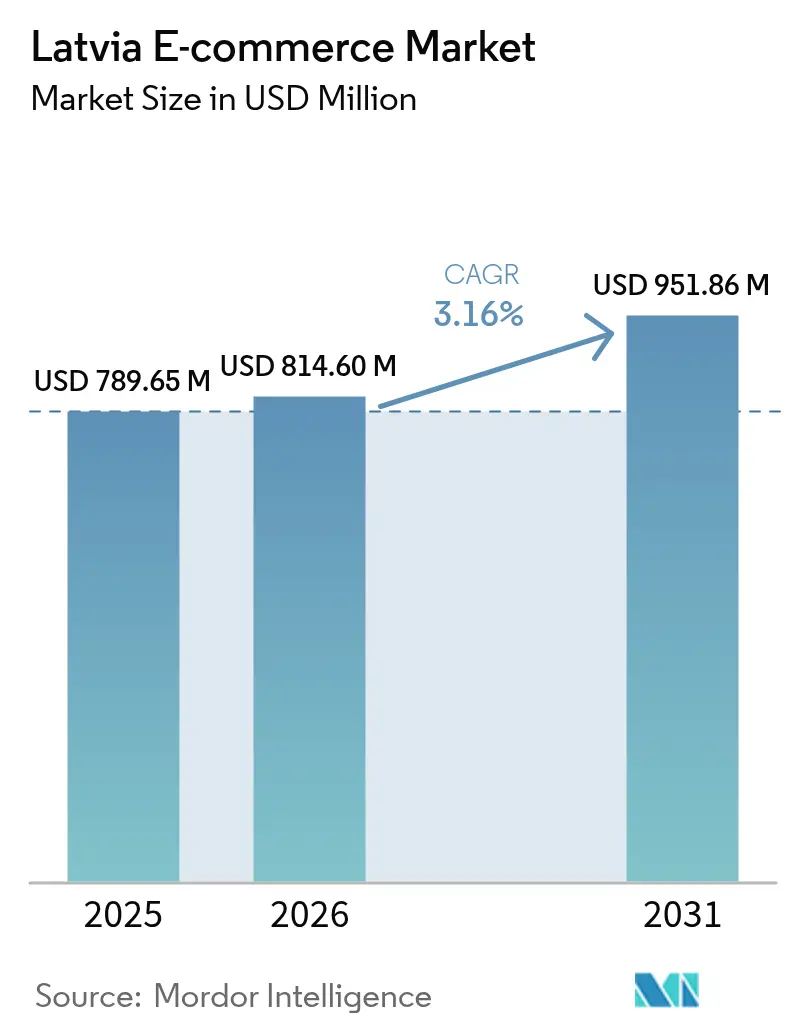
| Base Year Market Size (2025) | USD 789.65 Million |
| Market Size (2026) | USD 814.60 Million |
| Market Size (2031) | USD 951.86 Million |
| Growth Rate (2026 - 2031) | 3.16% CAGR |
| Market Concentration | Medium |
Major Players *Disclaimer: Major Players sorted in no particular order Image © Mordor Intelligence. Reuse requires attribution under CC BY 4.0. | |
Latvia E-commerce Market Analysis by Mordor Intelligence
The Latvia e-commerce market size was valued at USD 789.65 million in 2025 and estimated to grow from USD 814.6 million in 2026 to reach USD 951.86 million by 2031, at a CAGR of 3.16% during the forecast period (2026-2031). Stable broadband connectivity, 5G roll-outs, and a population in which 62% already shop online keep demand resilient even as headline inflation moderates. Mobile devices dominate check-out journeys, while mandatory e-invoicing rules are accelerating digital procurement among firms. Payments innovation—especially instant transfers and BNPL—supports basket-conversion, and a dense parcel-locker network sustains next-day delivery expectations in urban Riga, Liepāja, and Daugavpils. However, ageing demographics and rural last-mile gaps temper the overall growth rate of the Latvia e-commerce market.
Key Report Takeaways
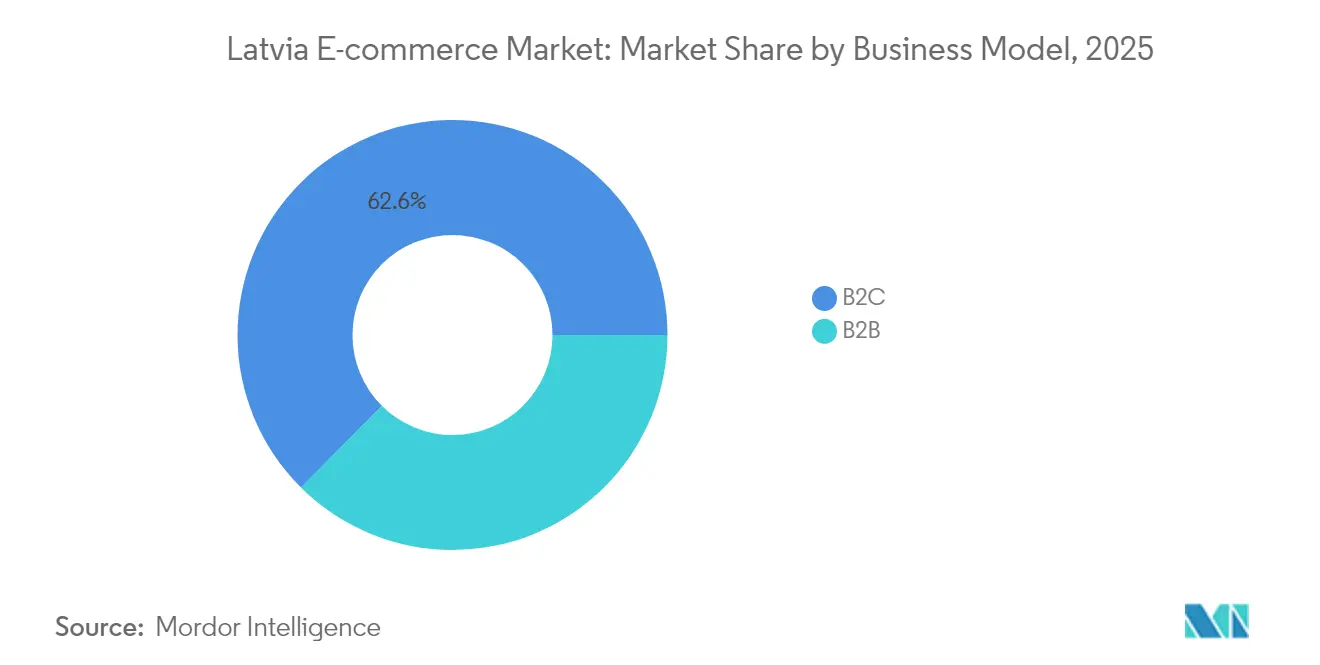
- By business model, B2C commanded 62.55% of the Latvia e-commerce market share in 2025, while B2B is projected to expand at 4.95% CAGR to 2031.
- By device type, smartphones captured 57.62% revenue share of the Latvia e-commerce market in 2025; mobile transactions are pacing ahead at a 5.88% CAGR through 2031.
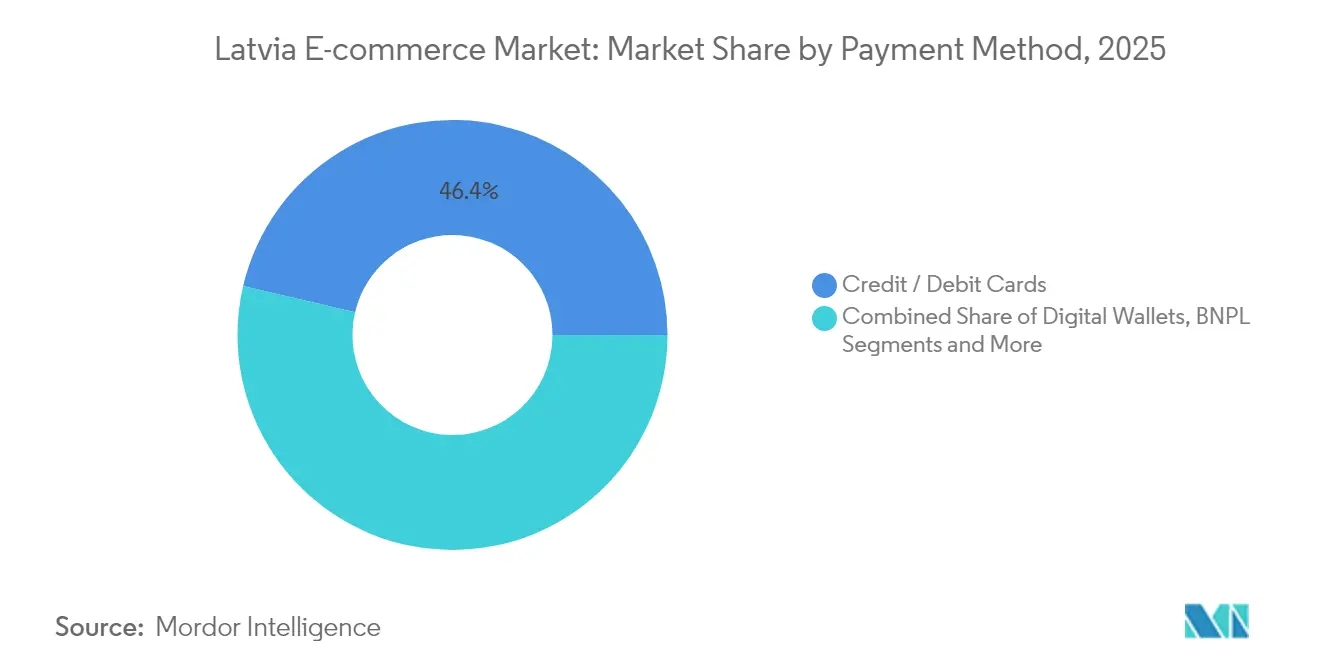
- By payment method, credit/debit cards accounted for 46.35% share of the Latvia e-commerce market size in 2025, whereas BNPL solutions are growing at 5.03% CAGR to 2031.
- By product category, fashion and apparel led with 12.32% of the Latvia e-commerce market share in 2025; food and beverages is on track for a 6.07% CAGR through 2031.
Note: Market size and forecast figures in this report are generated using Mordor Intelligence’s proprietary estimation framework, updated with the latest available data and insights as of 2026.
Latvia E-commerce Market Trends and Insights
Drivers Impact Analysis*
| Driver | (~) % Impact on CAGR Forecast | Geographic Relevance | Impact Timeline |
|---|---|---|---|
| Growing number of e-shoppers | +3.1% | National, with higher impact in urban centers | Medium term (2-4 years) |
| Rising internet penetration and 5G rollout | +1.1% | National, with early gains in Riga, Jurmala, Liepaja | Medium term (2-4 years) |
| Expansion of instant and card-based digital payments | +0.8% | National | Short term (≤ 2 years) |
| Rapid adoption of Buy-Now-Pay-Later and SEPA instant transfers | +0.6% | National, with higher impact in urban areas | Short term (≤ 2 years) |
| AI-driven price comparison boosting marketplace traffic | +0.5% | National | Medium term (2-4 years) |
| Source: Mordor Intelligence | |||
Growing Number of E-shoppers
Latvia’s online-buyer ratio climbed to 65% of the population in 2024, up from 51% in 2021. Senior citizens are increasingly comfortable purchasing via digital channels, expanding the accessible customer pool and forcing merchants to design intuitive storefronts and plain-language service menus. Roughly 42.17% of residents now buy online at least once a month, generating 10.1% of national retail revenue and contributing 1.5% to GDP. Retailers are responding with simplified sign-in flows, guest check-out options, and wider SKU ranges. Loyalty programs are shifting from points to experiential rewards—early access or free locker delivery—to retain this broader demographic.
Rising Internet Penetration and 5G Rollout
Latvia’s operators are scaling 5G, with Bite Latvia aiming for 75% population reach. Faster uplinks enhance live-commerce streams and AR product demos, reinforcing mobile conversion. LMT’s private 5G network at Baltic Container Terminal demonstrates industrial use-cases, lowering dwell times for sea-freight and shortening e-commerce lead times. Public funds of EUR 16.5 million (USD 17.9 million) target gigabit speeds in underserved rural nodes, reducing the urban-rural digital divide that constrains the Latvia e-commerce market.
Expansion of Instant and Card-Based Digital Payments
Twenty-one percent of euro-area day-to-day transactions took place online in 2024, up from 17% in 2022. [1]European Central Bank, “Study on the Payment Attitudes of Consumers in the Euro Area (SPACE) 2024,” ecb.europa.eu Latvian issuers now support 24/7 card clearing and SEPA instant transfers across 53% of current accounts. Real-time settlement shrinks merchant cash-conversion cycles and reduces chargeback risk. Checkout pages offering one-tap card tokenization report lower cart abandonment, especially on mobile screens. Merchants also capitalize on lower acquirer fees for SEPA instant rails relative to legacy card interchange.
Rapid Adoption of Buy-Now-Pay-Later and SEPA Instant Transfers
BNPL volumes are projected to grow 5.20% CAGR, unlocking demand among credit-averse consumers. Installment options raise average order values for consumer electronics and furniture. The EU Instant Payments Regulation encourages pan-European real-time rails, cutting Borderless transfer costs. Latvian gateways that combine BNPL scoring with instant-credit disbursement see improved approval rates and faster merchant settlement, critical for SMEs with limited working capital.
Restraints Impact Analysis*
| Restraint | (~) % Impact on CAGR Forecast | Geographic Relevance | Impact Timeline |
|---|---|---|---|
| EU VAT compliance burden for non-EU sellers | -0.6% | National, with higher impact on cross-border commerce | Medium term (2-4 years) |
| Sparse last-mile logistics in rural municipalities | -0.4% | Rural regions, particularly in Latgale and Vidzeme | Medium term (2-4 years) |
| Ageing population limiting basket-value growth | -0.3% | National, with higher impact in regions with older demographics | Long term (≥ 4 years) |
| Parcel-locker saturation squeezing delivery margins | -0.2% | Urban centers, particularly Riga and regional hubs | Short term (≤ 2 years) |
| Source: Mordor Intelligence | |||
EU VAT Compliance Burden for Non-EU Sellers
Foreign merchants must register for Latvian VAT from the first euro of turnover, facing upfront compliance costs and local-language filings. While the OSS scheme streamlines quarterly returns, the regime still requires evidence archiving inside the EU for 10 years—a hurdle for small Asian sellers. Intermediary marketplaces pass on the administrative overhead via higher commission, making certain low-margin SKU categories unviable. As a result, product variety narrows and price competition softens, marginally muting growth within the Latvia e-commerce market. Trade bodies lobby for enhanced digital guidance portals in English and simplified small-parcel thresholds, yet material relief remains unlikely before 2027.
Sparse Last-Mile Logistics in Rural Municipalities
Urban Latvia enjoys locker density of up to 1 unit per 1,700 residents, but Latgale averages 1 locker per 9,000 residents. Couriers add fuel surcharges for remote deliveries, inflating shipping fees on bulky goods. Food-and-beverage e-grocers therefore limit service radii, slowing penetration of the fastest-growing category. Pilot drone-drop programs remain at proof-of-concept level because Latvian airspace rules require beyond-visual-line-of-sight exemptions. Until rural hubs achieve critical order density, operators will continue to subsidize journeys, reducing profitability and dragging on the Latvia e-commerce market CAGR.
*Our forecasts treat driver/restraint impacts as directional, not additive. The impact forecasts reflect baseline growth, mix effects, and variable interactions.
Segment Analysis
By Business Model: B2B Digitalization Accelerates
The B2C segment represented 62.55% of the Latvia e-commerce market in 2025, underscoring its historic dominance in consumer retail. Mandated structured e-invoicing, however, is stimulating the B2B corridor, which is forecast to grow at 4.95% CAGR to 2031. The Latvia e-commerce market size attributable to B2B transactions is projected to approach USD 388.1 million by 2031, driven by procurement portal upgrades and ERP-gateway integrations. Large suppliers are onboarding SMEs through subscription-based catalogs that cut purchase-order cycle times by 70%.
Twenty-eight indigenous B2B platforms operate as of April 2025, with several leveraging Pay-per-invoice financing to improve buyer liquidity. Cross-dock warehouses near the Port of Riga shorten re-export timelines for Baltic trade, enhancing vendor stickiness. Direct-selling models—recording EUR 78 million (USD 83.6 million) in 2024 sales—augment income opportunities for 59,000 micro-entrepreneurs, many of whom adopt hybrid online–offline fulfillment. This convergence blurs the line between retail and wholesale, sustaining a nuanced value chain that underpins the Latvia e-commerce market.


By Device Type: Mobile-First Strategy Dominates
Smartphones generated 57.62% of 2025 transaction value, putting handsets at the center of the Latvia e-commerce market. Average mobile data usage of 13 GB per connection per month enables high-definition product videos and livestream shopping. Latvia e-commerce market size for mobile channels is expected to cross USD 624.8 million by 2031, outpacing desktop at a 5.88% CAGR. Retailers convert impulse traffic by embedding single-click checkout buttons and leveraging biometric authentication.
Desktop still underpins high-ticket B2B orders where procurement officers require multi-tab comparisons. Tablets and smart TVs form a nascent 4% slice, yet are rising on the back of connected-home adoption. Government statistics show 48.2% of SMEs with basic digital skills in 2023, up 12.5 percentage points year-over-year. That capability expansion positions firms to optimize across screen sizes and fuels omnichannel resilience within the Latvia e-commerce market.
By Payment Method: BNPL Disrupts Traditional Options
Cards retained 46.35% share of the Latvia e-commerce market size in 2025, yet BNPL is the momentum story, advancing 5.03% CAGR. Integration of open-banking APIs reduces credit-decision latency to seconds, pushing BNPL approval rates toward 81%. Instant SEPA rails settle both down-payments and subsequent installments, amplifying cash-flow certainty for merchants.
Digital wallets and account-to-account transfers benefit from PSD2 strong-customer-authentication rules that favor tokenized credentials over static PAN data. The digital euro project aims to cap offline payment fees, potentially displacing cash-on-delivery in rural areas and bolstering financial inclusion. As regulation stabilizes, payment mix diversification reduces single-rail dependency, supporting sustainable growth for the Latvia e-commerce market.
By B2C Product Category: Food and Beverages Surge
Fashion and apparel captured 12.32% Latvia e-commerce market share in 2025, fortified by lenient return policies and influencer-driven merchandising. Nevertheless, food and beverages is forecast to post 6.07% CAGR to 2031, lifting its contribution to the Latvia e-commerce market size to nearly USD 146 million. BARBORA fulfilled 2.7 million Baltic orders in 2023, demonstrating the scalability of temperature-controlled logistics.
Consumer electronics keeps momentum due to high digital literacy and AI-augmented comparison sites. Beauty, DIY, and home furnishings ride content-commerce tactics such as virtual try-ons and room-visualizers. Together, long-tail categories buffer overall market volatility, reinforcing diversification in the Latvia e-commerce market.
Geography Analysis
Riga accounts for the lion’s share of the Latvia e-commerce market, supported by superior 5G coverage, average household incomes 19% above the national median, and locker density that ensures sub-24-hour delivery. Daugavpils, Liepāja, and Jelgava trail but exhibit higher growth curves as their retail ecosystems digitalize. Urban parcel-locker installations climbed 22% in 2024, though operators warn of saturation that may compress courier margins.
Rural districts in Latgale and Vidzeme struggle with service frequency; half-empty courier routes increase per-parcel costs, limiting grocery penetration. The government’s Recovery and Resilience Plan finances gigabit backhaul and community locker hubs, expected online by 2027. Cross-border trade flourishes due to Latvia’s role as a Baltic entrée, yet extended shipping intervals from Asian sellers accentuate the merits of European fulfillment nodes.
Logistics reforms at the Port of Riga—bolstered by LMT’s private 5G network—improve container processing and lower demurrage, indirectly enhancing import lead-times for marketplace sellers. As secondary cities mature, geographic revenue dispersion will broaden, embedding regional inclusivity within the Latvia e-commerce market.
Competitive Landscape
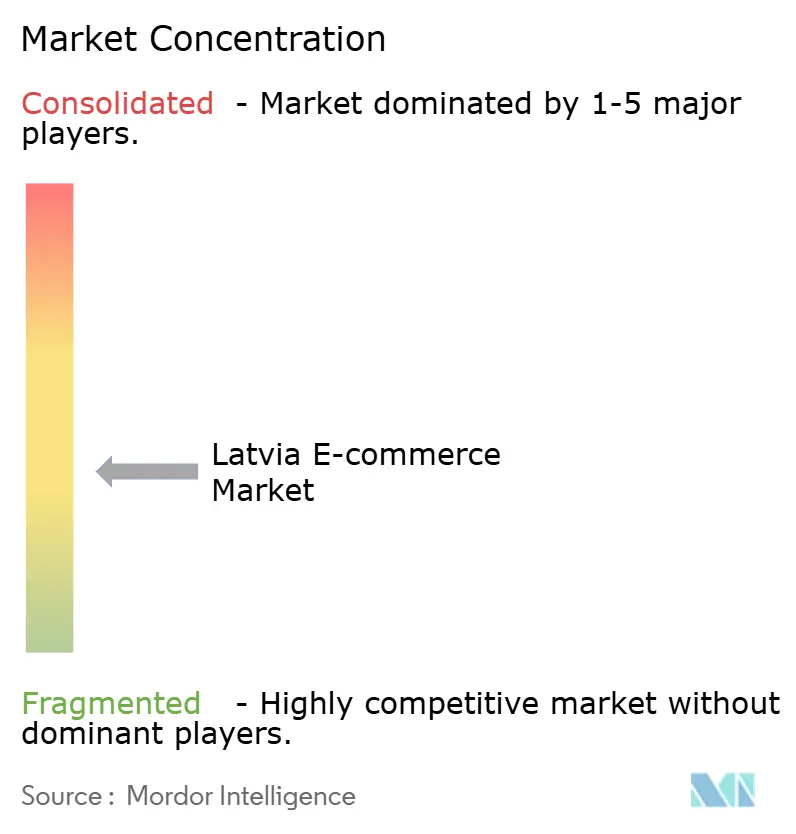
The Latvia e-commerce market operates in a fragmented setting where the top five players hold about 38% combined revenue. Local champion 220.lv receives 2.5 million monthly visits, leveraging localized UX and same-day locker delivery. Maxima’s BARBORA platform scales dark-store picking for grocery, lifting the chain’s total Latvian revenue beyond EUR 1 billion (USD 1.1 billion) in 2024.
Amazon and AliExpress channel demand for niche electronics and hobby supplies, forcing domestic sites to deepen category expertise and enhance Latvian–language support. November 2024’s merger between Printful and Printify unites two of the country’s headline tech scale-ups, pooling R&D spend on on-demand manufacturing APIs that underpin cross-border merchant services.
Competitive advantage increasingly hinges on AI-driven personalization, express delivery windows, and frictionless payments. Smaller retailers forge alliances with 3PL locker networks to defray last-mile costs. Regulatory oversight by Latvia’s Competition Council—quantified as EUR 51.2 million public benefit per annum—maintains price transparency and curbs anticompetitive behavior, fostering a level playing field for the Latvia e-commerce market.
Latvia E-commerce Industry Leaders
Amazon.com, Inc.
220.lv (Pigu Group)
Alibaba Group – AliExpress
Maxima Latvija SIA (e-Maxima)
Rimi Latvia SIA (Barbora.lv)
- *Disclaimer: Major Players sorted in no particular order

Recent Industry Developments
- June 2025: Hestio AS announced plans to scale its e-commerce channel after posting EUR 12.9 million (USD 14.0 million) revenue in 2024.
- May 2025: The Ministry of Finance tabled draft legislation mandating B2G e-invoicing from Jan 2025 and B2B from Jan 2026, accelerating digital procurement adoption.
- February 2025: The ECB reaffirmed the digital euro’s role in reducing retail-payment fragmentation, offering cost advantages to Latvian merchants.
- November 2024: Printful and Printify announced a merger to pool manufacturing technology and cement Riga’s brand as a regional tech hub.


Research Methodology Framework and Report Scope
Market Definitions and Key Coverage
Our study defines Latvia's e-commerce market as all online retail and service transactions completed by Latvian-registered buyers or sellers over fixed or mobile internet networks, spanning B2C webshops, domestic marketplace deals, and local B2B portals that settle through digital payments.
Scope exclusion: We deliberately leave out ride-hailing, third-party meal delivery, and peer-to-peer classifieds whose fee-based models differ from retail e-commerce.
Segmentation Overview
- By Business Model
- B2C
- B2B
- By Device Type
- Smartphone / Mobile
- Desktop and Laptop
- Other Device Types
- By Payment Method
- Credit / Debit Cards
- Digital Wallets
- BNPL
- Other Payment Method
- By B2C Product Category
- Beauty and Personal Care
- Consumer Electronics
- Fashion and Apparel
- Food and Beverages
- Furniture and Home
- Toys, DIY and Media
- Other Product Categories
Detailed Research Methodology and Data Validation
Primary Research
Mordor analysts spoke with fulfillment firms, card processors, pure-play retailers, and omnichannel chains across Riga and the wider regions. These expert conversations confirmed average basket sizes, return ratios, and the pace at which mobile checkouts cannibalize desktop sales, letting us fine-tune key assumptions.
Desk Research
We gathered baseline metrics from Eurostat retail turnover files, Latvia's Central Statistical Bureau, OECD trade tables, and Ecommerce Europe briefs, then enriched them with merchant filings, investor decks, and trusted press releases. D&B Hoovers supplied company financials, while Dow Jones Factiva tracked announcement velocity to flag inflection points. Universal Postal Union parcel counts and customs import logs cross-checked shipment flows against revenue trends. This roster is illustrative; many other sources were tapped to validate insights and clarify anomalies.
Market-Sizing & Forecasting
A top-down demand pool is reconstructed from national retail spend, e-shopper penetration, and modeled ARPU, which are then balanced against sampled merchant GMV roll-ups for a selective bottom-up check. Smartphone share of web traffic, card-to-wallet payment mix, parcel lead times, VAT shifts, and fiber-to-home coverage feed a multivariate regression that projects revenue through 2030. Where roll-ups under-represent micro-sellers, uplift factors tied to tax authority micro-enterprise counts bridge the gap.
Data Validation & Update Cycle
Outputs pass dual analyst reviews, and any variance outside tolerance triggers re-contact with respondents before sign-off. Reports refresh yearly, and interim updates follow whenever legislation or macro shocks materially shift a driver.
Why Mordor's Latvia E-Commerce Baseline Earns Trust
Published estimates differ because firms adopt varying scopes, conversion bases, and update cadences.
We've observed that numbers for 2024 alone range from USD 728.6 million to USD 3 billion.
Benchmark comparison
| Market Size | Anonymized source | Primary gap driver |
|---|---|---|
| USD 789.7 M (2025) | Mordor Intelligence | - |
| USD 728.6 M (2024) | Regional Consultancy A | excludes B2B, relies on modeled ARPU |
| USD 773 M (2024) | Global Consultancy B | includes import spend booked abroad |
| USD 3.01 B (2024) | Industry Association C | uses marketplace GMV and wider service scope |
Key gap drivers include whether B2B flows are counted, how foreign-hosted checkout revenue is treated, and the frequency at which average selling prices are rolled forward.
These comparisons show that Mordor's disciplined scope selection, transparent variables, and consistent refresh cadence provide decision-makers a balanced, repeatable baseline that withstands scrutiny.


Key Questions Answered in the Report
What is the current size of the Latvia e-commerce market?
The Latvia e-commerce market size is USD 814.6 million in 2026 and is forecast to reach USD 951.86 million by 2031.
Which segment is expanding fastest?
B2B transactions are projected to grow at 4.95% CAGR between 2026 and 2031, spurred by mandatory e-invoicing.
How important is mobile commerce in Latvia?
Mobile devices already generate 57.62% of transaction value in 2025 and are growing at 5.88% CAGR, making mobile optimization a strategic priority.
What payment trends should merchants watch?
Cards still hold 46.35% share in 2025, but BNPL solutions and SEPA instant transfers are gaining traction, lowering abandonment rates.
Which product category shows the highest growth outlook?
Online food and beverages sales are expected to climb at 6.07% CAGR through 2031 as grocery delivery becomes mainstream.
How fragmented is the competitive landscape?
With the top five players accounting for about 38% of sales, the market remains competitive, offering room for niche specialists and new entrants.
Page last updated on:


