
Market Overview
| Study Period | 2020 - 2031 |
|---|---|
| Forecast Data Period | 2026 - 2031 |
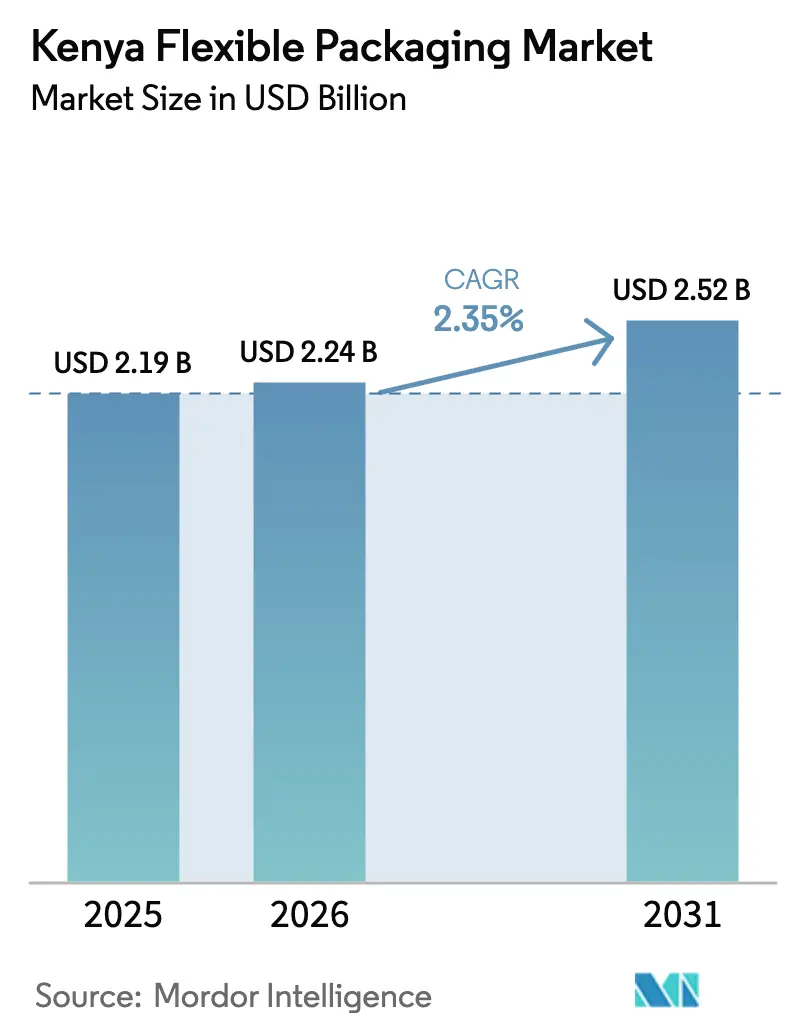
| Base Year Market Size (2025) | USD 2.19 Billion |
| Market Size (2026) | USD 2.24 Billion |
| Market Size (2031) | USD 2.52 Billion |
| Growth Rate (2026 - 2031) | 2.35 % |
| Market Concentration | Medium |
Major Players.webp)
*Disclaimer: Major Players sorted in no particular order Image © Mordor Intelligence. Reuse requires attribution under CC BY 4.0. |
|
Kenya Flexible Packaging Market Analysis by Mordor Intelligence
Kenya flexible packaging market size in 2026 is estimated at USD 2.24 billion, growing from 2025 value of USD 2.19 billion with 2031 projections showing USD 2.52 billion, growing at 2.35% CAGR over 2026-2031. Steady expansion is anchored in Kenya’s role as East Africa’s manufacturing base, public-sector incentives under Vision 2030, and resilient consumer demand in food, personal care, and pharmaceutical segments. Government-backed County Aggregation and Industrial Parks streamline crop aggregation and post-harvest processing, sustaining order volumes even as infrastructure gaps and foreign-exchange swings temper topline growth. Regulatory tightening under the 2024 Extended Producer Responsibility (EPR) rules pushes brand owners toward recyclable or compostable films, accelerating product development in bioplastics. Meanwhile, quick-commerce adoption in Nairobi and Mombasa heightens demand for portion-controlled pouches and sachets that withstand multiple handling points without compromising appearance. Access to geothermal power at the Olkaria Green Energy Park supports cost optimization for energy-intensive extrusion and printing, partially offsetting exchange-rate-driven resin price spikes.
Key Report Takeaways
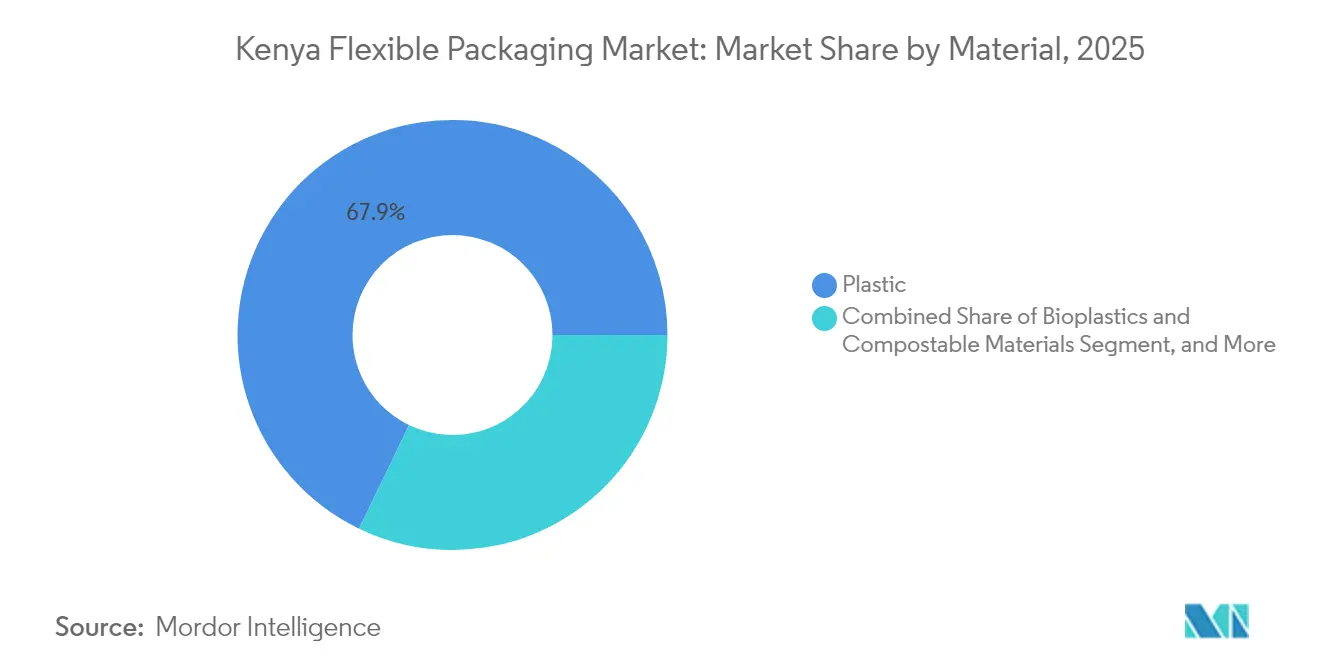
- By material, plastic maintained a 67.85% share of the Kenya flexible packaging market in 2025, whereas bioplastics and compostables are poised for a 4.95% CAGR through 2031.
- By product type, bags and pouches led with 46.92% of the Kenya flexible packaging market share in 2025, while sachets and stick packs are projected to grow at a 4.44% CAGR to 2031.
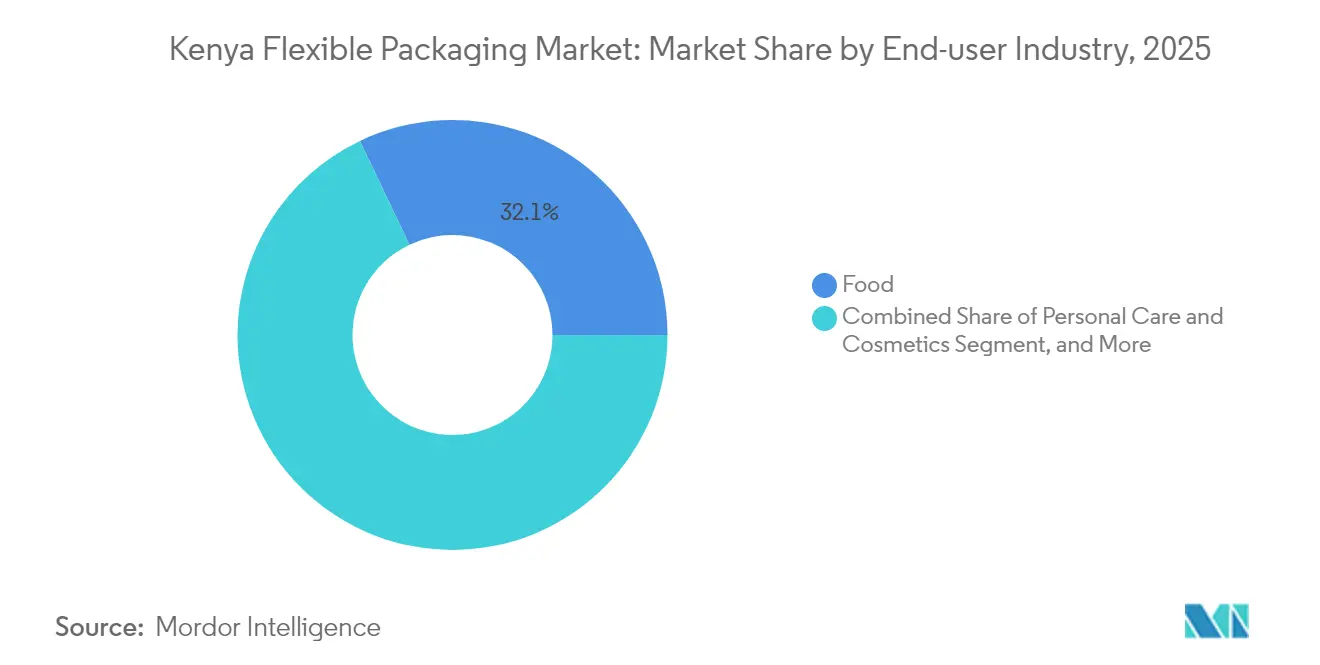
- By end-user industry, food applications represented 32.08% of the Kenya flexible packaging market size in 2025, and personal care and cosmetics is forecast to expand at a 4.71% CAGR through 2031.
- By printing technology, flexography accounted for 45.05% of the Kenya flexible packaging market share in 2025; digital printing is expected to register a 4.89% CAGR between 2026 and 2031.
Note: Market size and forecast figures in this report are generated using Mordor Intelligence’s proprietary estimation framework, updated with the latest available data and insights as of 2026.
Kenya Flexible Packaging Market Trends and Insights
Drivers Impact Analysis*
| Driver | (~) % Impact on CAGR Forecast | Geographic Relevance | Impact Timelin |
|---|---|---|---|
| Rise of branded FMCG and modern retail penetration | +0.8% | National, concentrated in Nairobi, Mombasa, Kisumu | Medium term (2-4 years) |
| Explosive growth of quick-commerce and dark-store models | +0.4% | Urban centers, Nairobi metropolitan area | Short term (≤ 2 years) |
| Agricultural-export upgrade to value-added consumer packs | +0.6% | National, strongest in horticultural zones | Long term (≥ 4 years) |
| Mandatory EPR and recyclability targets | +0.3% | National implementation via NEMA | Medium term (2-4 years) |
| Surge in off-grid solar-powered cold-chain nodes up-country | +0.2% | Rural and semi-urban areas | Long term (≥ 4 years) |
| Corporate carbon-footprint pledges driving light-weighting | +0.3% | Global brands operating in Kenya | Medium term (2-4 years) |
| Source: Mordor Intelligence | |||
Rise of Branded FMCG and Modern Retail Penetration
Modern supermarkets and convenience chains are expanding beyond Nairobi into secondary towns, compelling consumer-goods producers to adopt high-barrier laminates that preserve freshness, support brand visibility, and meet shelf-readiness standards. [1]Propak East Africa, “Packaging,” propakeastafrica.com Local processors investing under Vision 2030’s manufacturing pillar need tamper-evident seals, resealable zippers, and on-pack labelling that comply with Kenya Bureau of Standards food-safety rules. Flexible films enable SKU proliferation for new flavors and pack sizes without large mold investments, a critical advantage in promotional-driven retail environments. Branded packs also reduce the grey-market diversion that erodes margins in traditional trade channels. As more retailers demand traceability, converters offering variable-data printing gain priority status in supplier rosters.
Explosive Growth of Quick-Commerce and Dark-Store Models
Same-hour delivery platforms require packaging that survives multiple touchpoints from automated picking through motorbike transport to the consumer’s doorstep. Dimensional efficiency becomes vital for basket-optimization algorithms, pushing converters to engineer thinner, stronger multi-layer pouches. Urban consumers increasingly reject over-packaging, so lightweight mono-material films compatible with soft-plastic take-back schemes are in demand. Dark stores favor easy-tear features for rapid order assembly, which in turn drives adoption of laser-scored sachets. Brands leverage digitally printed limited-edition graphics to differentiate in app-based storefronts where thumbnail images influence conversion rates. The intersection of speed, protection, and sustainability positions flexible packaging as the preferred format for Kenya’s quick-commerce boom.
Agricultural-Export Upgrade to Value-Added Consumer Packs
Horticultural exports topped 580,648 t in the first 10 months of 2023, and government programs now subsidize pack-houses that add consumer-ready presentation for European supermarkets. Lightweight liners such as Cargolite cartons reduce airfreight costs and carbon footprint while maintaining structural integrity for cut flowers. AI-enabled cold-chain monitoring from the Kenya Agriculture and Livestock Research Organization informs film-selection decisions to control respiration rates and ethylene migration. Exporters increasingly demand modified-atmosphere pouches for ready-to-eat fresh produce, spurring localized production of barrier films once imported from South Africa. The upshift to retail-ready packs boosts converter margins because technical specs and certification requirements limit low-end competition.
Mandatory EPR and Recyclability Targets
The 2024 Sustainable Waste Management Regulations require every package placed on the market to be reported, and fees are assessed per kilogram through Producer Responsibility Organizations such as KEPRO. Converters must generate lifecycle data and submit design-for-recycling evidence, which raises compliance costs yet positions early movers as preferred suppliers to multinational FMCG firms bound by global circular-economy pledges. Demand is rising for mono-polyolefin laminates that meet polyethylene recycling streams and for compostable films certified to EN 13432. EPR fees also accelerate light-weighting because lower material use translates directly into lower levy payments. The rules shift competitive advantage toward firms with in-house lab testing, chain-of-custody documentation, and accredited recycling partners.
Restraints Impact Analysis*
| Restraint | (~) % Impact on CAGR Forecast | Geographic Relevance | Impact Timeline |
|---|---|---|---|
| FX-driven resin cost volatility | -0.5% | National, affecting all importers | Short term (≤ 2 years) |
| Chronic electricity supply gaps outside Nairobi industrial parks | -0.3% | Rural and secondary urban manufacturing zones | Medium term (2-4 years) |
| Informal micro-packers diluting quality and price discipline | -0.4% | National, concentrated in peri-urban areas | Medium term (2-4 years) |
| Talent scarcity for high-speed printing and lamination lines | -0.2% | National, acute in specialized manufacturing zones | Long term (≥ 4 years) |
| Source: Mordor Intelligence | |||
FX-Driven Resin Cost Volatility
Polyethylene and polypropylene are imported in U.S. dollars, so shilling depreciation quickly inflates raw-material bills that constitute 60-70% of converter costs. [2]Central Bank of Kenya, “Monthly Exchange Rate (Period Average),” centralbank.go.ke While large players hedge through forward contracts, smaller firms struggle to finance letters of credit, forcing them to accept spot prices and eroding margins. Frequent price revisions alienate price-sensitive agricultural clients who negotiate annual contracts pegged in local currency. High import bills also raise working-capital requirements, limiting funds for equipment upgrades. Although a managed float offers some stability, global crude-based resin price swings add an extra layer of unpredictability that acts as a brake on capital-spending plans.
Chronic Electricity Supply Gaps Outside Nairobi Industrial Parks
Extrusion and lamination lines suffer costly downtime when power dips, causing waste and off-spec runs that must be scrapped. Utilities report over 14 interruptions a month in industrial zones beyond Athi River, compelling converters to invest in diesel gensets that raise energy costs to 28 US cts/kWh versus the grid’s 15 US cts/kWh. [3]The Standard Opinion Desk, “Why Kenya's manufacturing future hubs on clean energy,” standardmedia.co.ke Thermal-shock damage to motors accelerates maintenance cycles and shortens equipment life. Even when grid power is available, voltage variability affects color consistency in flexo printing. The forthcoming Olkaria Green Energy Park offers geothermal electricity at 7 US cts/kWh, but uptake is limited by distance from customer clusters in Nairobi. Until distribution upgrades materialize, power reliability will remain a growth bottleneck.
*Our forecasts treat driver/restraint impacts as directional, not additive. The impact forecasts reflect baseline growth, mix effects, and variable interactions.
Segment Analysis
By Material: Sustainability Moves the Center of Gravity
Plastic captured 67.85% of the Kenya flexible packaging market in 2025 thanks to its cost-effectiveness, seal integrity, and adaptability across verticals. However, EPR levies and brand-owner carbon pledges channel R&D budgets toward starch-based and polylactic-acid films that degrade under industrial compost conditions. Bioplastics are projected to grow at a 4.95% CAGR to 2031, outpacing overall market growth and narrowing the price gap with conventional polymers through duty waivers on imported feedstocks. Paper/foil laminates retain niche appeal in premium biscuits and confectionery, while aluminum foil continues as the barrier of choice in high-value pharmaceuticals that require <0.1 cc/m²/day oxygen transmission.
Kenyan converters upscale by integrating additive masterbatches like Vitapak’s VP Bioadd, which enables oxo-biodegradation per ASTM D5511 without compromising optical clarity. Investments in tandem extrusion lines support the production of mono-material PE-PE structures compatible with Nairobi’s soft-plastic take-back scheme. Still, plastics will remain the economic backbone of the Kenya flexible packaging market through 2030 because rigid packaging substitutes cannot meet the lightweight ratios demanded by food processors. Long-term shifts will hinge on steady resin supply at predictable prices and on the scalability of local composting infrastructure.



By Product Type: Portion Control Shapes Demand Curves
Bags and pouches contributed 46.92% to the Kenya flexible packaging market size in 2025 due to broad usage across grains, fertilizers, and detergents. The format benefits from manufacturing economies of scale, easy palletization, and established filling machinery in local factories. Films and wraps persist in bulk agriculture, but their share is edging lower as brands migrate to pre-formed stand-up pouches that provide billboard-like shelf impact. Sachets and stick packs are forecast to lead growth at a 4.44% CAGR thanks to urban consumers preferring single-use packs aligned with daily wage cycles.
Digital presses such as Canon’s V1350 reduce minimum order quantities, encouraging hyper-segmented flavors and promotional artwork without holding costly inventories. Automated multi-lane form-fill-seal equipment widens the cost advantage of stick packs in instant beverage powders and condiments. However, sachet litter remains a public concern, so brand owners test water-soluble films and rigid-paper micro-canisters. Continued innovation is likely to tilt the product mix toward reclosable small packs that balance convenience with lower material-to-product ratios.
By End-User Industry: Food Security at Center Stage
The food sector commanded 32.08% of the Kenya flexible packaging market in 2025 because processors rely on oxygen- and moisture-barrier laminates to cope with a 90 km average farm-to-market distance. Government subsidies for post-harvest cold-chain link solar-powered coolers to multi-layer films that slow respiration in fresh-produce packs. Demand for ready-to-eat cereals and frozen snacks is expanding among the middle class, driving the adoption of microwaveable pouches with susceptor layers. Beverage companies increase orders for retortable spouted pouches that reduce transportation costs by 35% versus glass.
Personal care and cosmetics will post the fastest gains at a 4.71% CAGR through 2031 as rising disposable income boosts consumption of hair-care sachets and moisturizers. Flexible tubes with high-definition flexo printing position local brands alongside international imports on pharmacy shelves. Pharma demand leans on aluminum-foil laminates for moisture-sensitive antibiotics, while agrochemical users shift to co-extruded fitments that prevent spillage. Each vertical’s trajectory underscores how the Kenya flexible packaging market rewards converters capable of customizing barrier, dispensing, and decoration features.
By Printing Technology: Hybrids Bridge Volume and Agility
Flexography held 45.05% of the Kenya flexible packaging market share in 2025, owing to dependable line speeds and declining plate costs. New CI flexo presses with automatic register control cut makeready waste, making the process viable for runs as low as 1,500 m². Rotogravure still owns premium confectionery wrappers where high-density metallic inks drive shelf appeal, but cylinder costs deter short campaigns. Digital printing’s projected 4.89% CAGR stems from e-commerce brands launching micro-series SKUs; their break-even point favors inkjet at fewer than 10,000 impressions.
Converters respond with hybrid workflows, laminating digitally printed top webs to flexo-printed bottom webs, combining agility with cost efficiency. Platinum Packaging’s twin Bobst Master M6 lines integrate inline inspection to maintain ±50 micron register tolerance even at 400 m/min, and an HMI interface reduces changeover to 6 minutes. Meanwhile, desktop digital varnish units add tactile finishes on demand, supporting premiumization in cosmetics. Print-technology convergence will accelerate as brand owners impose shorter lead times and request serialized QR codes for traceability.
Geography Analysis
Nairobi’s Industrial Area and Athi River corridor host more than 60% of Kenya flexible packaging market output, leveraging proximity to FMCG headquarters, port logistics, and skilled technicians. Rental prices in Athi River rose 6.7% in 2024, prompting manufacturers to scout satellite hubs such as Juja and Ruiru, where land costs remain 30% lower, yet road links connect efficiently to the Northern Bypass. County governments co-fund CAIPs that bundle access roads, wastewater plants, and customs one-stop shops, enabling startups to cut commissioning time by six months. For resin-intensive operations, Naivasha’s Olkaria Green Energy Park offers geothermal power priced at USD 0.07 per kWh, slashing electricity bills by half compared with grid averages.
Mombasa Industrial Park serves coastal agro-exporters needing proximity to the port, but chronic congestion on the Mombasa-Nairobi highway drives some converters inland. In western Kenya, Mumias Agri-Processing Zone targets cane-based bioplastics, signaling regional diversification from the Nairobi core. Cross-border trade under the East African Community’s common external tariff allows Kenyan converters to ship duty-free to Uganda, Tanzania, and Rwanda. In 2023, plastic hose exports hit USD 688,840, with Rwanda accounting for USD 166,200, underscoring the Kenya flexible packaging market’s regional reach.
Logistics-intensive sectors favor Nairobi for inbound airfreight of high-spec barrier films and outbound charter flights of horticultural produce. However, companies relying on bulky inputs such as kraft paper locate near Mombasa to save on inland container costs. Supply-chain fluidity influences site selection as operators weigh energy premiums, land price trajectories, and customer clustering against customs efficiencies. Geographic fragmentation will rise as green industrial parks proliferate, yet Nairobi will retain primacy due to its dense ecosystem of ink suppliers, pre-press studios, and maintenance contractors.
Regulatory Landscape
The Environmental Management and Coordination Regulations, 2024 (Legal Notice 181 of 2024) set requirements for plastic packaging manufacture, import, and use under NEMA oversight. KEBS certification schemes cover packaging used in food applications, and Environmental Management Systems (EMS) certification aligned to the ISO 14000 series helps firms demonstrate compliance maturity.
For pre-packaged foods, labelling requirements follow East African Standard EAS 38:2024, which emphasizes ingredient declarations and date markings. Imported packaging and inputs clear through Pre-Export Verification of Conformity to Standards (PVoC), creating an upstream gate that can affect lead times and supplier qualification.
Value Chain Analysis
Kenya’s flexible packaging value chain typically begins with imported inputs such as resins, inks, adhesives, and high-barrier substrates, followed by local film extrusion or conversion. NEMA licensing applies to manufacture, import, and export activities, and Extended Producer Responsibility (EPR) requirements push lifecycle documentation across the chain.
Converters sell into FMCG, food processing, personal care brands, and pharmaceutical packers, where fast SKU turnover and frequent artwork changes increase the need for pre-press capabilities and tighter production planning. Output and services remain concentrated around Nairobi and Mombasa hubs, while County Aggregation and Industrial Parks and the Olkaria Green Energy Park support processing segments through energy and logistics.
Competitive Landscape
The Kenya flexible packaging market hosts a blend of legacy family-owned converters and global entrants, creating a moderate concentration. General Printers Limited leverages four decades of local sourcing relationships to secure volumes in staple food liners, while Platinum Packaging differentiates through solvent-free lamination and food-grade cleanroom certification. Newcomer Nexgen Packaging assembled a green-certified Nairobi plant in April 2024 to supply care labels and heat-transfer films, bringing enterprise resource planning integration that speeds artwork approvals.
Technology investments define competitive edge. Skanem Interlabels added an automated Bobst Master M5 line with turret rewinding and driven chill drums to double output in health-and-beauty labels. Locally, Sky Labels expanded into a 4,000 m² factory, indicating confidence in sustained demand for pressure-sensitive formats. Foreign players like Mondi influence market dynamics indirectly by licensing paper-based barrier solutions that local converters adopt under partnership deals. Meanwhile, informal micro-packers remain active but gradually lose share as supermarkets enforce traceability documentation and as EPR levies penalize non-compliant packaging.
Strategic alliances with raw-material suppliers have become vital to mitigate resin volatility. Larger Kenyan converters negotiate quarterly indexed pricing with Middle-East polymer producers, shielding themselves from spot-market shocks. Some players explore vertical integration into film extrusion to secure supply and capture margin. Intellectual-property barriers remain low, so customer service, on-time delivery, and regulatory advisory support define supplier stickiness. Sustainable-material processing capacity will be the next battleground as multinational brands move toward regional recycled-content mandates.
Kenya Flexible Packaging Industry Leaders
-
Ramco Plexus Ltd.
-
Flexipac Limited
-
Polyflex Industries Limited
-
Silafrica Plastics & Packaging International Ltd
-
Huhtamaki Oyj
- *Disclaimer: Major Players sorted in no particular order


Market Opportunities and Future Outlook
EPR plans are required for manufacturers, importers, and users of plastic packaging to improve recycling, recovery, and treatment. Labeling, minimum recycled content, and traceability requirements also support circular packaging practices, which shifts commercial demand toward designs that can meet recycling and reporting expectations.
Licensing requirements for plastic packaging activities under NEMA frame the transition and encourage packaging firms to develop recyclable and compostable films, with PVoC acting as a practical compliance gate for imported inputs. The market also draws opportunities from standards-driven upgrades such as EAS 38:2024 labeling and KEBS certification schemes, along with the location advantages of the Olkaria Green Energy Park and County Aggregation and Industrial Parks that support energy-aware conversion capacity and regionally connected supply chains.
Recent Industry Developments
- March 2026: Packaging Industry - The 10th Propak East Africa Expo was held at the Sarit Expo Centre to promote world-class packaging standards for trade competitiveness. The event points to ongoing modernization efforts across Kenya's packaging ecosystem. It supports competitiveness by aligning local converters with global best practices and drawing regional investment.
- February 2026: Regulatory Authorities - Enforcement of the Extended Producer Responsibility (EPR) regulations intensified, with retailers barred from stocking non-compliant plastic packaging. The tightening lifts compliance expectations across the supply chain. It also accelerates the move toward recyclable films and other sustainable packaging solutions.
- October 2024: Ramco Plexus Ltd - The Competition Authority of Kenya (CAK) approved the acquisition of sole control of Ramco Plexus Ltd by Mauritius-based Ramco Inc. after Amethis Africa Finance Ltd exited as the joint partner. The clearance allows Ramco Inc to consolidate operations in East Africa. It increases Ramco's footprint and could reshape competitive dynamics for local players.


Research Methodology Framework and Report Scope
Market Definition and Coverage
For this study, the Kenya flexible packaging market covers revenues generated from flexible packs sold for end-use applications in Kenya, where the package is designed to bend and conform to the product during handling, storage, and use.
Scope exclusions: Rigid packaging formats such as glass, metal cans, and hard plastic containers are excluded from this market sizing.
Segmentation Overview
-
By Material
- Paper
- Plastic
- Metal Foil
- Bioplastics and Compostable Materials
-
By Product Type
- Bags and Pouches
- Films and Wraps
- Sachets and Stick Packs
- Labels and Sleeves
-
By End-user Industry
-
Food
- Baked Goods
- Snacks
- Meat, Poultry and Seafood
- Confectionery
- Pet Food
- Other Food Products
- Beverage
- Healthcare and Pharmaceutical
- Personal Care and Cosmetics
- Agriculture and Horticulture
- Other End-User Industries
-
Food
-
By Printing Technology
- Flexography
- Rotogravure
- Digital Printing
- Other Printing Technologies
Data Sources, Market Sizing, and Validation
Desk Research
Desk work started with building a clear Kenya demand picture for packaged goods, import dependence, and materials availability, because flexible packaging demand is closely tied to what gets produced and consumed locally. We referenced public datasets and articles that help anchor the model, such as Kenya National Bureau of Statistics releases, Kenya Revenue Authority trade statistics, the Central Bank of Kenya macro indicators, and UN Comtrade for cross-checking packaging-related material flows.
To translate that context into a workable sizing file, we also relied on sources such as government and regulator websites for policy signals, association portals for sector activity, peer-reviewed journals for material trends, and company annual reports and investor decks for packaging investment cues. Where needed, we used an approved paid subscription for company financials and intelligence, and an import-export shipment-level database to sanity-check the direction of packaging substrate movements. The sources listed here are not exhaustive, and we used additional public and paid references to collect, validate, and clarify inputs.
Primary Interviews and Surveys
We speak with packaging converters, importers, brand and procurement teams, distributors, and regulators in Kenya. Interviews and surveys clarify volumes, material mix, end-use demand, prices, capacity use, and export leakage. We compare these responses with trade, production, and policy evidence to address data gaps and set the final assumptions for the Kenya estimate.
Distribution of primary research fieldwork respondents
| Company type | Respondent position |
|---|---|
| Top tier: 30% | CXOs: 15% |
| Mid tier: 50% | Functional/Unit leaders: 30% |
| Smaller Players: 20% | Managers: 55% |
Market-Sizing & Forecasting
Sizing was built using a top-down and bottom-up logic, where Kenya packaging demand is first reconstructed from end-use production and consumption signals and then tested against supply-side reality checks. In practice, the top-down layer used indicators like packaged food and beverage output direction, pharmaceutical and personal care activity, packaging material import trends, and inflation-linked price movement to arrive at a country total that makes economic sense.
That total was then corroborated with selective bottom-up approximations, such as sampled converter revenue mapping, channel checks on typical pack mix, and an ASP-by-format view applied to estimated volumes for major applications. Because full company-by-company rollups are not always available, gaps were handled by using conservative ranges from interviews and then normalizing them to match observed trade and demand signals. For forecasting, scenario analysis was used, since the market can shift with resin costs, currency conditions, and policy enforcement, and then the final path was chosen based on what primary respondents viewed as most realistic for the next few years.
Data Validation & Update Cycle
Outputs were checked in several steps so that one unusual assumption does not drive the final market value. We compared the model totals with independent signals like packaging material availability, end-use production direction, and price movement patterns, and then traced any large variances back to the underlying inputs.
When a mismatch persisted, respondents were re-contacted and the assumption was revised or bounded, followed by an internal analyst review before sign-off. Reports are refreshed annually, with interim updates when material events happen, such as major policy changes, sharp currency swings, or large capacity additions. Before delivery, a final pass is completed to ensure the latest public releases and field feedback are reflected.
Mordor Intelligence's Kenya Flexible Packaging Market Size Versus Other Published Estimates
Published market values for Kenya flexible packaging can look far apart, even when they talk about similar end uses, because coverage boundaries and the way prices are applied tend to differ. The table below makes the spread visible, and it also points to the main causes, which usually come from what is counted as flexible packaging, the base year picked, and whether the value reflects producer revenues or only a narrower traded portion.
The table shows a much larger value in USD terms in one estimate versus another, and in Mordor Intelligence's model the figure reflects a broad packaging value pool across materials and applications within Kenya, rather than a narrower slice tied mainly to traded wrappers or a limited set of end-use categories.
Benchmark comparison
| Source | Market Size | Gaps in Research Methodology |
|---|---|---|
| Mordor Intelligence | USD 2.19 B (2025) | |
| Trade Journal A | USD 0.30 B (2024) | Uses a different base year and appears closer to a narrower definition that can lean toward selected wrappers and traded volumes, which can understate locally produced flexible packs consumed within Kenya. |
| Regional Consultancy B | USD 0.72 B (2026) | Likely applies a tighter converter revenue scope and a higher growth framing, with limited visibility on how ASPs and format mix are progressed across food, pharma, and household categories. |
Taken together, the comparison suggests that scope and valuation mechanics explain most of the gap, more than true demand disagreement. By keeping the inputs tied to observable end-use signals and then cross-checking them with supply-side interviews and price logic, the final market number stays traceable to clear steps that can be repeated and reviewed.


Key Questions Answered in the Report
What is the current value of the Kenya flexible packaging market?
The Kenya flexible packaging market size reached USD 2.24 billion in 2026 and is projected to grow to USD 2.52 billion by 2031.
Which material dominates flexible packaging in Kenya?
Conventional plastics hold a 67.85% market share, although bioplastics are the fastest-growing option.
Which product type is expanding the fastest in Kenya?
Sachets and stick packs are forecast to advance at a 4.44% CAGR as urban shoppers embrace portion-controlled formats.
How are EPR rules affecting Kenyan converters?
EPR regulations impose reporting and end-of-life fees, pushing converters toward mono-material, recyclable, and compostable films.
Where are new flexible-packaging factories locating in Kenya?
Besides Nairobi, investors favor Athi River, Naivasha’s Olkaria Green Energy Park, and emerging County Aggregation and Industrial Parks for energy and land-cost advantages.
What printing technology is gaining share?
Digital printing is growing at a 4.89% CAGR due to demand for short runs, personalization, and rapid turnaround.
Page last updated on:


 Your data is secure and never sold or shared.


