
Energy & Power
30th JulyUnlocking Market Potential for Solid-State Transformers
3 Min Read
The Italy Electric Vehicle Charging Equipment Market Report is Segmented by Charging Level (Level 1, Level 2, DC Fast, Ultra-Fast, and Megawatt Class), Installation Site (Residential, Commercial and Retail, Public Municipal, and Transportation Hubs), and Application (Home, Workplace, Public Urban, Highway Corridor/En-Route, and Fleet and Depot). The Market Sizes and Forecasts are Provided in Terms of Value (USD).
Market Overview
| Study Period | 2021 - 2031 |
|---|---|
| Base Year For Estimation | 2025 |
| Forecast Data Period | 2026 - 2031 |
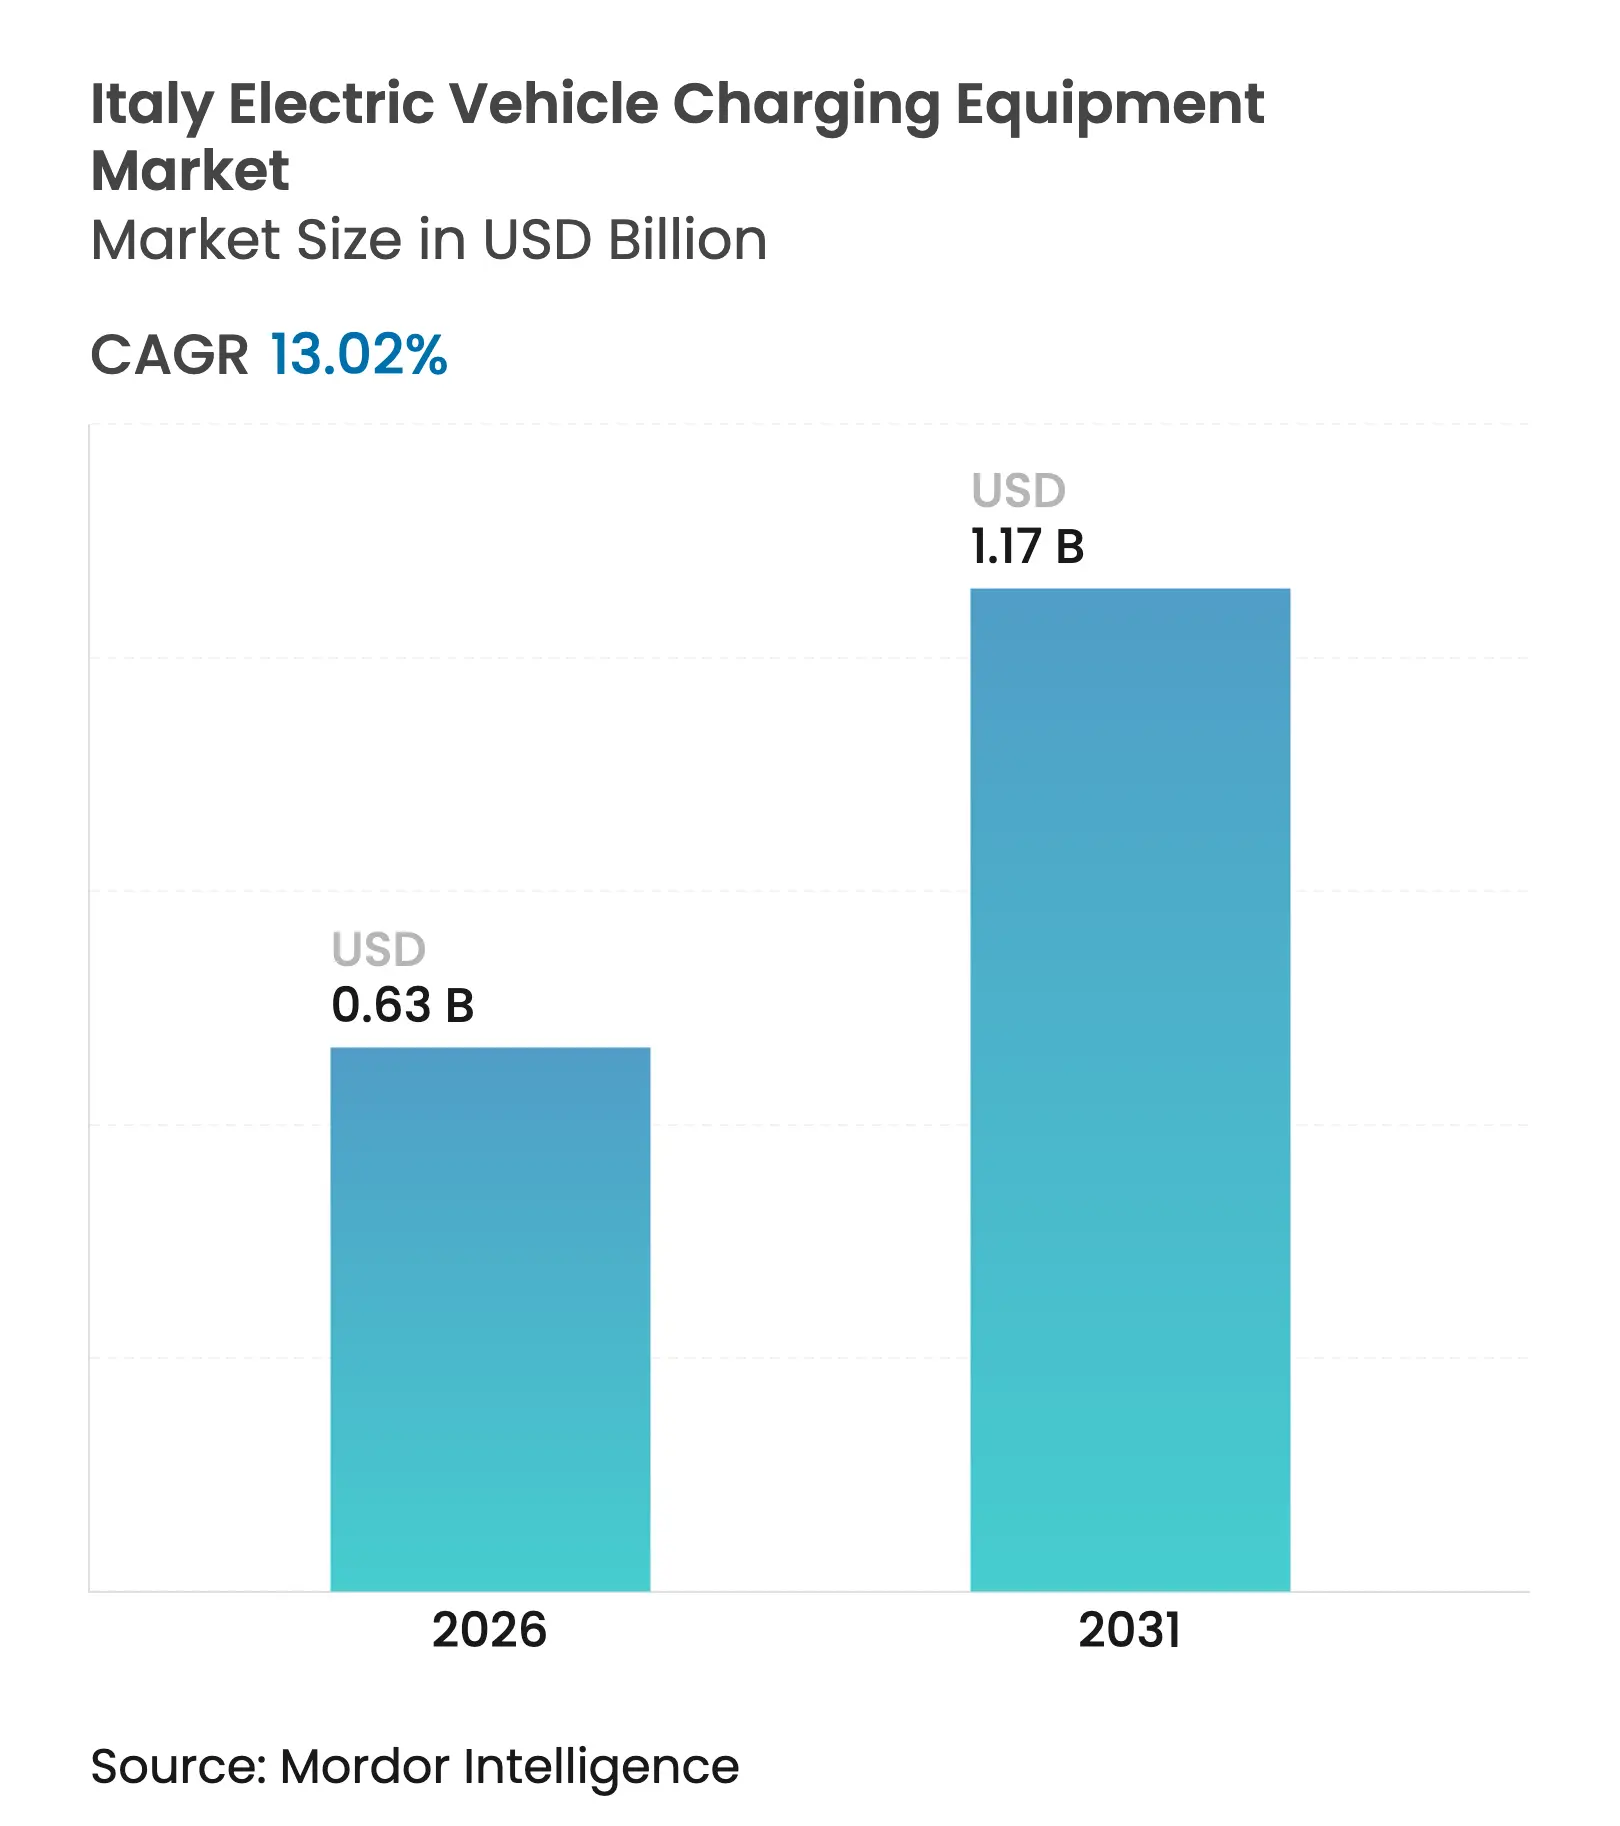
| Market Size (2026) | USD 0.63 Billion |
| Market Size (2031) | USD 1.17 Billion |
| Growth Rate (2026 - 2031) | 13.02 % CAGR |
| Market Concentration | Medium |
Major Players *Disclaimer: Major Players sorted in no particular order. Image © Mordor Intelligence. Reuse requires attribution under CC BY 4.0. |
Growth is shaped by three concurrent dynamics: rising residential demand from early adopters, accelerating ultra-fast corridor rollout to meet long-haul mobility, and bulk depot projects for municipal and logistics fleets. The Alternative Fuels Infrastructure Regulation (AFIR) obliges the country to install one public charging point for every kilowatt of EV battery capacity sold, forcing municipalities and highway concessionaires to compress permitting timelines. Italy’s National Recovery and Resilience Plan (PNRR) earmarks EUR 731 million for 21,000 public chargers by 2026, but many southern comuni still face medium-voltage grid bottlenecks. Utility-backed operators such as Enel X Way and Be Charge leverage existing grid assets to speed deployment, while hardware specialists such as Alpitronic and Kempower compete on power density and uptime guarantees. Headline risks include 12- to 18-month municipal permitting queues, EUR 100,000-plus transformer upgrades for >150 kW sites, and declining utilization at city public chargers as home-charging penetration rises.
Key Report Takeaways
Note: Market size and forecast figures in this report are generated using Mordor Intelligence's proprietary estimation framework, updated with the latest available data and insights as of 2026.
Drivers Impact Analysis
| Driver | (~) % Impact on CAGR Forecast | Geographic Relevance | Impact Timeline | |||
|---|---|---|---|---|---|---|
Supportive government purchase-tax incentives & reduced parking tariffs Supportive government purchase-tax incentives & reduced parking tariffs | +2.8% | National, higher uptake in Lombardy, Lazio, Emilia-Romagna | Short term (≤ 2 years) | (~) % Impact on CAGR Forecast:+2.8% | Geographic Relevance:National, higher uptake in Lombardy, Lazio, Emilia-Romagna | Impact Timeline:Short term (≤ 2 years) |
Integration of renewables driving demand for smart charging & energy-management systems Integration of renewables driving demand for smart charging & energy-management systems | +3.1% | National, concentrated in northern solar zones | Medium term (2-4 years) | |||
Logistics-fleet electrification creating bulk orders Logistics-fleet electrification creating bulk orders | +3.5% | National, early gains in Milan, Bologna, Rome | Medium term (2-4 years) | |||
AFIR mandating charger density per kW sold AFIR mandating charger density per kW sold | +2.6% | National, EU compliance framework | Long term (≥ 4 years) | |||
Emerging bidirectional V2G pilot projects Emerging bidirectional V2G pilot projects | +1.3% | National, pilots in Piedmont, Veneto, Tuscany | Long term (≥ 4 years) | |||
| Source: Mordor Intelligence | ||||||
Supportive Government Purchase-Tax Incentives & Reduced Parking Tariffs
Italy’s Ecobonus program, renewed in 2024, offers up to EUR 5,000 per EV, sparking a 42% surge in rebate applications during H1 2024.[1]Italian Ministry of Environment and Energy Security, “Ecobonus 2024,” mase.gov.it Free or discounted parking for EVs in Milan, Turin, and Bologna further lowers the total cost of ownership, nudging fence-sitters toward the installation of home chargers. Demand spikes concentrate in northern regions, yet the capped subsidy pool creates stop-start purchase cycles that complicate inventory planning for OEMs and charge-point operators.
Integration of Renewables Driving Demand for Smart Charging & Energy-Management Systems
Renewables supplied 43% of Italy’s electricity mix in 2024, pressuring DSOs to manage evening peaks.[2]Gestore dei Servizi Energetici, “Rapporto Energie Rinnovabili 2024,” gse.it Enel X’s JuiceNet platform adjusts charging speed across 12,000 residential points, cutting session costs by 18%. The Clean Energy Package mandates demand-response aggregation by 2025, favoring vendors that bundle hardware with load-shifting software and stationary storage.
Logistics-Fleet Electrification Creating Bulk Orders
Bologna opened Italy’s first fully electric bus depot in March 2024 with 51 Kempower satellites powering 127 e-buses. Rome’s ATAC awarded Iveco a 411-bus contract that requires depot charging across multiple bays. Poste Italiane and GLS Italy now issue multi-year charging-as-a-service tenders, providing predictable utilization that enhances project bankability.
AFIR Mandating Charger Density per kW Sold
Effective April 2024, AFIR compels roughly 110,000 public charge points by 2030 and stipulates 150 kW fast chargers every 60 km on TEN-T corridors. Free To X, a JV of NHOA and Autostrade, pledged 100 highway stations by 2026 with 300-400 kW dispensers. While the rule removes first-mover risk, penalties for non-compliance are still undefined, leaving enforcement uncertain.
Restraints Impact Analysis
| Restraint | (~) % Impact on CAGR Forecast | Geographic Relevance | Impact Timeline | |||
|---|---|---|---|---|---|---|
Lengthy municipal permitting & grid-connection bureaucracy Lengthy municipal permitting & grid-connection bureaucracy | -1.9% | National, acute in southern regions | Short term (≤ 2 years) | (~) % Impact on CAGR Forecast:-1.9% | Geographic Relevance:National, acute in southern regions | Impact Timeline:Short term (≤ 2 years) |
High upfront cost of medium-voltage upgrades for >150 kW sites High upfront cost of medium-voltage upgrades for >150 kW sites | -1.4% | National, rural areas & older urban grids | Medium term (2-4 years) | |||
Rising home-charging availability lowering utilization of public chargers Rising home-charging availability lowering utilization of public chargers | -0.8% | National, northern urban centers | Medium term (2-4 years) | |||
| Source: Mordor Intelligence | ||||||
Lengthy Municipal Permitting & Grid-Connection Bureaucracy
Public fast-charging sites above 150 kW encounter 12- to 18-month approval cycles that dwarf the 3- to 6-month benchmark in Germany.[3]Enel X Way, “Permitting Survey 2024,” enelxway.com Smaller communities lack specialized staff, pushing soft costs to EUR 10,000–20,000 per site and eroding investor confidence. A 2024 “silent-consent” rule sought to cap permit timelines, yet municipalities often issue preliminary objections to restart the clock.
High Upfront Cost of Medium-Voltage Upgrades for >150 kW Sites
Medium-voltage connections require transformers and switchgear costing EUR 100,000–250,000 per site, and rural feeder extensions can lift total costs above EUR 500,000. PNRR subsidies exclude grid fees, giving integrated utilities such as Enel X Way and A2A E-Mobility a structural advantage over independent newcomers. An EIB EUR 200 million facility launched in 2024 remains underutilized due to stringent credit criteria.[4]European Investment Bank, “EIB Support for EV Infrastructure,” eib.org
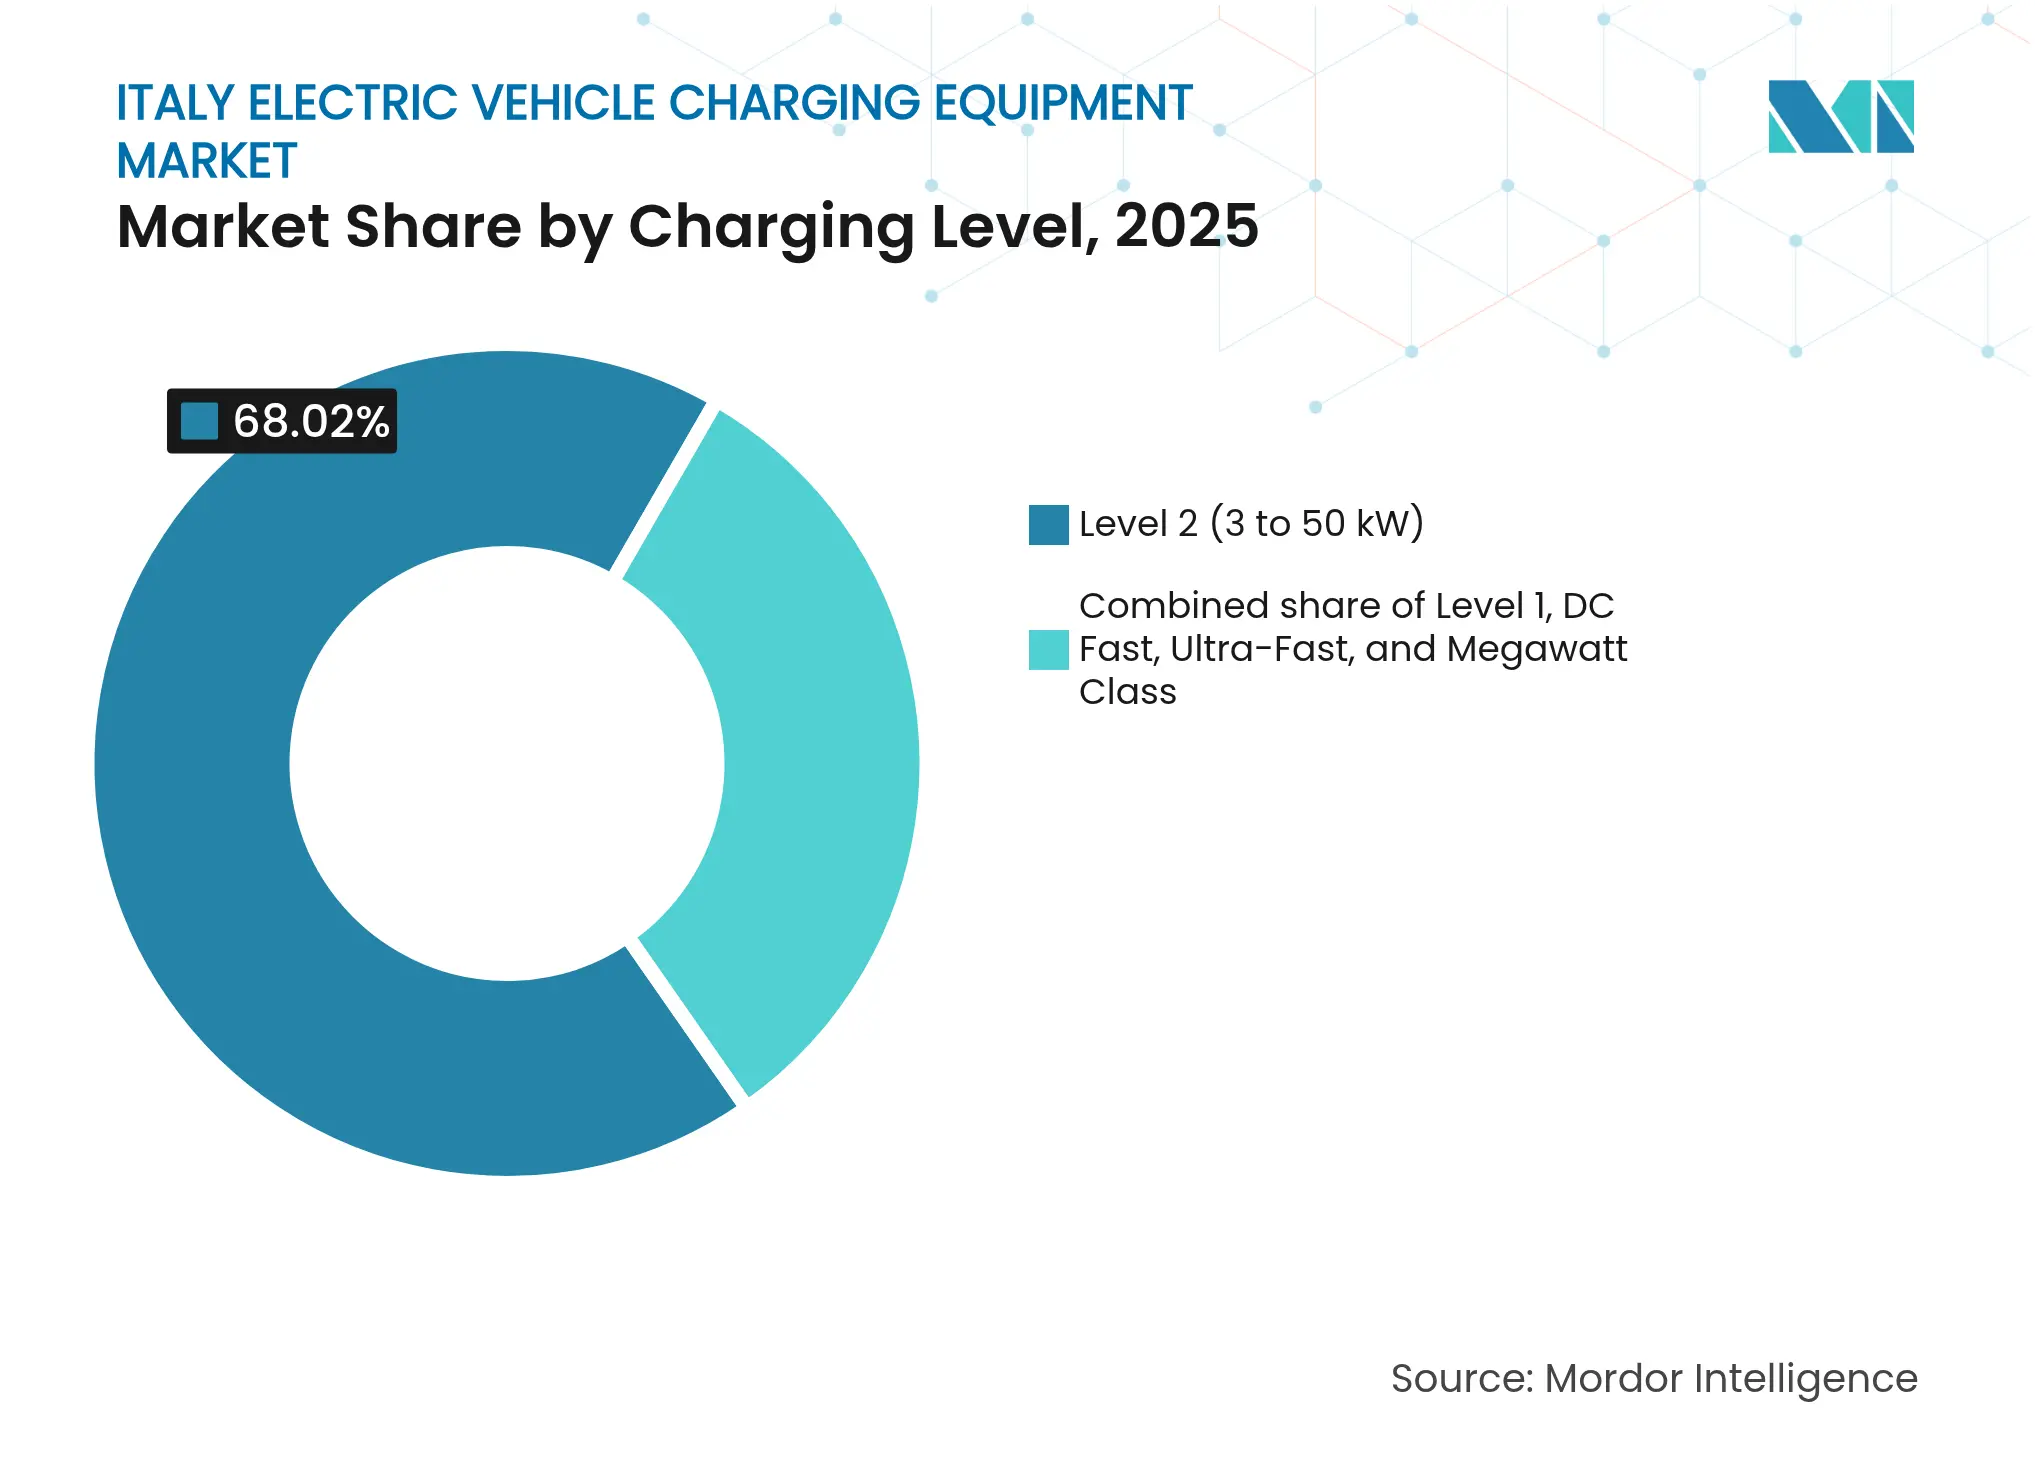
By Charging Level: Depot Power Density Drives Megawatt Adoption
Italy electric vehicle charging equipment market size for Level 2 chargers dominated with 68.02% share in 2025, anchored by home and workplace dwell times that suit 3–50 kW output. Ultra-fast 150–350 kW units now flank major highways, while the Megawatt Charging System (MCS) unlocks 400 kW-plus dispensers for heavy-duty depots. Italy electric vehicle charging equipment market share for megawatt class hardware is marginal today, yet a 30.6% CAGR to 2031 is expected as fleet operators prioritize turn-time and route flexibility. Hardware margins are tightening; vendors differentiate through liquid-cooled cables, active thermal management, and OCPP 2.1-ready software layers that enable predictive maintenance.
Regulatory clarity around IEC 61851 interoperability and CharIN’s MCS standard drives procurement confidence. Alpitronic’s HYC400 pilot at northern logistics hubs illustrates first-mover advantages in reliability benchmarks and integrated load management. Utility-backed Atlante ties megawatt installs to battery energy-storage systems, buffering grid impact and arbitraging wholesale power spreads.
Note: Segment shares of all individual segments available upon report purchase
By Installation Site: Transportation Hubs Capture Long-Haul Demand
Residential garages comprised 72.88% of deployed units in 2025, reflecting Italy’s 72% owner-occupied housing rate and off-street parking prevalence. The segment’s growth moderates beyond 2027 as suitable dwellings saturate. Transportation hubs, airports, seaports, and highway service areas deliver a 28.4% CAGR through 2031, buoyed by IONITY, Atlante, and Free To X rollouts that cluster 150–400 kW dispensers every 60 km on the A1, A4, and A14. These sites extract higher revenues per kWh because drivers value time certainty, and cafés plus retail add incremental margin.
Public curbside units lag at 12% utilization versus the 25% break-even threshold, as residents with home charging avoid paid on-street options. Condominium retrofits remain slow; a 75% owner vote is required for common-area electrical work, and many 1970s-era blocks lack spare transformer capacity.
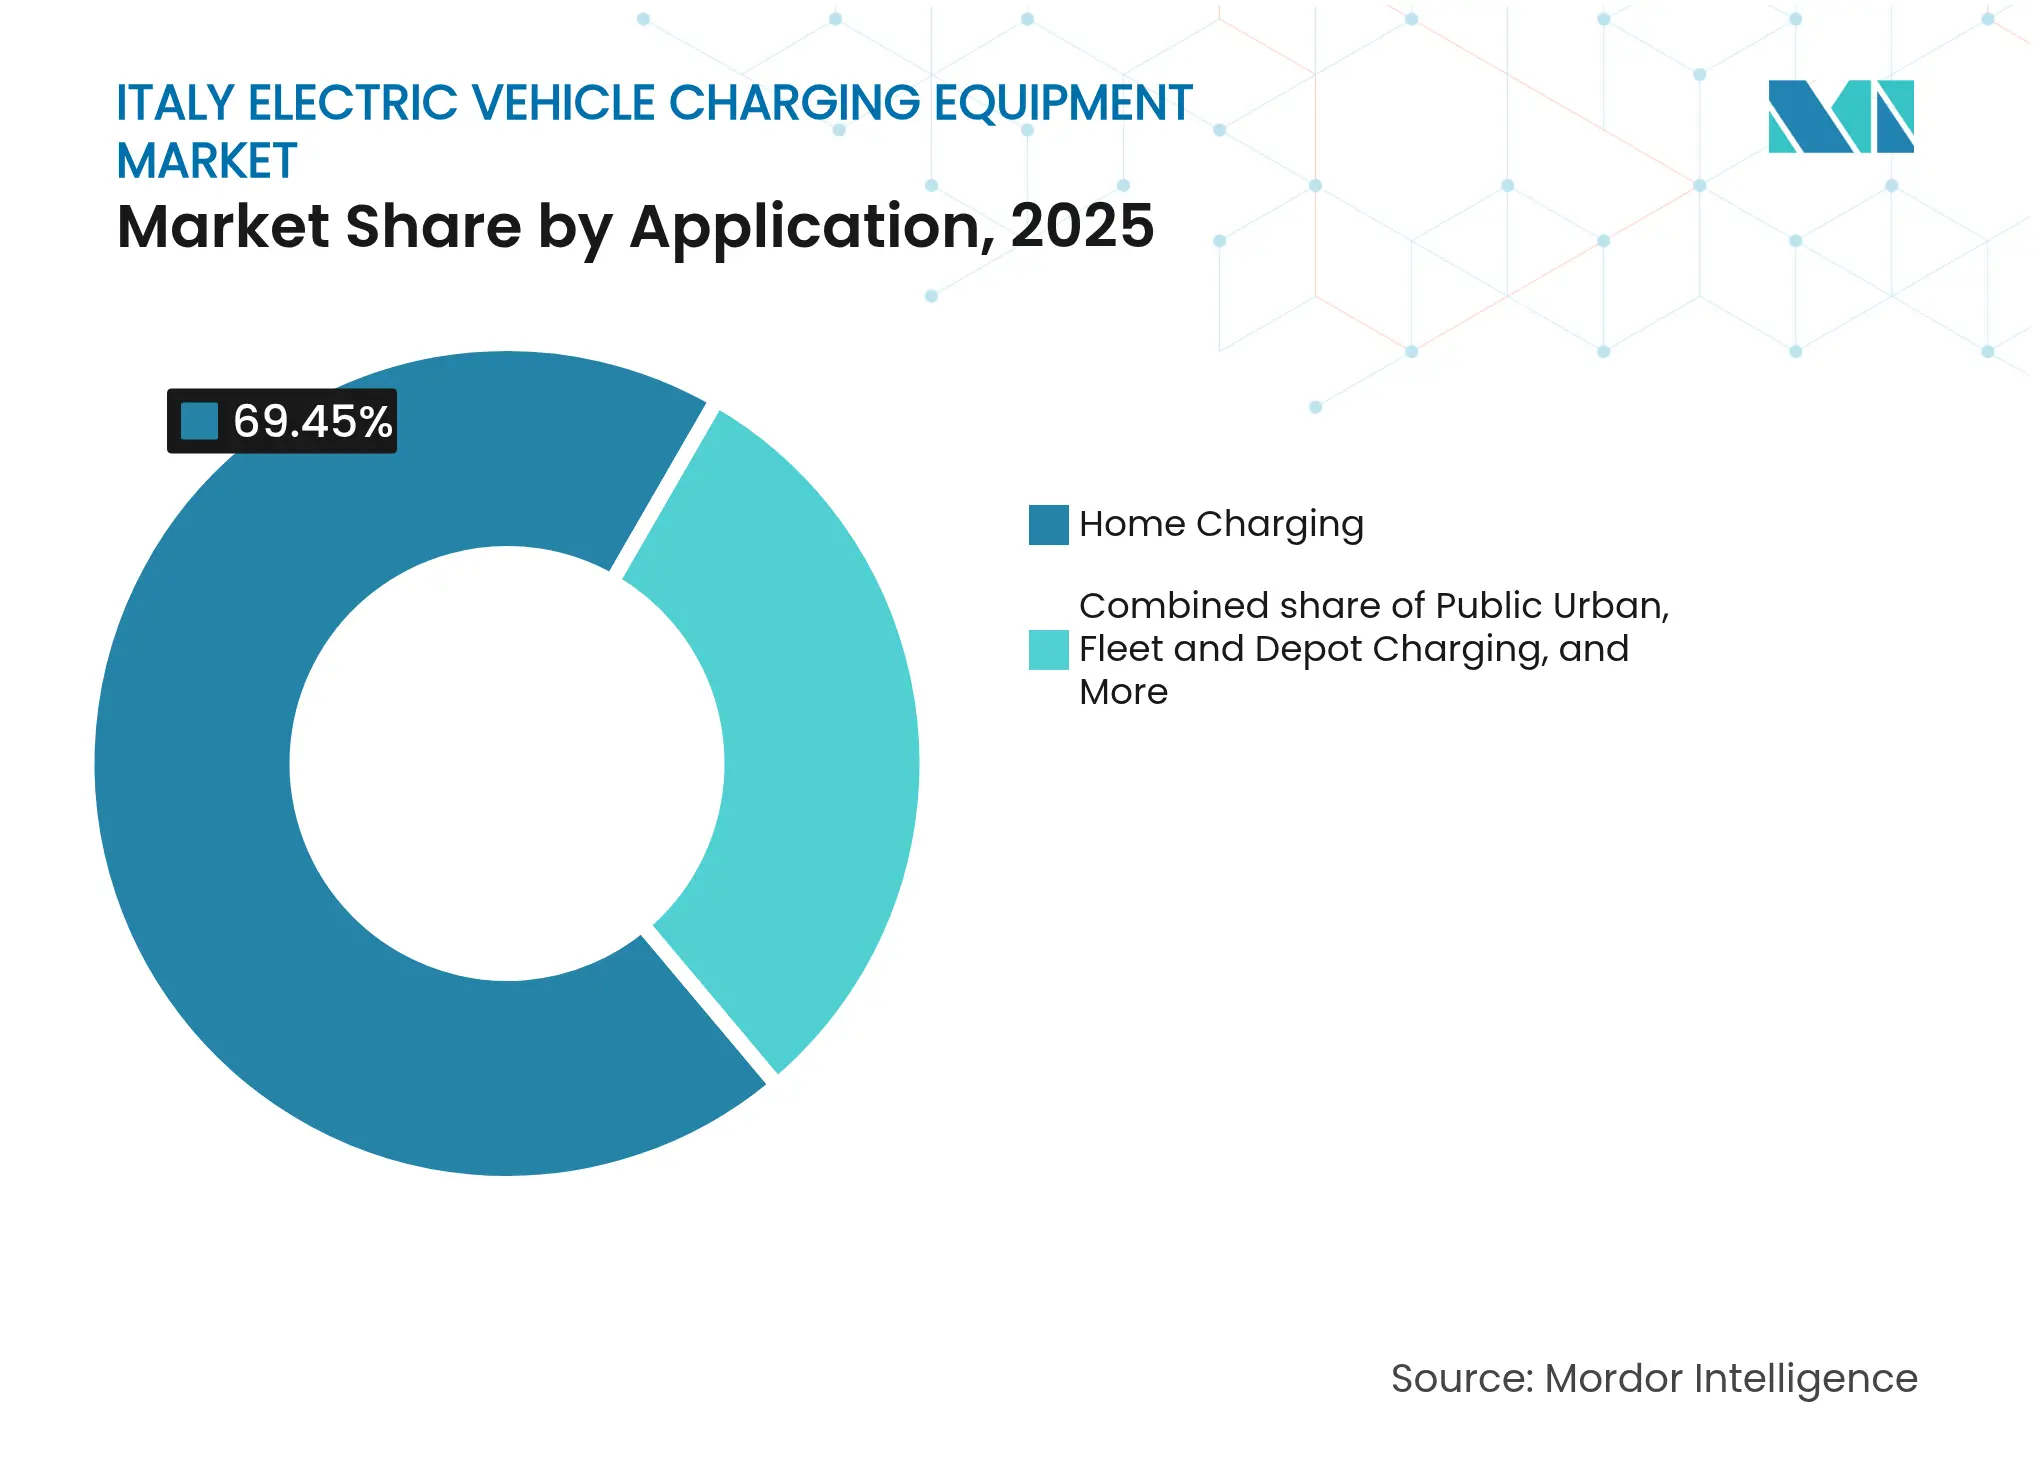
By Application: Fleet & Depot Charging Scales Rapidly
Home charging represented 69.45% of applications in 2025, thanks to overnight convenience and low off-peak tariffs. Fleet and depot charging grows at 31.7% CAGR through 2031 as last-mile vans, buses, and coaches electrify. Italy's electric vehicle charging equipment market size for depot solutions benefits from predictable duty cycles that justify smart-charging software subscriptions and on-site storage. Logistic giants tender charging-as-a-service contracts that shift capital risk to operators. Workplace installations fill the gap for apartment dwellers lacking dedicated spots, while public urban charging remains a policy-driven necessity rather than a robust profit pool.
Highway corridor charging edges toward profitability as utilization climbs with EV penetration. Operators integrate predictive queuing and battery preconditioning to cut session times, enhancing throughput.
Note: Segment shares of all individual segments available upon report purchase
Northern regions host 78.40% of public charge points, with Lombardy alone topping 14,500 installed units at end-2023. Dense grids, higher GDP per capita, and streamlined permits anchor a virtuous cycle of investment. Central Italy benefits from Rome’s political gravity and Tuscany’s tourism, attracting Atlante and Shell Recharge hubs along Rome–Florence–Venice tourist corridors. Southern regions struggle with a two-speed rollout: sparse infrastructure deters EV adoption, and low adoption makes infrastructure unbankable. PNRR stipulates that 40% of charging funds go south, yet slow permitting and grid deficiencies delay spending.
Sicily and Sardinia confront island-specific challenges, limited interconnectors raise electricity costs, while fast-charging economics hinge on subsidies. Terna earmarks EUR 4 billion for southern grid reinforcement by 2028, but until then, many 150 kW sites remain on waitlists. Utilization contrasts are stark: Milan urban chargers run at 20%-plus, while rural Calabrian units hover below 5%. Cross-border corridors at the Brenner Pass and the Mont Blanc integrate into pan-European networks, supporting long-haul freight and holiday traffic. Compared with Germany and France, Italy ranks 17th in chargers per capita; closing the gap requires trimming permit lead times and harmonizing municipal bylaws.
Market Concentration
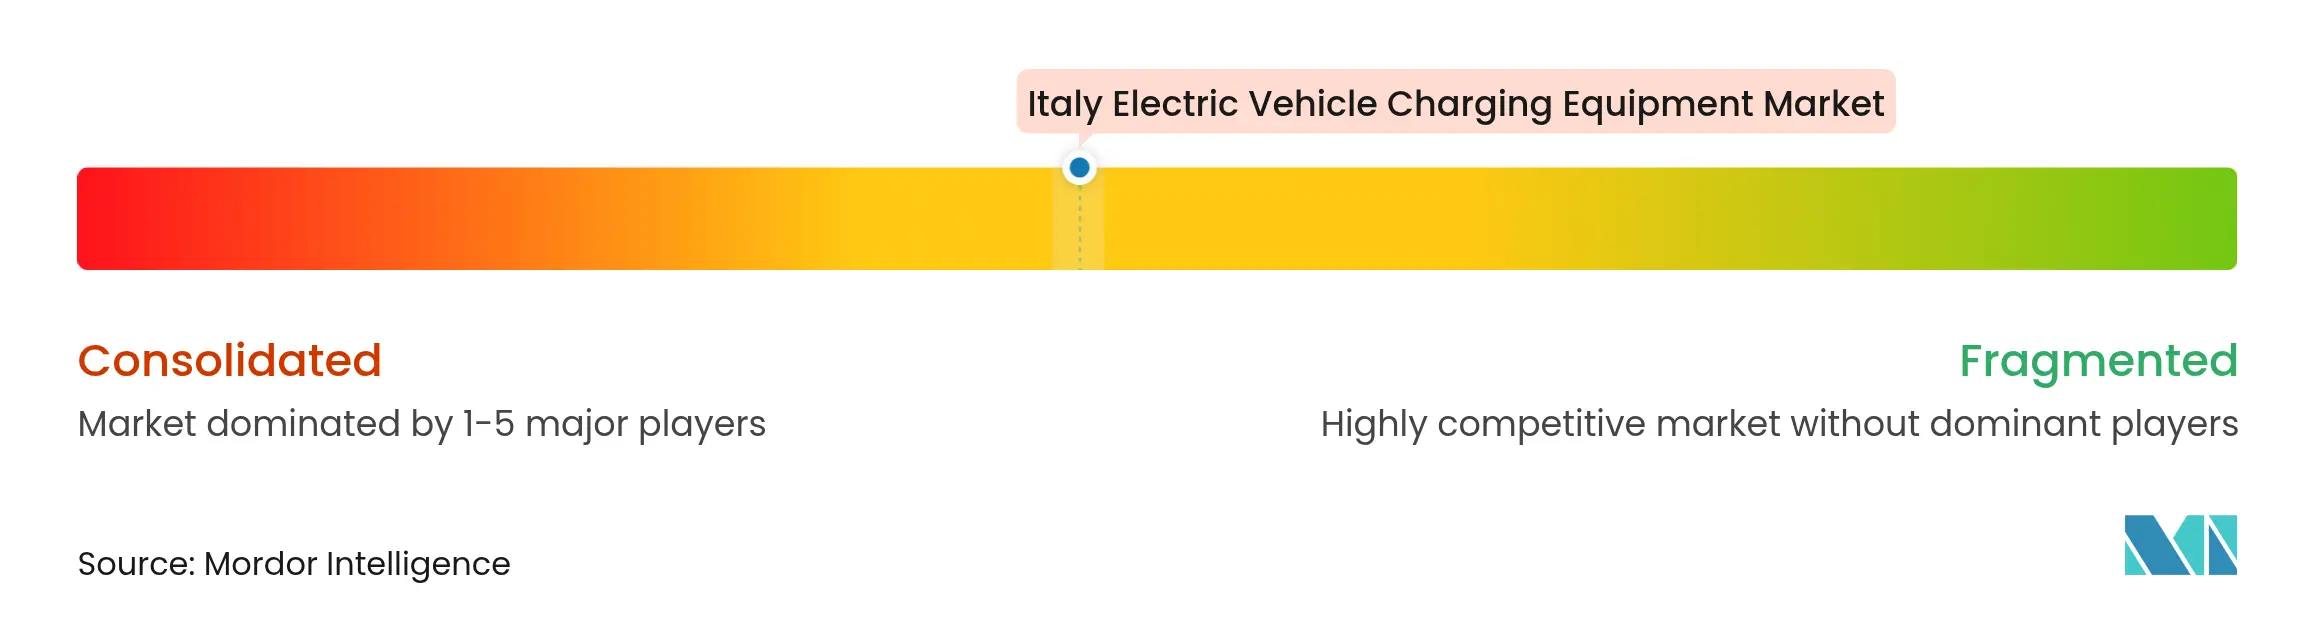
The Italian electric vehicle charging equipment market remains moderately fragmented. Enel X Way held 31% of public sockets at end-2023, Be Charge 18%, and A2A E-Mobility 12%. Vertical integration grants utilities privileged grid data, priority connections, and cross-selling of electricity retail contracts. Be Charge leverages Eni service-station real estate and loyalty programs to funnel legacy fuel customers into EV adoption. A2A co-locates chargers with district-heating and waste-to-energy assets, optimizing land use.
White-space lies in southern provinces, condominium retrofits, and integrated mobility hubs. Atlante targets highway corridors with 400 kW hypercharger arrays and battery storage, offsetting grid constraints. Norwegian entrants Zaptec and Easee sell cloud-managed residential units online, undercutting incumbents by 25% on hardware price. Differentiation shifts from metal to software: dynamic load balancing, predictive maintenance, and OCPP 2.1 roaming. ABB’s Terra 360 serves four vehicles simultaneously from one cabinet, improving throughput per footprint.
Supplier margins compress as hardware commoditizes; operators pivot to services, subscription-based energy management, vehicle-to-grid orchestration, and fleet scheduling APIs. No single player exercises pricing power, placing the bargaining chip with high-utilization fleet customers rather than dispersed retail drivers.

*Disclaimer: Major Players sorted in no particular order
1. Introduction
2. Research Methodology
3. Executive Summary
4. Market Landscape
5. Market Size & Growth Forecasts
6. Competitive Landscape
7. Market Opportunities & Future Outlook
Electric vehicle (EV) charging equipment refers to the hardware and associated systems used to charge electric vehicle batteries. This equipment encompasses a variety of components, including charging stations, connectors, cables, and the power electronics required to convert and deliver electrical energy from the grid to the vehicle's battery. The deployment of this infrastructure is crucial for supporting the growing adoption of electric vehicles and facilitating the transition to a more sustainable transportation system.
The Italy electric vehicle charging equipment market is segmented by charging level, installation site, and application. By charging level, the market is segmented into level 1, level 2, DC fast, ultra-fast, and megawatt-class. By installation site, the market is segmented into residential, commercial and retail, public municipal, and transportation hubs. By application, the market is segmented into home, workplace, public urban, highway corridor, and fleet and depot. For each segment, the market size and forecasts are provided in terms of revenue (USD).
Unlocking Market Potential for Solid-State Transformers
3 Min Read
Strategic Expansion of Floor Coatings in the MEIA Region
4 Min Read
When decisions matter, industry leaders turn to our analysts. Let’s talk.