Israel Data Center Market Size and Share
Market Overview
| Study Period | 2020 - 2031 |
|---|---|
| Forecast Data Period | 2026 - 2031 |
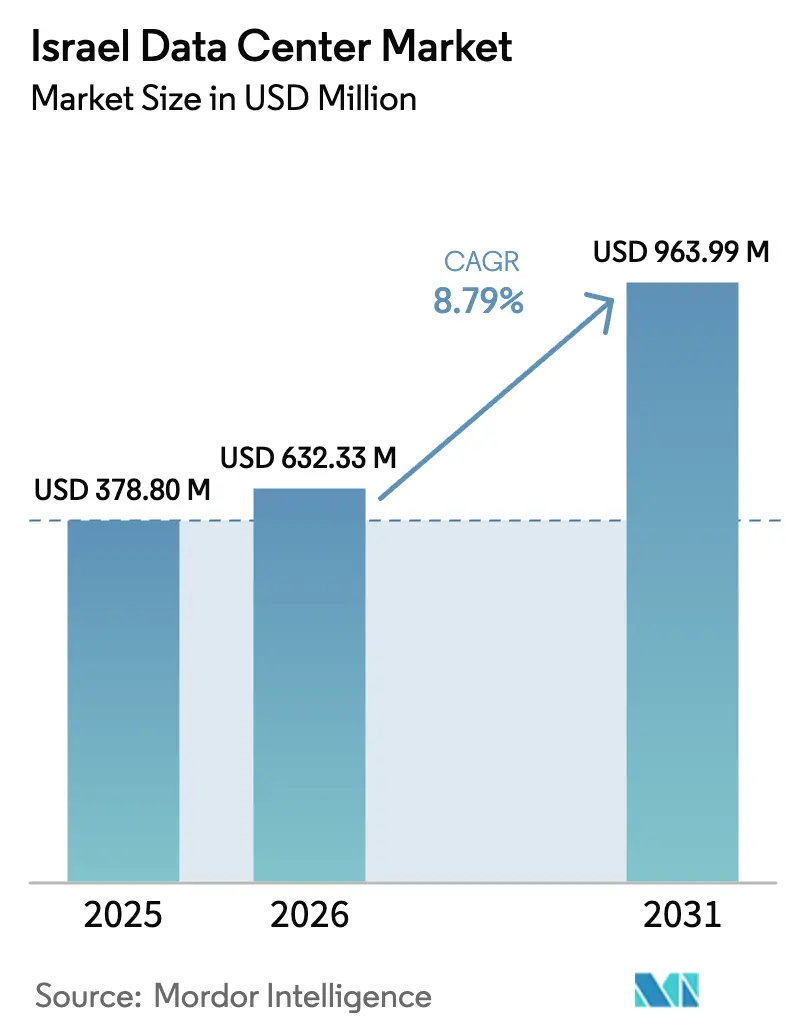
| Base Year Market Size (2025) | USD 378.80 Million |
| Market Size (2026) | USD 632.33 Million |
| Market Size (2031) | USD 963.99 Million |
| Growth Rate (2026 - 2031) | 8.79% CAGR |
| Market Concentration | Medium |
Major Players *Disclaimer: Major Players sorted in no particular order Image © Mordor Intelligence. Reuse requires attribution under CC BY 4.0. | |
Israel Data Center Market Analysis by Mordor Intelligence
The Israel Data Center Market size was valued at USD 0.58 billion in 2025 and estimated to grow from USD 0.63 billion in 2026 to reach USD 0.96 billion by 2031, at a CAGR of 8.79% during the forecast period (2026-2031). In terms of installed base, the market is expected to grow from 378.80 megawatt in 2025 to 532.90 megawatt by 2030, at a CAGR of 7.06% during the forecast period (2025-2030). The market segments' shares and estimates are calculated and reported in terms of MW. Buoyant demand comes from hyperscale roll-outs, sovereign cloud mandates, and a steady flow of submarine cable landings that reinforce Israel’s bridge position between Europe and Asia. Mega-scale facilities capture the majority of new capacity because their hardened designs meet security requirements while minimizing the cost per megawatt. Colocation remains the preferred business model, thanks to its carrier-neutral interconnection density, while government cloud projects, such as Project Nimbus, continue to draw hyperscale providers into sovereign partnerships. Still, grid congestion and land scarcity in Tel Aviv temper near-term build-outs and keep wholesale pricing firm. Established local operators, therefore, focus on secondary cities where land is cheaper, renewable energy is abundant, and security considerations encourage geographic diversity.
Key Report Takeaways
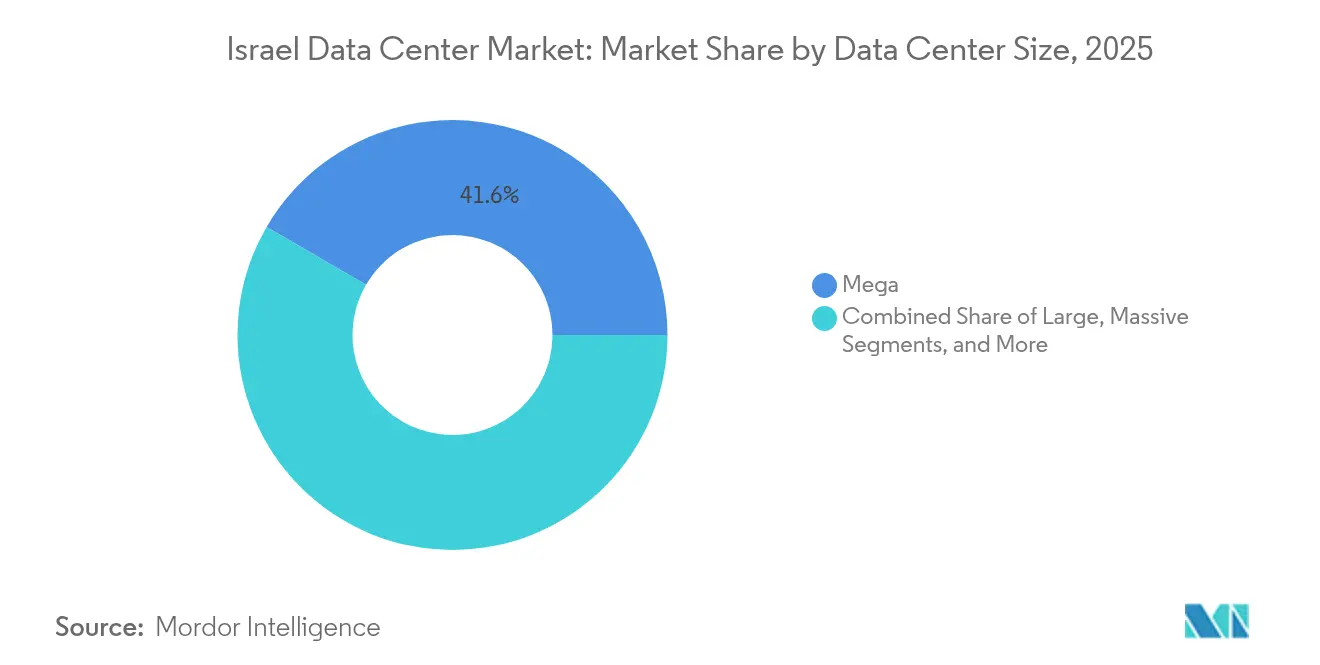
- By data center size, mega-scale sites held 41.62% revenue share in 2025, while medium facilities are forecast to expand at a 7.62% CAGR through 2031.
- By tier, Tier 3 infrastructure accounted for 68.20% of the Israel data center market share in 2025, and Tier 4 is advancing at a 7.18% CAGR through 2031.
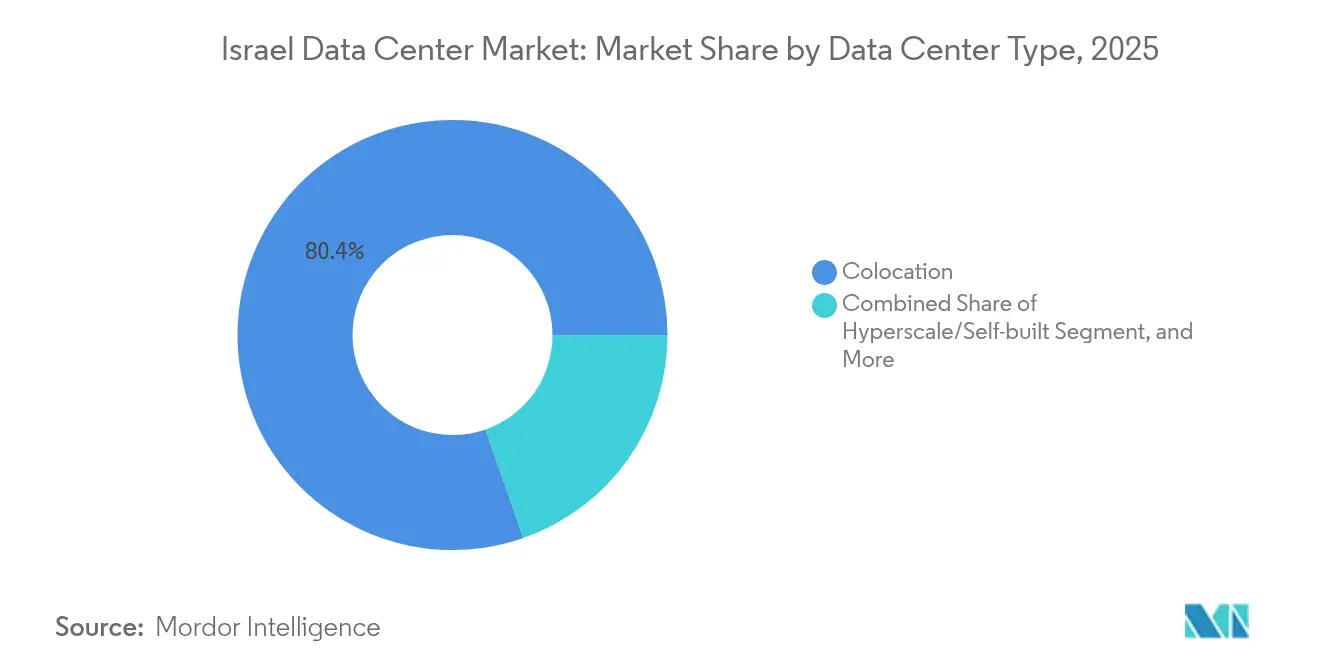
- By type, colocation claimed an 80.35% share of the Israel data center market size in 2025; self-built hyperscale deployments are projected to rise at a 7.63% CAGR between 2026-2031.
- By end user, IT and telecom captured 59.10% of demand in 2025, while BFSI shows the quickest uptick at 7.22% CAGR to 2031.
- By geography, Tel Aviv led with 46.90% of installed capacity in 2025; the Rest of Israel segment is set to accelerate at an 8.92% CAGR through 2031.
Note: Market size and forecast figures in this report are generated using Mordor Intelligence’s proprietary estimation framework, updated with the latest available data and insights as of 2026.
Israel Data Center Market Trends and Insights
Drivers Impact Analysis*
| Driver | (~) % Impact on CAGR Forecast | Geographic Relevance | Impact Timeline |
|---|---|---|---|
| Hyperscale cloud region roll-outs accelerate wholesale demand | +1.8% | National, with concentration in Tel Aviv and Rosh HaAyin | Medium term (2-4 years) |
| E-government digitalization mandates local data hosting | +1.5% | National, with government facilities concentrated in Jerusalem and Tel Aviv | Long term (≥ 4 years) |
| 5G-enabled IoT proliferation pushes edge build-outs | +1.2% | National, with early deployment in major urban centers | Medium term (2-4 years) |
| Defense-grade security needs outside Tel Aviv core | +1.0% | Regional, with focus on distributed locations for resilience | Long term (≥ 4 years) |
| New submarine cable landings cut latency and costs | +0.8% | Coastal regions, particularly Mediterranean landing points | Short term (≤ 2 years) |
| Renewable energy incentives in Negev industrial zones | +0.6% | Southern Israel, specifically Negev desert region | Long term (≥ 4 years) |
| Source: Mordor Intelligence | |||


Hyperscale Cloud Region Roll-outs Accelerate Wholesale Demand
Microsoft’s planned region and Oracle’s nine-floor underground build shifted the economics of the Israel data center market toward multi-megawatt single-tenant deals, which absorb large tranches of capacity in one stroke. The wholesale model compresses provisioning timelines, drives price premiums for contiguous white space, and pressures smaller operators that cannot fund multiyear build-to-suit contracts. Project Nimbus further underpins sovereign cloud demand, locking in a committed public-sector workload pipeline that hyperscalers are uniquely positioned to serve. These deployments strengthen the Israel data center market by anchoring long-term power purchase agreements that stabilize operating costs. Consequently, capacity announcements are increasingly clustering around secondary plots in Rosh HaAyin and Kfar Yona, where hyperscalers can assemble 20-40 MW blocks without incurring Tel Aviv’s land premiums.
E-Government Digitalization Mandates Local Data Hosting
Israel’s ranking in the UN E-Government Survey highlights a policy shift that requires ministries to migrate legacy applications to certified local facilities, thereby reinforcing data sovereignty requirements.[1]UNDESA, “UN E-Government Survey 2024,” un.org The Bank of Israel’s Digital Shekel sandbox amplifies the need for low-latency processing, while the Privacy Protection Amendment 13 directs regulated entities toward ISO 27001-accredited providers. Together, these edicts convert sporadic procurement into predictable multiyear contracts, encouraging operators to finance Tier 3 and Tier 4 expansions. Because many public systems handle sensitive defense data, vendors with existing security clearances and underground designs command a competitive moat. Sustained budget allocations cushion the Israeli data center market from cyclical swings in the private sector.
5G-Enabled IoT Proliferation Pushes Edge Build-outs
Government grants worth NIS 24 million (USD 6.6 million) for 5G application pilots and Cellcom’s NIS 592 million outlay signal a nationwide shift toward ultralow-latency connectivity. Autonomous mobility, smart-city telemetry, and industrial automation require micro-data centers within 10-20 milliseconds of end users, resulting in splintered demand across dozens of 1-5 MW sites. Secondary cities thus move into the Israel data center market spotlight as carriers pursue tower-adjacent real estate with dark fiber access. Edge deployments favor modular form factors and liquid cooling to handle dense GPU clusters, creating a niche for new entrants that may lack the capital for mega sites but can quickly replicate templates. As fiber coverage nears 92% nationally, edge nodes integrate seamlessly into existing backhaul, reducing incremental capex per location.
Defense-Grade Security Needs Outside Tel Aviv Core
The October 2024 conflict validated the effectiveness of hardened underground campuses, as operators reported zero downtime despite missile alerts. Defense agencies now stipulate multi-layered physical barriers, air-gap zones, and C-BRN filtration, features that are more economical to execute in greenfield regional plots than in crowded areas like Tel Aviv. MedOne’s USD 270 million Kfar Yona investment exemplifies this pivot, combining nine-meter-thick concrete walls with redundant power islands. The security premium enhances the return on invested capital by allowing for the rental of hardened space at higher rates and securing longer leases. Consequently, the Israel data center market is seeing a rapid re-rating of peripheral land that satisfies depth-of-burial and standoff distance requirements. The trend amplifies capital needs but simultaneously raises competitive barriers for speculative newcomers.
Restraints Impact Analysis*
| Restraint | (~) % Impact on CAGR Forecast | Geographic Relevance | Impact Timeline |
|---|---|---|---|
| Land scarcity and soaring real-estate prices in hotspots | -1.20% | Tel Aviv metropolitan area and prime connectivity locations | Short term (≤ 2 years) |
| High electricity tariffs and grid congestion | -0.80% | National, with particular impact on energy-intensive facilities | Medium term (2-4 years) |
| Water scarcity limiting liquid-cooling adoption | -0.60% | National, with severe constraints in Negev and southern regions | Long term (≥ 4 years) |
| Geopolitical security risks driving hardened-facility CAPEX | -0.50% | National, with heightened impact near border regions | Medium term (2-4 years) |
| Source: Mordor Intelligence | |||
Land Scarcity and Soaring Real-Estate Prices in Hotspots
Vacant parcels that meet set-back, power, and fiber criteria within Tel Aviv now trade at levels that break traditional data center return models. The Israel Land Authority’s tender for redeveloping the Timna copper mine, 230 km south of Tel Aviv, highlights how far operators are willing to travel to secure acreage. Build-cost inflation squeezes pro forma yields, prompting several hyperscalers to bank land early or pause incremental builds, such as AWS’s 2025 freeze. The shortage favors incumbents that already control multi-acre campuses, limiting competitive churn but handcuffing overall expansion speed in the Israel data center market.
High Electricity Tariffs and Grid Congestion
Industrial power prices above EUR 0.28 per kWh and looming generation shortfalls after 2027 risk eroding Israel’s edge versus cheaper European peers. Lengthy permit cycles for new 161 kV substations delay hyperscale go-lives, forcing operators to bankroll diesel or battery peaking assets. Renewable offsets help-Enlight already operates 248 MW of solar with 625 MWh storage-but intermittency hurdles persist. Elevated operating costs pressure rack rates and may cap the deployment of power-hungry AI clusters unless off-grid solar-plus-storage economics improve swiftly.
*Our forecasts treat driver/restraint impacts as directional, not additive. The impact forecasts reflect baseline growth, mix effects, and variable interactions.
Segment Analysis
By Data Center Size: Mega Facilities Drive Market Consolidation
Mega sites captured 41.62% Israel data center market share in 2025, reflecting wholesale contracts that lock in multi-megawatt blocks for cloud and government buyers. These campuses deliver lower per-MW build cost because chilled-water loops, diesel farms, and security buffers scale more efficiently than in small halls. Medium facilities are projected to grow at a 7.62% CAGR through 2031 as 5G edge roll-outs demand 1-5 MW nodes in secondary cities. Underground construction methods, pioneered by Oracle’s nine-floor bunker, add upfront capex yet command premium rents for defense-grade resilience.
Medium facilities serve as agile entry points because modular designs reduce build cycles to under 12 months, allowing sponsors to capture sudden demand spikes without financing 40 MW campuses. Smaller hubs below 2 MW retain niche roles for payment gateways and regulatory workloads that cannot be relocated from metro Tel Aviv.


By Tier Type: Tier 3 Infrastructure Balances Cost and Resilience
Tier 3 designs held 68.20% of the Israel data center market share in 2025 by delivering N+1 redundancy that satisfies most service-level agreements without the expense of Tier 4’s twin-cord approach. The blueprint’s prevalence owes much to Israeli enterprises that prize quick deployment and manageable opex over the absolute uptime guaranteed by Tier 4. Yet the security environment is swinging sentiment toward continuous-operation designs: Tier 4 is poised for a 7.18% CAGR as defense, fintech, and AI labs demand 99.995% availability. Tier 1 and Tier 2 footprints shrink steadily because public cloud migration makes their basic fault tolerance less acceptable for mission-critical loads.
Tier 4 adoption accelerates outside Tel Aviv, where underground plots enable economically viable deep-burial builds. Operators leverage the “power island” strategy-dual substations plus redundant on-site generation-to qualify for Tier 4 while accessing lower-priced land. Tier 3 continues to dominate everyday enterprise migrations, particularly among SaaS vendors and telecom switches, striking a balance between cost discipline and resilience. Over time, the Israel data center market's contribution from Tier 4 is expected to expand as sovereign and AI workloads demand ultra-high uptime; however, Tier 3 remains the sweet spot for generalized hosting budgets.
By Data Center Type: Colocation Dominance Reflects Connectivity Premium
Colocation captured 80.35% of the Israel data center market size in 2025 because carrier-neutral meet-me rooms aggregate domestic and international traffic, creating irreplaceable network effects. Retail colo sells flexible half-racks to SMBs and managed-service providers, whereas wholesale colo signs 5-15 MW blocks with cloud and telecom operators. Hyperscale self-builds rise at 7.63% CAGR as Microsoft and Google craft sovereign regions adjacent to Nimbus workloads, but they still interconnect through existing carrier hotels to tap Israel’s east-west fiber bundles.
The colocation model benefits Tel Aviv carrier hotels, such as MedOne’s MedNautilus campus, which host submarine cable landing gear and Layer 2 exchange points. These sites secure double-digit EBITDA margins because cross-connect fees and peering services add high-gross-margin revenue streams. Edge and enterprise private clouds extend colocation’s footprint into suburban sites, reinforcing its hold on the total Israeli data center market share despite headline-grabbing hyperscale projects. Looking ahead, AI clusters that demand specialized power densities may shift some volume to single-tenant halls; yet, even those clusters require low-latency peering, ensuring that colocation remains foundational.
By End User: IT and Telecom Sectors Anchor Market Demand
IT and telecom users generated 59.10% of revenue in 2025, reflecting Israel’s standing as a startup nation with heavy content-delivery and routing requirements. Carriers require multicast hubs, voice switching, and 5G core nodes within neutral facilities, while SaaS companies co-locate near peering points to minimize latency. BFSI workloads are poised to expand at the fastest rate, recording a 7.22% CAGR, driven by digital banking regulations and Central Bank pilot sandboxes that require in-country processing.
E-commerce, media streaming, and gaming applications continue to add GPU capacity, although their aggregate share remains smaller. Government ministries, bolstered by Project Nimbus, contract long-term leases, injecting term certainty that is valuable for financing new builds. Manufacturing and healthcare probe proof-of-concept edge deployments for Industry 4.0 and telemedicine, expanding the addressable Israel data center market size beyond legacy IT. Because telecom and cloud players sign multi-megawatt deals, their bargaining power puts downward pressure on effective rates; yet, their stable traffic anchors utilization, safeguarding operator cash flows.
Geography Analysis
Tel Aviv retained 47.45% of % Israel data center market share in 2024, leveraging dense fiber rings and the lion’s share of submarine cable landing sites. Its concentration of financial headquarters and venture-capital-backed SaaS firms translates to sticky, low-latency demand that sustains premium pricing. However, land scarcity and zoning hurdles restrict the supply of new land, causing new entrants to scout for opportunities in peripheral towns within a 30 km radius. Grid constraints exacerbate the squeeze; operators queue for up to three years to secure 10 MW allocations, compelling some to deploy interim battery farms that lift capex.
Rosh HaAyin has emerged as a spillover destination, combining Tel Aviv’s proximity with lower real estate prices. Planned regional substations promise cleaner power availability, and municipal incentives slash permitting times to under 12 months. MedOne’s USD 270 million Kfar Yona campus illustrates this shift, blending underground construction with six-hour autonomous fuel reserves. Rosh HaAyin’s progress demonstrates that geographic diversification can preserve network performance even as operators move outward from the traditional core, thereby enlarging the Israel data center market size in secondary rings.
The Rest of Israel segment, spanning Negev Desert solar parks to northern defense corridors, logs an 8.10% CAGR through 2030, driven by renewable power access, cheaper acreage, and strategic dispersion initiatives. The government’s Timna mine tender epitomizes creative land re-use, offering 520 acres of below-grade expanse paired with high-irradiance PV arrays that could shave NIS 87 million per year from electricity bills. Renewable-rich plots offset cooling penalties in hot climates, while natural topography aids bunker-style builds. As submarine cable projects add new Mediterranean landings, latency penalties for southern sites decrease, reinforcing the viability of dispersed build programs and driving overall Israel data center market growth beyond Tel Aviv's boundaries.
Competitive Landscape
The Israel data center market shows moderate concentration as a handful of incumbents balance local knowledge with global funding advantages. MedOne operates four carrier-neutral sites totaling 25,000 sqm and has seven more in the pipeline, emphasizing bunker-style resilience that resonates with defense clients. Bezeq International leverages its Jonah cable ownership and ISP heritage to cross-sell transit and hosting, and in July 2025, inked an MoU to acquire Exelera Telecom for USD 160 million, expanding its undersea reach. These moves reveal a defensive strategy: own both physical cables and colo space to lock users into integrated connectivity stacks.
Hyperscalers adopt varied approaches. Microsoft presses ahead with a dedicated region to satisfy Nimbus workloads and EU adequacy data-transfer rules.[3]Microsoft Reporter, “Microsoft to launch new cloud datacenter region in Israel,” Microsoft, microsoft.com Oracle opts for deep-burial, nine-floor caverns to court high-security tenants, while AWS paused further builds after domestic demand lagged forecasts, signaling that not all global cloud templates port neatly to Israel’s small population. Yet GPU-hungry firms such as Nvidia and Nebius commit multibillion-shekel campuses, drawn by the country’s AI talent and defense procurement channels. This bifurcation suggests room for niche specialists even as global giants dominate top-line capacity additions.
A competitive edge increasingly hinges on provenance of power, innovative cooling solutions, and a robust compliance posture, rather than raw floor space. Operators deploying liquid cooling racks, on-site solar storage microgrids, and ISO 27001-compliant clearances, as certified by the Privacy Protection Authority, win government tenders. Capital depth matters: underground structures demand 40% higher capex, limiting new entrants unless they secure institutional backing. Mergers such as Bezeq-Exelera foreshadow a tighter market, where submarine cable control, renewable PPAs, and defense-grade designs are prerequisites for remaining relevant in the evolving Israeli data center market.
Israel Data Center Industry Leaders
Adgar Investments and Development Ltd
MedOne Digital Ltd
Bynet Data Communications Ltd
Bezeq International Ltd
Digital Realty Trust Inc
- *Disclaimer: Major Players sorted in no particular order


Recent Industry Developments
- July 2025: Bezeq Group signed a preliminary MoU to acquire Exelera Telecom Ltd for USD 160 million, enhancing submarine cable reach and data center operations.
- July 2025: Nvidia announced plans for a multibillion-dollar mega campus near Yokneam, including a USD 500 million server farm in Ramot Menashe.
- May 2025: Nebius Group secured a NIS 500 million (USD 135 million) package to build Israel’s national AI supercomputer, targeting go-live by early 2026.
- April 2025: Partner Communications launched a global business division to deepen international roaming, IoT, and dark-fiber agreements.


Israel Data Center Market Report Scope
Tel Aviv are covered as segments by Hotspot. Large, Massive, Medium, Mega, Small are covered as segments by Data Center Size. Tier 3, Tier 4 are covered as segments by Tier Type. Non-Utilized, Utilized are covered as segments by Absorption.| Large |
| Massive |
| Medium |
| Mega |
| Small |
| Tier 1 and 2 |
| Tier 3 |
| Tier 4 |
| Hyperscale/Self-built | ||
| Enterprise/Edge | ||
| Colocation | Non-Utilized | |
| Utilized | Retail Colocation | |
| Wholesale Colocation | ||
| BFSI |
| IT and ITES |
| E-Commerce |
| Government |
| Manufacturing |
| Media and Entertainment |
| Telecom |
| Other End Users |
| Tel Aviv |
| Rosh HaAyin |
| Rest of Israel |
| By Data Center Size | Large | ||
| Massive | |||
| Medium | |||
| Mega | |||
| Small | |||
| By Tier Type | Tier 1 and 2 | ||
| Tier 3 | |||
| Tier 4 | |||
| By Data Center Type | Hyperscale/Self-built | ||
| Enterprise/Edge | |||
| Colocation | Non-Utilized | ||
| Utilized | Retail Colocation | ||
| Wholesale Colocation | |||
| By End User | BFSI | ||
| IT and ITES | |||
| E-Commerce | |||
| Government | |||
| Manufacturing | |||
| Media and Entertainment | |||
| Telecom | |||
| Other End Users | |||
| By Hotspot | Tel Aviv | ||
| Rosh HaAyin | |||
| Rest of Israel | |||


Market Definition
- IT LOAD CAPACITY - The IT load capacity or installed capacity, refers to the amount of energy consumed by servers and network equipments placed in a rack installed. It is measured in megawatt (MW).
- ABSORPTION RATE - It denotes the extend to which the data center capacity has been leased out. For instance, a 100 MW DC has leased out 75 MW, then absorption rate would be 75%. It is also referred as utilization rate and leased-out capacity.
- RAISED FLOOR SPACE - It is an elevated space build over the floor. This gap between the original floor and the elevated floor is used to accommodate wiring, cooling, and other data center equipment. This arrangement assist in having proper wiring and cooling infrastructure. It is measured in square feet (ft^2).
- DATA CENTER SIZE - Data Center Size is segmented based on the raised floor space allocated to the data center facilities. Mega DC - # of Racks must be more than 9000 or RFS (raised floor space) must be more than 225001 Sq. ft; Massive DC - # of Racks must be in between 9000 and 3001 or RFS must be in between 225000 Sq. ft and 75001 Sq. ft; Large DC - # of Racks must be in between 3000 and 801 or RFS must be in between 75000 Sq. ft and 20001 Sq. ft; Medium DC # of Racks must be in between 800 and 201 or RFS must be in between 20000 Sq. ft and 5001 Sq. ft; Small DC - # of Racks must be less than 200 or RFS must be less than 5000 Sq. ft.
- TIER TYPE - According to Uptime Institute the data centers are classified into four tiers based on the proficiencies of redundant equipment of the data center infrastructure. In this segment the data center are segmented as Tier 1,Tier 2, Tier 3 and Tier 4.
- COLOCATION TYPE - The segment is segregated into 3 categories namely Retail, Wholesale and Hyperscale Colocation service. The categorization is done based on the amount of IT load leased out to potential customers. Retail colocation service has leased capacity less than 250 kW; Wholesale colocation services has leased capacity between 251 kW and 4 MW and Hyperscale colocation services has leased capacity more than 4 MW.
- END CONSUMERS - The Data Center Market operates on a B2B basis. BFSI, Government, Cloud Operators, Media and Entertainment, E-Commerce, Telecom and Manufacturing are the major end-consumers in the market studied. The scope only includes colocation service operators catering to the increasing digitalization of the end-user industries.
| Keyword | Definition |
|---|---|
| Rack Unit | Generally referred as U or RU, it is the unit of measurement for the server unit housed in the racks in the data center. 1U is equal to 1.75 inches. |
| Rack Density | It defines the amount of power consumed by the equipment and server housed in a rack. It is measured in kilowatt (kW). This factor plays a critical role in data center design and, cooling and power planning. |
| IT Load Capacity | The IT load capacity or installed capacity, refers to the amount of energy consumed by servers and network equipment placed in a rack installed. It is measured in megawatt (MW). |
| Absorption Rate | It denotes how much of the data center capacity has been leased out. For instance, if a 100 MW DC has leased out 75 MW, then the absorption rate would be 75%. It is also referred to as utilization rate and leased-out capacity. |
| Raised Floor Space | It is an elevated space built over the floor. This gap between the original floor and the elevated floor is used to accommodate wiring, cooling, and other data center equipment. This arrangement assists in having proper wiring and cooling infrastructure. It is measured in square feet/meter. |
| Computer Room Air Conditioner (CRAC) | It is a device used to monitor and maintain the temperature, air circulation, and humidity inside the server room in the data center. |
| Aisle | It is the open space between the rows of racks. This open space is critical for maintaining the optimal temperature (20-25 °C) in the server room. There are primarily two aisles inside the server room, a hot aisle and a cold aisle. |
| Cold Aisle | It is the aisle wherein the front of the rack faces the aisle. Here, chilled air is directed into the aisle so that it can enter the front of the racks and maintain the temperature. |
| Hot Aisle | It is the aisle where the back of the racks faces the aisle. Here, the heat dissipated from the equipment’s in the rack is directed to the outlet vent of the CRAC. |
| Critical Load | It includes the servers and other computer equipment whose uptime is critical for data center operation. |
| Power Usage Effectiveness (PUE) | It is a metric which defines the efficiency of a data center. It is calculated by: (𝑇𝑜𝑡𝑎𝑙 𝐷𝑎𝑡𝑎 𝐶𝑒𝑛𝑡𝑒𝑟 𝐸𝑛𝑒𝑟𝑔𝑦 𝐶𝑜𝑛𝑠𝑢𝑚𝑝𝑡𝑖𝑜𝑛)/(𝑇𝑜𝑡𝑎𝑙 𝐼𝑇 𝐸𝑞𝑢𝑖𝑝𝑚𝑒𝑛𝑡 𝐸𝑛𝑒𝑟𝑔𝑦 𝐶𝑜𝑛𝑠𝑢𝑚𝑝𝑡𝑖𝑜𝑛). Further, a data center with a PUE of 1.2-1.5 is considered highly efficient, whereas, a data center with a PUE >2 is considered highly inefficient. |
| Redundancy | It is defined as a system design wherein additional component (UPS, generators, CRAC) is added so that in case of power outage, equipment failure, the IT equipment should not be affected. |
| Uninterruptible Power Supply (UPS) | It is a device that is connected in series with the utility power supply, storing energy in batteries such that the supply from UPS is continuous to IT equipment even during utility power is snapped. The UPS primarily supports the IT equipment only. |
| Generators | Just like UPS, generators are placed in the data center to ensure an uninterrupted power supply, avoiding downtime. Data center facilities have diesel generators and commonly, 48-hour diesel is stored in the facility to prevent disruption. |
| N | It denotes the tools and equipment required for a data center to function at full load. Only "N" indicates that there is no backup to the equipment in the event of any failure. |
| N+1 | Referred to as 'Need plus one', it denotes the additional equipment setup available to avoid downtime in case of failure. A data center is considered N+1 when there is one additional unit for every 4 components. For instance, if a data center has 4 UPS systems, then for to achieve N+1, an additional UPS system would be required. |
| 2N | It refers to fully redundant design wherein two independent power distribution system is deployed. Therefore, in the event of a complete failure of one distribution system, the other system will still supply power to the data center. |
| In-Row Cooling | It is the cooling design system installed between racks in a row where it draws warm air from the hot aisle and supplies cool air to the cold aisle, thereby maintaining the temperature. |
| Tier 1 | Tier classification determines the preparedness of a data center facility to sustain data center operation. A data center is classified as Tier 1 data center when it has a non-redundant (N) power component (UPS, generators), cooling components, and power distribution system (from utility power grids). The Tier 1 data center has an uptime of 99.67% and an annual downtime of <28.8 hours. |
| Tier 2 | A data center is classified as Tier 2 data center when it has a redundant power and cooling components (N+1) and a single non-redundant distribution system. Redundant components include extra generators, UPS, chillers, heat rejection equipment, and fuel tanks. The Tier 2 data center has an uptime of 99.74% and an annual downtime of <22 hours. |
| Tier 3 | A data center having redundant power and cooling components and multiple power distribution systems is referred to as a Tier 3 data center. The facility is resistant to planned (facility maintenance) and unplanned (power outage, cooling failure) disruption. The Tier 3 data center has an uptime of 99.98% and an annual downtime of <1.6 hours. |
| Tier 4 | It is the most tolerant type of data center. A Tier 4 data center has multiple, independent redundant power and cooling components and multiple power distribution paths. All IT equipment are dual powered, making them fault tolerant in case of any disruption, thereby ensuring interrupted operation. The Tier 4 data center has an uptime of 99.74% and an annual downtime of <26.3 minutes. |
| Small Data Center | Data center that has floor space area of ≤ 5,000 Sq. ft or the number of racks that can be installed is ≤ 200 is classified as a small data center. |
| Medium Data Center | Data center which has floor space area between 5,001-20,000 Sq. ft, or the number of racks that can be installed is between 201-800, is classified as a medium data center. |
| Large Data Center | Data center which has floor space area between 20,001-75,000 Sq. ft, or the number of racks that can be installed is between 801-3,000, is classified as a large data center. |
| Massive Data Center | Data center which has floor space area between 75,001-225,000 Sq. ft, or the number of racks that can be installed is between 3001-9,000, is classified as a massive data center. |
| Mega Data Center | Data center that has a floor space area of ≥ 225,001 Sq. ft or the number of racks that can be installed is ≥ 9001 is classified as a mega data center. |
| Retail Colocation | It refers to those customers who have a capacity requirement of 250 kW or less. These services are majorly opted by small and medium enterprises (SMEs). |
| Wholesale Colocation | It refers to those customers who have a capacity requirement between 250 kW to 4 MW. These services are majorly opted by medium to large enterprises. |
| Hyperscale Colocation | It refers to those customers who have a capacity requirement greater than 4 MW. The hyperscale demand primarily originates from large-scale cloud players, IT companies, BFSI, and OTT players (like Netflix, Hulu, and HBO+). |
| Mobile Data Speed | It is the mobile internet speed a user experiences via their smartphones. This speed is primarily dependent on the carrier technology being used in the smartphone. The carrier technologies available in the market are 2G, 3G, 4G, and 5G, where 2G provides the slowest speed while 5G is the fastest. |
| Fiber Connectivity Network | It is a network of optical fiber cables deployed across the country, connecting rural and urban regions with high-speed internet connection. It is measured in kilometer (km). |
| Data Traffic per Smartphone | It is a measure of average data consumption by a smartphone user in a month. It is measured in gigabyte (GB). |
| Broadband Data Speed | It is the internet speed that is supplied over the fixed cable connection. Commonly, copper cable and optic fiber cable are used in both residential and commercial use. Here, optic cable fiber provides faster internet speed than copper cable. |
| Submarine Cable | A submarine cable is a fiber optic cable laid down at two or more landing points. Through this cable, communication and internet connectivity between countries across the globe is established. These cables can transmit 100-200 terabits per second (Tbps) from one point to another. |
| Carbon Footprint | It is the measure of carbon dioxide generated during the regular operation of a data center. Since, coal, and oil & gas are the primary source of power generation, consumption of this power contributes to carbon emissions. Data center operators are incorporating renewable energy sources to curb the carbon footprint emerging in their facilities. |


Research Methodology
Mordor Intelligence follows a four-step methodology in all our reports.
- Step-1: Identify Key Variables: In order to build a robust forecasting methodology, the variables and factors identified in Step-1 are tested against available historical market numbers. Through an iterative process, the variables required for market forecast are set and the model is built on the basis of these variables.
- Step-2: Build a Market Model: Market-size estimations for the forecast years are in nominal terms. Inflation is not a part of the pricing, and the average selling price (ASP) is kept constant throughout the forecast period for each country.
- Step-3: Validate and Finalize: In this important step, all market numbers, variables and analyst calls are validated through an extensive network of primary research experts from the market studied. The respondents are selected across levels and functions to generate a holistic picture of the market studied.
- Step-4: Research Outputs: Syndicated Reports, Custom Consulting Assignments, Databases & Subscription Platforms


