Switzerland Data Center Market Size and Share
Market Overview
| Study Period | 2020 - 2031 |
|---|---|
| Forecast Data Period | 2026 - 2031 |
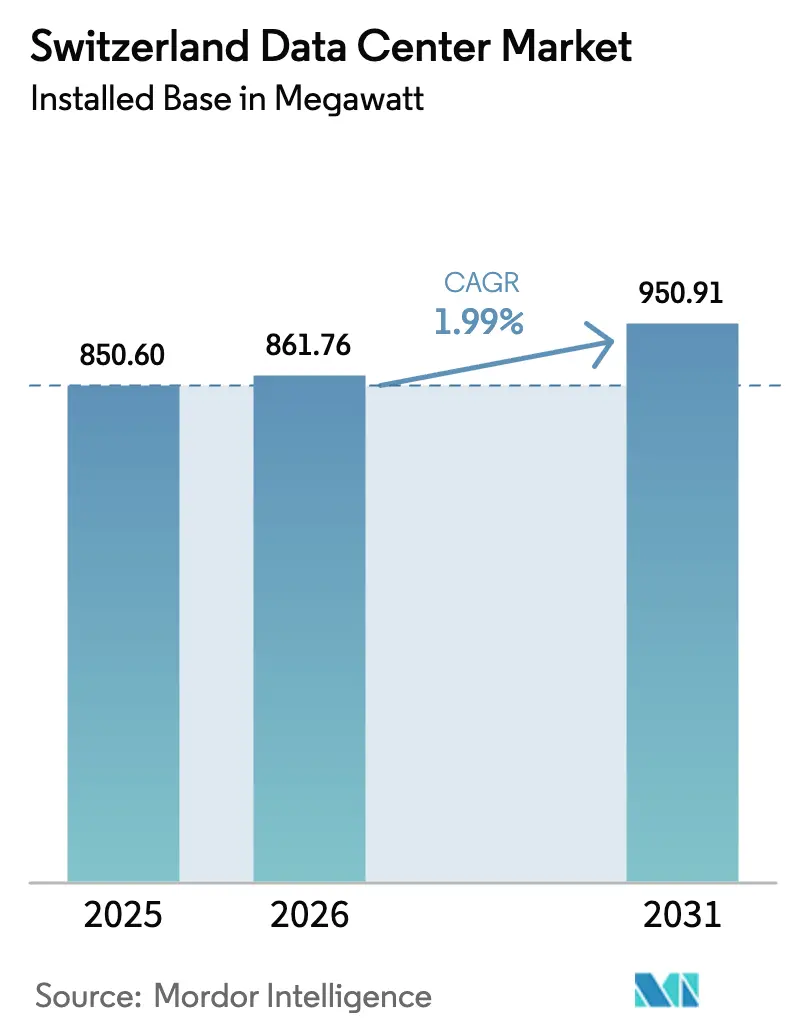
| Base Year Market Size (2025) | 850.60 megawatt |
| Market Volume (2026) | 861.76 megawatt |
| Market Volume (2031) | 950.91 megawatt |
| Growth Rate (2026 - 2031) | 1.99% CAGR |
| Market Concentration | Medium |
Major Players *Disclaimer: Major Players sorted in no particular order Image © Mordor Intelligence. Reuse requires attribution under CC BY 4.0. | |
Switzerland Data Center Market Analysis by Mordor Intelligence
The Switzerland data center market size in terms of installed base is expected to increase from 850.60 megawatt in 2025 to 861.76 megawatt in 2026 and reach 950.91 megawatt by 2031, growing at a CAGR of 1.99% over 2026-2031. Hyperscale, sovereign-cloud, and artificial-intelligence demand is lifting rack power density, pushing operators toward liquid-cooling retrofits and Tier IV redundancy. Zurich still concentrates financial workloads, yet operators are directing incremental megawatts to Basel, Geneva, and Lausanne to curb land and electricity costs. Colocation retains a capacity lead, although self-built hyperscale campuses are rising as cloud providers internalize latency-sensitive infrastructure. Banking compliance, renewable-energy contracts, and waste-heat monetization continue to influence investment playbooks across the Switzerland data center market.
Key Report Takeaways
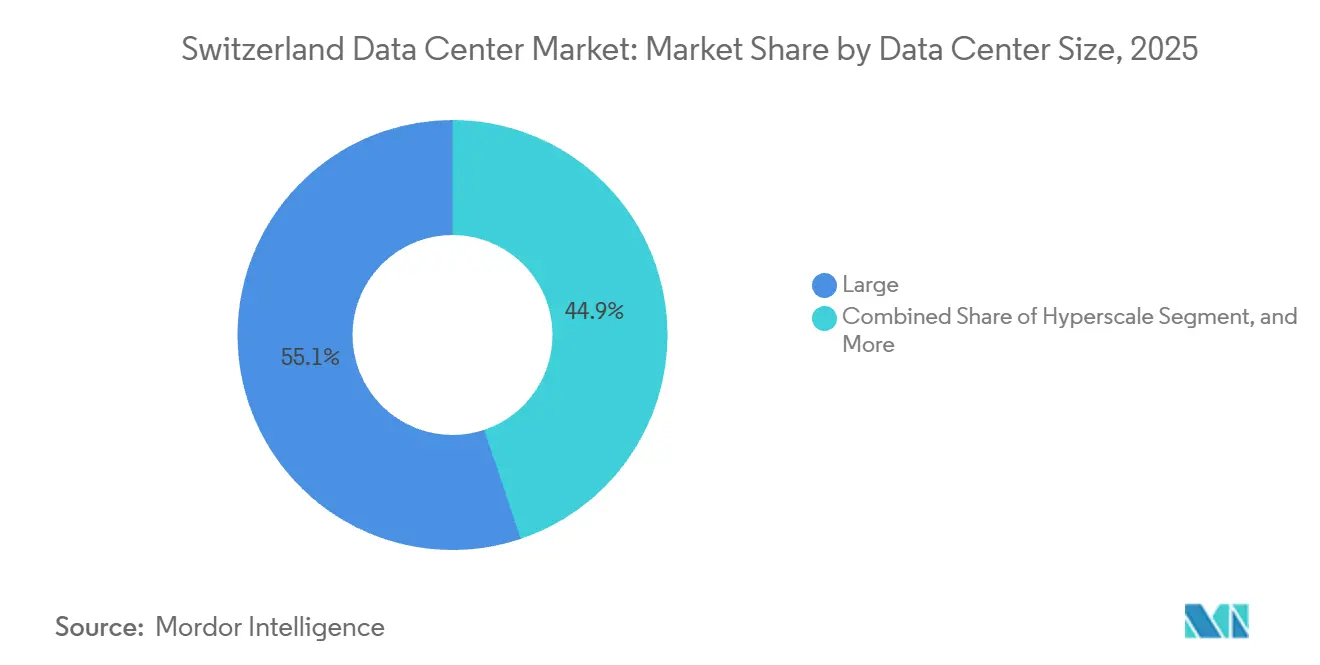
- By data center size, large facilities led with 55.14% of Switzerland data center market share in 2025, while hyperscale builds are projected to advance at a 2.12% CAGR through 2031.
- By tier type, tier 3 sites accounted for 70.15% of capacity in 2025, whereas tier 4 facilities are growing at a 2.32% CAGR through 2031.
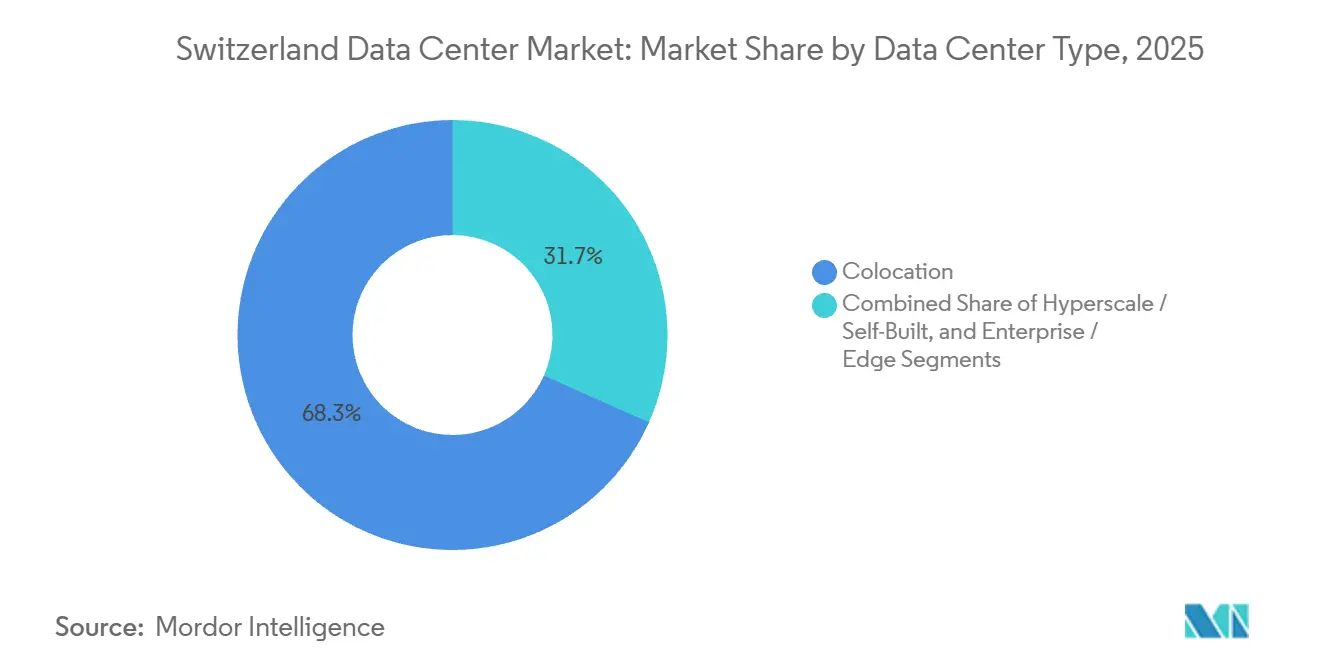
- By data center type, colocation captured 68.35% of the Switzerland data center market in 2025, and the hyperscale and self-built segment is expanding at a 2.63% CAGR through 2031.
- By end user, IT and ITES accounted for 45.61% of installed capacity in 2025, but BFSI is the fastest-growing segment, with a 3.59% CAGR to 2031.
- By hotspot, Zurich held 59.29% of capacity in 2025, while the Rest of Switzerland segment is forecast to expand at a 2.78% CAGR through 2031.
Note: Market size and forecast figures in this report are generated using Mordor Intelligence’s proprietary estimation framework, updated with the latest available data and insights as of 2026.
Switzerland Data Center Market Trends and Insights
Drivers Impact Analysis*
| Driver | (~) % Impact on CAGR Forecast | Geographic Relevance | Impact Timeline |
|---|---|---|---|
| Rising AI and HPC Workloads | +0.6% | National, concentrated in Zurich and Lausanne | Medium term (2-4 years) |
| Hyperscaler Sovereign-Cloud Compliance | +0.5% | National, with early deployments in Zurich | Short term (≤ 2 years) |
| Edge-Computing Mandates by Telecoms | +0.3% | National, distributed across urban and peri-urban zones | Medium term (2-4 years) |
| Renewable-Energy PPA Availability | +0.2% | National, leveraging Alpine hydro and solar capacity | Long term (≥ 4 years) |
| Zurich-Milan DC Inter-Connect Route | +0.1% | Zurich and Ticino, linking to Northern Italy | Long term (≥ 4 years) |
| Federal Tax Incentives for Heat Re-Use | +0.1% | National, with pilot projects in Zurich and Bern | Long term (≥ 4 years) |
| Source: Mordor Intelligence | |||
Rising AI and HPC Workloads
GPU training clusters and physics simulations are elevating rack power densities above 150 kW, far beyond the 50 kW norm found in most enterprise halls.[1]Swiss National Supercomputing Centre, “Alps Supercomputer,” cscs.chThe Alps supercomputer proved liquid-cooled rear-door heat exchangers can tame 7 MW peaks without expanding the physical footprint, a lesson now carried into commercial colocation builds. Digital Realty retrofitted its Zurich ZUR1 site to the same standard, enabling tenants to deploy dense inference clusters with Tier IV redundancy.[2]Digital Realty, “Zurich Data Centers - ZUR1,” digitalrealty.com Higher density shortens payback periods on greenfield projects because operators sell more kilowatts per square meter while keeping envelope costs steady. Facilities that delay liquid-cooling upgrades risk vacancy as AI customers migrate to buildings engineered for next-generation workloads.
Hyperscaler Sovereign-Cloud Compliance
Swiss banking and public-sector rules prohibit sensitive records from residing on infrastructure exposed to foreign intelligence reach, blocking the use of standard hyperscale regions. Microsoft answered in June 2025 with a USD 400 million program that places Azure hardware inside Swiss-registered entities, while cryptographic keys never leave the country.[3]Microsoft, “Microsoft Announces 400 Million Investment in Switzerland,” news.microsoft.comEarly adopters include cantonal governments and tier-one banks that can finally retire legacy on-premises stacks without breaching residency mandates. Rival cloud providers trail this sovereign model, creating a near-term share advantage for Microsoft. Colocation landlords now bundle “Swiss-operated” service tiers to remain relevant to regulated tenants who still prefer multitenant halls.
Edge-Computing Mandates by Telecoms
Swisscom’s 99% 5G coverage and 86% 5G+ footprint shift compute to cell-aggregation points, ensuring augmented-reality guidance and industrial telemetry stay under 10 ms round-trip.[4]Swisscom, “5G Coverage in Switzerland,” swisscom.chMicro data centers housing two to five racks preprocess video streams locally, slashing backhaul bandwidth to Zurich hubs. Sunrise and Salt mirrored the strategy after their 2025 3G retirements, standardizing on prefabricated steel pods that roll out over 6 to 12 months. The architecture fragments are divided into dozens of small but high-density nodes scattered across urban and peri-urban zones. Traditional brick-and-mortar builders must speed project cycles or cede edge share to modular specialists.
Renewable-Energy PPA Availability
Hydro and nuclear already supply most Swiss electricity, letting operators sign 100% renewable contracts that bolster environmental scores without premium tariffs. Green Datacenter taps this mix for its Zurich West campus and achieves free-cooling during 90% of operating hours thanks to year-round Alpine air temperatures below 15 °C. Swisscom’s Wankdorf facility pushes surplus heat into Bern’s district network, earning about CHF 1 million (USD 1.13 million) in annual revenue while displacing gas boilers. Customers in banking and pharma sectors increasingly weigh such carbon metrics when selecting colocation partners. Sites that bundle renewable power, heat reuse, and energy-efficient cooling enjoy a 5-10% operating-cost edge over legacy halls relying solely on mechanical chillers.
Restraints Impact Analysis*
| Restraint | (~) % Impact on CAGR Forecast | Geographic Relevance | Impact Timeline |
|---|---|---|---|
| High Land and Power Pricing in Zurich | -0.4% | Zurich metropolitan area | Short term (≤ 2 years) |
| Grid Congestion in Northern Cantons | -0.3% | Zurich, Aargau, and Basel-Stadt | Medium term (2-4 years) |
| Stricter Swiss Data-Sovereignty Rules | -0.2% | National, affecting cross-border data flows | Medium term (2-4 years) |
| Limited Skilled Workforce Pipeline | -0.1% | National, acute in German-speaking cantons | Long term (≥ 4 years) |
| Source: Mordor Intelligence | |||
High Land and Power Pricing in Zurich
Industrial plots within 20 km of Zurich’s financial district exceed EUR 1,800 per square meter, more than twice the rate in Basel, while electricity tops EUR 0.15 per kWh (USD 0.17 per kWh) for large users. These premiums can add USD 5–7 million to every incremental megawatt of capacity, eroding return on invested capital. Developers now favor Lupfig, Dielsdorf, and other peri-urban towns that sit on the 380 kV backbone yet still meet sub-3 ms latency requirements into Zurich trading floors. The shift trims Zurich’s share of annual megawatt additions even though it remains the connectivity core. Over time, legacy urban halls face rising vacancy unless they secure high-margin AI or banking tenants willing to pay for proximity.
Grid Congestion in Northern Cantons
Transmission operators in Zurich, Aargau, and Basel-Stadt report connection queues of 18–24 months for loads above 10 MW, delaying go-live schedules and escalating financing costs. Swisscom mitigated the issue by spending CHF 15 million (USD 17 million) on dedicated 110 kV feeders at its Wankdorf campus, a budget smaller firms cannot match. Permitting new high-voltage lines averages eight to ten years due to community appeals, creating a chronic mismatch between data-center demand and grid upgrades. Some operators install on-site batteries and rooftop solar to shave peaks, but these add 10–15% to capital expenditure. Without faster approvals, hyperscale projects may detour to cantons with surplus capacity even if that means modest latency penalties.
*Our forecasts treat driver/restraint impacts as directional, not additive. The impact forecasts reflect baseline growth, mix effects, and variable interactions.
Segment Analysis
By Data Center Size: Hyperscale Builds Gain Momentum
Large multi-tenant campuses claimed 55.14% of Switzerland data center market share in 2025, reflecting enterprise demand for 1-5 MW suites near Zurich’s fiber core. Hyperscale projects exceeding 10 MW are scaling faster, clocking a 2.12% CAGR as cloud giants and content networks harden sovereign availability zones. Microsoft’s sovereign-cloud project and Green Datacenter’s 12 MW Zurich West 4 commissioning in 2026 illustrate the swing toward single-tenant mega-blocks.
Medium-sized halls of 2-5 MW remain popular among Swiss banks needing dedicated iron but not hyperscale volumes. Small edge nodes under 1 MW proliferate in telecom portfolios, yet contribute only a marginal share to the Switzerland data center market. Rising hyperscale demand thins utilization in legacy data centers as tenants chase higher densities and Tier IV uptime. CBRE pegged Zurich vacancy at 11% in 2024, the loftiest since 2020. Consolidators such as STACK Infrastructure can absorb under-filled assets, retrofit liquid cooling, and redeploy capacity across customers, sharpening competitive pressure on single-site landlords.


By Tier Type: Tier IV Certifications Unlock Hyperscaler Demand
Tier 3 designs held 70.15% of installed power in 2025, balancing uptime and capex for most enterprises. Hyperscalers and banks now request 2N+1 topologies, pushing Tier IV footprints to grow at 2.32% through 2031. Six Swiss sites already sport Uptime Institute Tier IV plaques, enabling 20-30% rental premiums and multi-year anchor agreements.
Tier I and Tier II halls remain confined to the edge and small enterprise rooms with relaxed availability targets. Operators eyeing hyperscaler or BFSI tenants often start with Tier IV from day one, as retro-adding redundant feeds and chillers rarely pencils out. Green Datacenter future-proofed Zurich West 4 by wiring space and power pathways for an eventual Tier IV swing, safeguarding long-term repositioning options.
By Data Center Type: Self-Built Hyperscale Gains Share
Colocation kept 68.35% of Switzerland data center market share in 2025, serving SaaS firms and regional cloud resellers. The hyperscale and self-built slice is tracking a 2.63% CAGR, led by Microsoft, AWS, and Google, as they reroute latency-critical stacks into proprietary halls. Microsoft’s sovereign-cloud build skirts colocation intermediaries to ensure legal control and cryptographic key custody.
In colocation, wholesale customers leasing 500 kW-plus suites deliver returns on invested capital 40-50% higher than retail cabinets, pushing operators to aggressively court hyperscalers. Retail colocation still attracts startups and legacy IT workloads, yet margins are compressing as customers refactor to public cloud platforms. Facilities that blend wholesale and retail, such as Digital Realty’s Zurich ZUR1, can bridge the segments, but success hinges on securing anchor leases that underpin long-term utilization.
By End User: BFSI Leads Growth Amid Compliance Pressures
IT and ITES firms represented 45.61% of the 2025 load, a nod to Switzerland’s vibrant software scene. BFSI grows the fastest, with a 3.59% CAGR, propelled by strict mandates that prohibit cross-border processing of transaction data. UBS, Credit Suisse, and Julius Baer each maintain dedicated halls to support real-time payments and low-latency trading. Manufacturing, pharma, and precision-engineering companies deploy edge nodes for predictive maintenance, yet their cumulative footprint stays modest.
Government agencies, historically cloud-averse, are pivoting toward hybrid stacks after Microsoft unlocked a sovereign path that aligns with Swiss data protection laws. Telecom operators occupy a dual role, hosting network functions in captive halls while leasing colocation racks for content-delivery caches. Their edge rollouts add diverse, geographically dispersed load pockets to the Switzerland data center market.
Geography Analysis
Peripheral cantons collectively accounted for 40.71% of capacity in 2025 and are projected to absorb the majority of new megawatts through 2031. Basel leverages its tri-national location to host pharmaceutical giants seeking redundant Swiss, German, and French network paths. Geneva’s appeal lies in serving multinational bodies and commodity-trading houses that value Swiss legal protections but do not need Zurich-grade latency.
Bern is fast becoming a Tier IV cluster, anchored by Swisscom’s Wankdorf campus, which recycles waste heat into district pipes, lowering city scope-1 emissions. Lausanne hosts BrainServe Datacenter, another Tier IV site that gives hyperscalers a French-speaking fallback when Zurich grids tighten. Ticino remains an emerging play, positioned as a midway hop between Zurich and Milan, yet capacity additions lag due to limited skilled labor and fewer large pre-zoned plots.
Overall, Switzerland’s topology is maturing into a hub-and-spoke pattern. Zurich retains latency-critical banking and fintech applications, while data-resilient AI training, disaster recovery, and CDN nodes relocate to lower-cost rings. This mix insulates the Switzerland data center market from single-city shocks and supports steady national growth even as Zurich land and power premiums climb.
Competitive Landscape
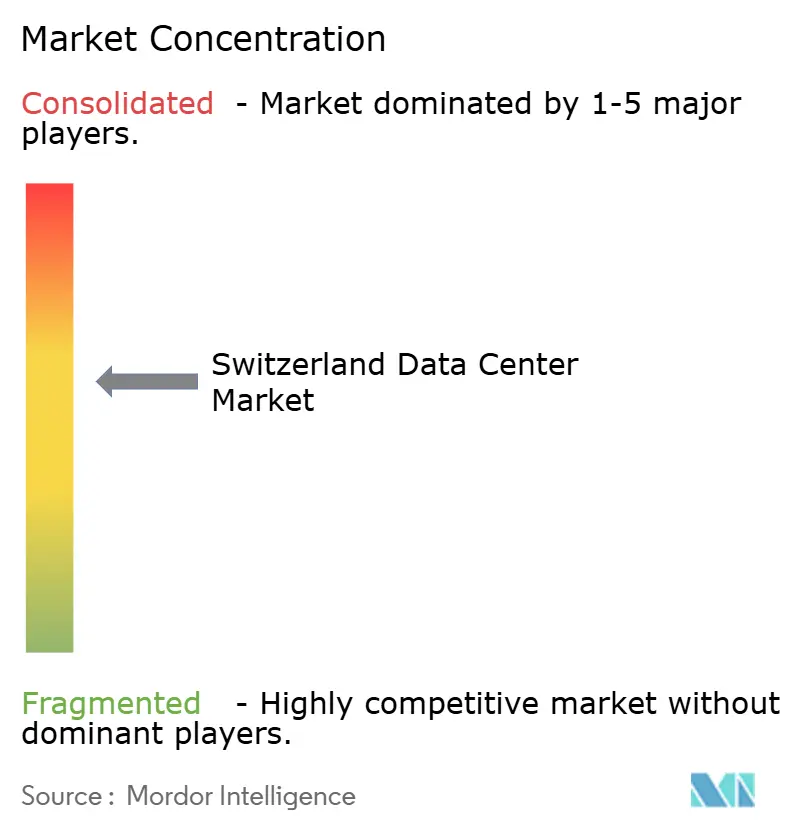
Switzerland's data center market is moderately concentrated, led by global colocation platforms and sovereign-cloud hyperscalers. By 2025, Equinix, Digital Realty, and STACK Infrastructure controlled nearly 40% of installed megawatts, leveraging carrier density, cross-connect services, and multi-cloud gateways. STACK Infrastructure strengthened its position with a USD 2.8 billion acquisition of Safe Host, adding five halls and 55 MW. Microsoft invested USD 400 million in a sovereign-cloud program, securing banking and public-sector workloads while bypassing third-party landlords. These moves highlight Swiss sovereign demand as a hedge against volatility in European data-residency rules.
Local specialists focus on sustainability and certifications. Swisscom operates seven facilities that offer connectivity, private cloud, and edge nodes under a single contract. Green Datacenter emphasizes Tier IV design, renewable energy, and a Zurich West 4 hall (2026) with power-usage-effectiveness below 1.20, contributing heat to the district grid. Smaller players like Rechenzentrum Ostschweiz and NTS Colocation target hyperscaler leases but face slower expansion due to limited resources.
Strategic opportunities lie in edge clusters, waste-heat reuse, and managed sovereign-cloud services. Operators combining Zurich megacamps with satellite halls in Basel, Bern, and Geneva can optimize latency, grid capacity, and costs. Hyperscalers rely on colocation partners for rapid capacity and disaster recovery. Providers integrating liquid cooling, district-heat reuse, and renewable energy appeal to banking and pharmaceutical sectors under ESG scrutiny. Switzerland's data center market serves as a compliance refuge and a testbed for efficient, low-carbon operations.
Switzerland Data Center Industry Leaders
STACK Infrastructure
Microsoft Corporation
Vantage Data Centers Management Company, LLC
Green Datacenter AG
Equinix, Inc.
- *Disclaimer: Major Players sorted in no particular order

Recent Industry Developments
- January 2026: Green Datacenter commissioned Zurich West 4, delivering 12 MW of IT load and feeding waste heat into local district networks.
- October 2025: Green Datacenter entered Frankfurt, expanding its cross-border footprint with waste-heat recovery know-how.
- September 2025: NorthC announced a Basel facility aimed at pharma and finance tenants needing tri-national fiber routes.
- June 2025: Microsoft allocated USD 400 million for Azure sovereign-cloud regions under Swiss jurisdiction.


Switzerland Data Center Market Report Scope
The data center market encompasses the infrastructure, services, and technologies that support the storage, management, and processing of data. This market includes various data center sizes, tier classifications, types, end-user industries, and hotspots, reflecting the diverse needs of businesses and organizations operating in the country.
The Switzerland Data Center Market Report is Segmented by Data Center Size (Small, Medium, Large, and Hyperscale), Tier Type (Tier 1 and 2, Tier 3, and Tier 4), Data Center Type (Hyperscale/Self-Built, Enterprise/Edge, and Colocation), End User (BFSI, IT and ITES, E-Commerce, Government, Manufacturing, Media and Entertainment, Telecom, and Other End Users), and Hotspot (Zurich, and Rest of Switzerland). The Market Forecasts are Provided in Terms of IT Load Capacity (Megawatt).
| Small |
| Medium |
| Large |
| Hyperscale |
| Tier 1 and 2 |
| Tier 3 |
| Tier 4 |
| Hyperscale / Self-Built | ||
| Enterprise / Edge | ||
| Colocation | Non-Utilized | |
| Utilized | Retail Colocation | |
| Wholesale Colocation | ||
| BFSI |
| IT and ITES |
| E-Commerce |
| Government |
| Manufacturing |
| Media and Entertainment |
| Telecom |
| Other End Users |
| Zurich |
| Rest of Switzerland |
| By Data Center Size | Small | ||
| Medium | |||
| Large | |||
| Hyperscale | |||
| By Tier Type | Tier 1 and 2 | ||
| Tier 3 | |||
| Tier 4 | |||
| By Data Center Type | Hyperscale / Self-Built | ||
| Enterprise / Edge | |||
| Colocation | Non-Utilized | ||
| Utilized | Retail Colocation | ||
| Wholesale Colocation | |||
| By End User | BFSI | ||
| IT and ITES | |||
| E-Commerce | |||
| Government | |||
| Manufacturing | |||
| Media and Entertainment | |||
| Telecom | |||
| Other End Users | |||
| By Hotspot | Zurich | ||
| Rest of Switzerland | |||


Market Definition
- IT LOAD CAPACITY - The IT load capacity or installed capacity, refers to the amount of energy consumed by servers and network equipments placed in a rack installed. It is measured in megawatt (MW).
- ABSORPTION RATE - It denotes the extend to which the data center capacity has been leased out. For instance, a 100 MW DC has leased out 75 MW, then absorption rate would be 75%. It is also referred as utilization rate and leased-out capacity.
- RAISED FLOOR SPACE - It is an elevated space build over the floor. This gap between the original floor and the elevated floor is used to accommodate wiring, cooling, and other data center equipment. This arrangement assist in having proper wiring and cooling infrastructure. It is measured in square feet (ft^2).
- DATA CENTER SIZE - Data Center Size is segmented based on the raised floor space allocated to the data center facilities. Mega DC - # of Racks must be more than 9000 or RFS (raised floor space) must be more than 225001 Sq. ft; Massive DC - # of Racks must be in between 9000 and 3001 or RFS must be in between 225000 Sq. ft and 75001 Sq. ft; Large DC - # of Racks must be in between 3000 and 801 or RFS must be in between 75000 Sq. ft and 20001 Sq. ft; Medium DC # of Racks must be in between 800 and 201 or RFS must be in between 20000 Sq. ft and 5001 Sq. ft; Small DC - # of Racks must be less than 200 or RFS must be less than 5000 Sq. ft.
- TIER TYPE - According to Uptime Institute the data centers are classified into four tiers based on the proficiencies of redundant equipment of the data center infrastructure. In this segment the data center are segmented as Tier 1,Tier 2, Tier 3 and Tier 4.
- COLOCATION TYPE - The segment is segregated into 3 categories namely Retail, Wholesale and Hyperscale Colocation service. The categorization is done based on the amount of IT load leased out to potential customers. Retail colocation service has leased capacity less than 250 kW; Wholesale colocation services has leased capacity between 251 kW and 4 MW and Hyperscale colocation services has leased capacity more than 4 MW.
- END CONSUMERS - The Data Center Market operates on a B2B basis. BFSI, Government, Cloud Operators, Media and Entertainment, E-Commerce, Telecom and Manufacturing are the major end-consumers in the market studied. The scope only includes colocation service operators catering to the increasing digitalization of the end-user industries.
| Keyword | Definition |
|---|---|
| Rack Unit | Generally referred as U or RU, it is the unit of measurement for the server unit housed in the racks in the data center. 1U is equal to 1.75 inches. |
| Rack Density | It defines the amount of power consumed by the equipment and server housed in a rack. It is measured in kilowatt (kW). This factor plays a critical role in data center design and, cooling and power planning. |
| IT Load Capacity | The IT load capacity or installed capacity, refers to the amount of energy consumed by servers and network equipment placed in a rack installed. It is measured in megawatt (MW). |
| Absorption Rate | It denotes how much of the data center capacity has been leased out. For instance, if a 100 MW DC has leased out 75 MW, then the absorption rate would be 75%. It is also referred to as utilization rate and leased-out capacity. |
| Raised Floor Space | It is an elevated space built over the floor. This gap between the original floor and the elevated floor is used to accommodate wiring, cooling, and other data center equipment. This arrangement assists in having proper wiring and cooling infrastructure. It is measured in square feet/meter. |
| Computer Room Air Conditioner (CRAC) | It is a device used to monitor and maintain the temperature, air circulation, and humidity inside the server room in the data center. |
| Aisle | It is the open space between the rows of racks. This open space is critical for maintaining the optimal temperature (20-25 °C) in the server room. There are primarily two aisles inside the server room, a hot aisle and a cold aisle. |
| Cold Aisle | It is the aisle wherein the front of the rack faces the aisle. Here, chilled air is directed into the aisle so that it can enter the front of the racks and maintain the temperature. |
| Hot Aisle | It is the aisle where the back of the racks faces the aisle. Here, the heat dissipated from the equipment’s in the rack is directed to the outlet vent of the CRAC. |
| Critical Load | It includes the servers and other computer equipment whose uptime is critical for data center operation. |
| Power Usage Effectiveness (PUE) | It is a metric which defines the efficiency of a data center. It is calculated by: (𝑇𝑜𝑡𝑎𝑙 𝐷𝑎𝑡𝑎 𝐶𝑒𝑛𝑡𝑒𝑟 𝐸𝑛𝑒𝑟𝑔𝑦 𝐶𝑜𝑛𝑠𝑢𝑚𝑝𝑡𝑖𝑜𝑛)/(𝑇𝑜𝑡𝑎𝑙 𝐼𝑇 𝐸𝑞𝑢𝑖𝑝𝑚𝑒𝑛𝑡 𝐸𝑛𝑒𝑟𝑔𝑦 𝐶𝑜𝑛𝑠𝑢𝑚𝑝𝑡𝑖𝑜𝑛). Further, a data center with a PUE of 1.2-1.5 is considered highly efficient, whereas, a data center with a PUE >2 is considered highly inefficient. |
| Redundancy | It is defined as a system design wherein additional component (UPS, generators, CRAC) is added so that in case of power outage, equipment failure, the IT equipment should not be affected. |
| Uninterruptible Power Supply (UPS) | It is a device that is connected in series with the utility power supply, storing energy in batteries such that the supply from UPS is continuous to IT equipment even during utility power is snapped. The UPS primarily supports the IT equipment only. |
| Generators | Just like UPS, generators are placed in the data center to ensure an uninterrupted power supply, avoiding downtime. Data center facilities have diesel generators and commonly, 48-hour diesel is stored in the facility to prevent disruption. |
| N | It denotes the tools and equipment required for a data center to function at full load. Only "N" indicates that there is no backup to the equipment in the event of any failure. |
| N+1 | Referred to as 'Need plus one', it denotes the additional equipment setup available to avoid downtime in case of failure. A data center is considered N+1 when there is one additional unit for every 4 components. For instance, if a data center has 4 UPS systems, then for to achieve N+1, an additional UPS system would be required. |
| 2N | It refers to fully redundant design wherein two independent power distribution system is deployed. Therefore, in the event of a complete failure of one distribution system, the other system will still supply power to the data center. |
| In-Row Cooling | It is the cooling design system installed between racks in a row where it draws warm air from the hot aisle and supplies cool air to the cold aisle, thereby maintaining the temperature. |
| Tier 1 | Tier classification determines the preparedness of a data center facility to sustain data center operation. A data center is classified as Tier 1 data center when it has a non-redundant (N) power component (UPS, generators), cooling components, and power distribution system (from utility power grids). The Tier 1 data center has an uptime of 99.67% and an annual downtime of <28.8 hours. |
| Tier 2 | A data center is classified as Tier 2 data center when it has a redundant power and cooling components (N+1) and a single non-redundant distribution system. Redundant components include extra generators, UPS, chillers, heat rejection equipment, and fuel tanks. The Tier 2 data center has an uptime of 99.74% and an annual downtime of <22 hours. |
| Tier 3 | A data center having redundant power and cooling components and multiple power distribution systems is referred to as a Tier 3 data center. The facility is resistant to planned (facility maintenance) and unplanned (power outage, cooling failure) disruption. The Tier 3 data center has an uptime of 99.98% and an annual downtime of <1.6 hours. |
| Tier 4 | It is the most tolerant type of data center. A Tier 4 data center has multiple, independent redundant power and cooling components and multiple power distribution paths. All IT equipment are dual powered, making them fault tolerant in case of any disruption, thereby ensuring interrupted operation. The Tier 4 data center has an uptime of 99.74% and an annual downtime of <26.3 minutes. |
| Small Data Center | Data center that has floor space area of ≤ 5,000 Sq. ft or the number of racks that can be installed is ≤ 200 is classified as a small data center. |
| Medium Data Center | Data center which has floor space area between 5,001-20,000 Sq. ft, or the number of racks that can be installed is between 201-800, is classified as a medium data center. |
| Large Data Center | Data center which has floor space area between 20,001-75,000 Sq. ft, or the number of racks that can be installed is between 801-3,000, is classified as a large data center. |
| Massive Data Center | Data center which has floor space area between 75,001-225,000 Sq. ft, or the number of racks that can be installed is between 3001-9,000, is classified as a massive data center. |
| Mega Data Center | Data center that has a floor space area of ≥ 225,001 Sq. ft or the number of racks that can be installed is ≥ 9001 is classified as a mega data center. |
| Retail Colocation | It refers to those customers who have a capacity requirement of 250 kW or less. These services are majorly opted by small and medium enterprises (SMEs). |
| Wholesale Colocation | It refers to those customers who have a capacity requirement between 250 kW to 4 MW. These services are majorly opted by medium to large enterprises. |
| Hyperscale Colocation | It refers to those customers who have a capacity requirement greater than 4 MW. The hyperscale demand primarily originates from large-scale cloud players, IT companies, BFSI, and OTT players (like Netflix, Hulu, and HBO+). |
| Mobile Data Speed | It is the mobile internet speed a user experiences via their smartphones. This speed is primarily dependent on the carrier technology being used in the smartphone. The carrier technologies available in the market are 2G, 3G, 4G, and 5G, where 2G provides the slowest speed while 5G is the fastest. |
| Fiber Connectivity Network | It is a network of optical fiber cables deployed across the country, connecting rural and urban regions with high-speed internet connection. It is measured in kilometer (km). |
| Data Traffic per Smartphone | It is a measure of average data consumption by a smartphone user in a month. It is measured in gigabyte (GB). |
| Broadband Data Speed | It is the internet speed that is supplied over the fixed cable connection. Commonly, copper cable and optic fiber cable are used in both residential and commercial use. Here, optic cable fiber provides faster internet speed than copper cable. |
| Submarine Cable | A submarine cable is a fiber optic cable laid down at two or more landing points. Through this cable, communication and internet connectivity between countries across the globe is established. These cables can transmit 100-200 terabits per second (Tbps) from one point to another. |
| Carbon Footprint | It is the measure of carbon dioxide generated during the regular operation of a data center. Since, coal, and oil & gas are the primary source of power generation, consumption of this power contributes to carbon emissions. Data center operators are incorporating renewable energy sources to curb the carbon footprint emerging in their facilities. |


Research Methodology
Mordor Intelligence follows a four-step methodology in all our reports.
- Step-1: Identify Key Variables: In order to build a robust forecasting methodology, the variables and factors identified in Step-1 are tested against available historical market numbers. Through an iterative process, the variables required for market forecast are set and the model is built on the basis of these variables.
- Step-2: Build a Market Model: Market-size estimations for the forecast years are in nominal terms. Inflation is not a part of the pricing, and the average selling price (ASP) is kept constant throughout the forecast period for each country.
- Step-3: Validate and Finalize: In this important step, all market numbers, variables and analyst calls are validated through an extensive network of primary research experts from the market studied. The respondents are selected across levels and functions to generate a holistic picture of the market studied.
- Step-4: Research Outputs: Syndicated Reports, Custom Consulting Assignments, Databases & Subscription Platforms


