
IoT Connectivity Cost Optimization Market Size and Share
Market Overview
| Study Period | 2021 - 2032 |
|---|---|
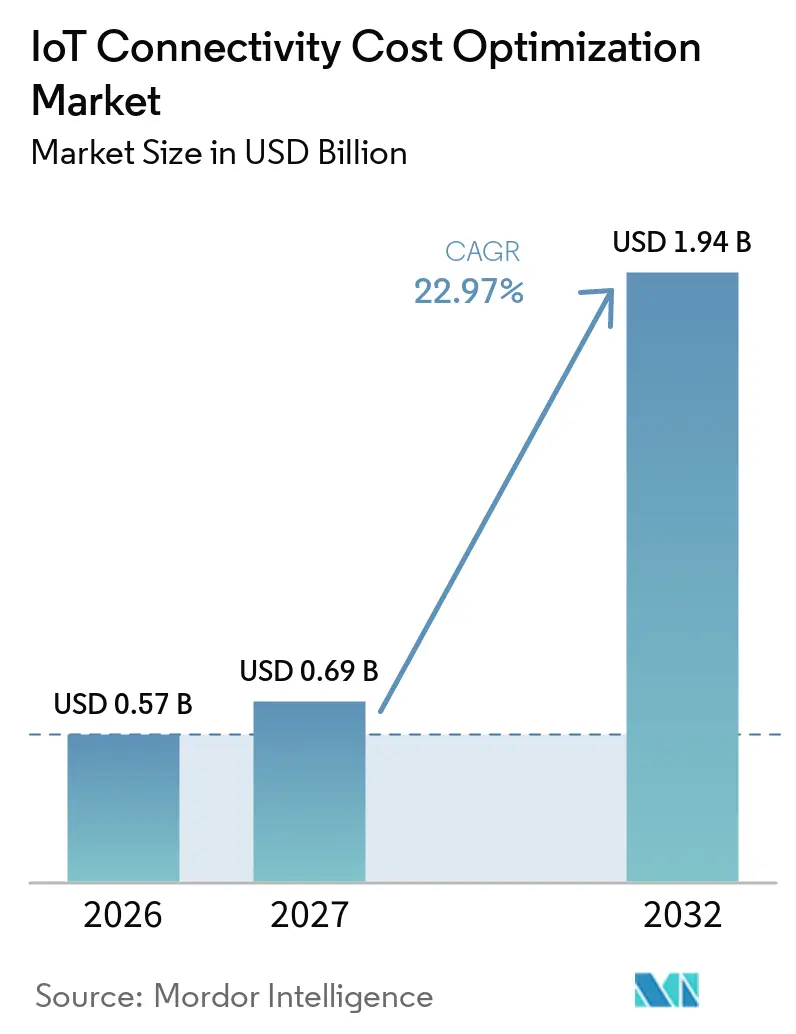
| Market Size (2027) | USD 0.69 Billion |
| Market Size (2032) | USD 1.94 Billion |
| Growth Rate (2027 - 2032) | 22.97 % |
| Fastest Growing Market | Middle East |
| Largest Market | North America |
| Market Concentration | Medium |
Major Players *Disclaimer: Major Players sorted in no particular order Image © Mordor Intelligence. Reuse requires attribution under CC BY 4.0. | |
IoT Connectivity Cost Optimization Market Analysis by Mordor Intelligence
The IoT connectivity cost optimization market size is valued at USD 0.57 billion in 2026 and is projected to reach USD 1.94 billion by 2032, advancing at a CAGR of 22.97% from 2027 to 2032. The larger installed base has made data-plan control, carrier selection, and usage monitoring more important for operators managing devices across several networks, subsidiaries, and operating locations with different tariff structures. Enterprises are shifting spending toward platforms and services that can reduce connectivity waste across industrial operations, transport fleets, utilities, and public infrastructure. The 2025 GSMA SGP.32 specification supports remote carrier changes without replacing a physical SIM, which broadens the options available to global device fleets. Network retirements are also prompting enterprises to review existing contracts and move devices to LTE-M, NB-IoT, and 5G services. These conditions make the IoT connectivity cost-optimization market relevant to established platform providers and specialists who offer flexible, multi-network management, implementation support, and commercial planning for complex fleets.
Key Report Takeaways
- By connectivity technology, cellular connectivity accounted for 39.16% of revenue in 2026, while satellite and non-terrestrial connectivity a projected to grow at a 24.66% CAGR through 2032.ted to expand at a 23.44% CAGR through 2032.
- By connectivity technology, cellular connectivity accounted for 39.16% of revenue in 2026, while satellite and non-terrestrial connectivity are projected to grow at a 24.66% CAGR through 2032.
- By deployment model, cloud deployment accounted for 55.76% of revenue in 2026, while hybrid and edge-cloud deployment are projected to expand at a 23.78% CAGR through 2032.
- By application, industrial manufacturing and automation accounted for 20.17% of revenue in 2026, while smart cities and infrastructure are projected to grow at a 24.11% CAGR through 2032.
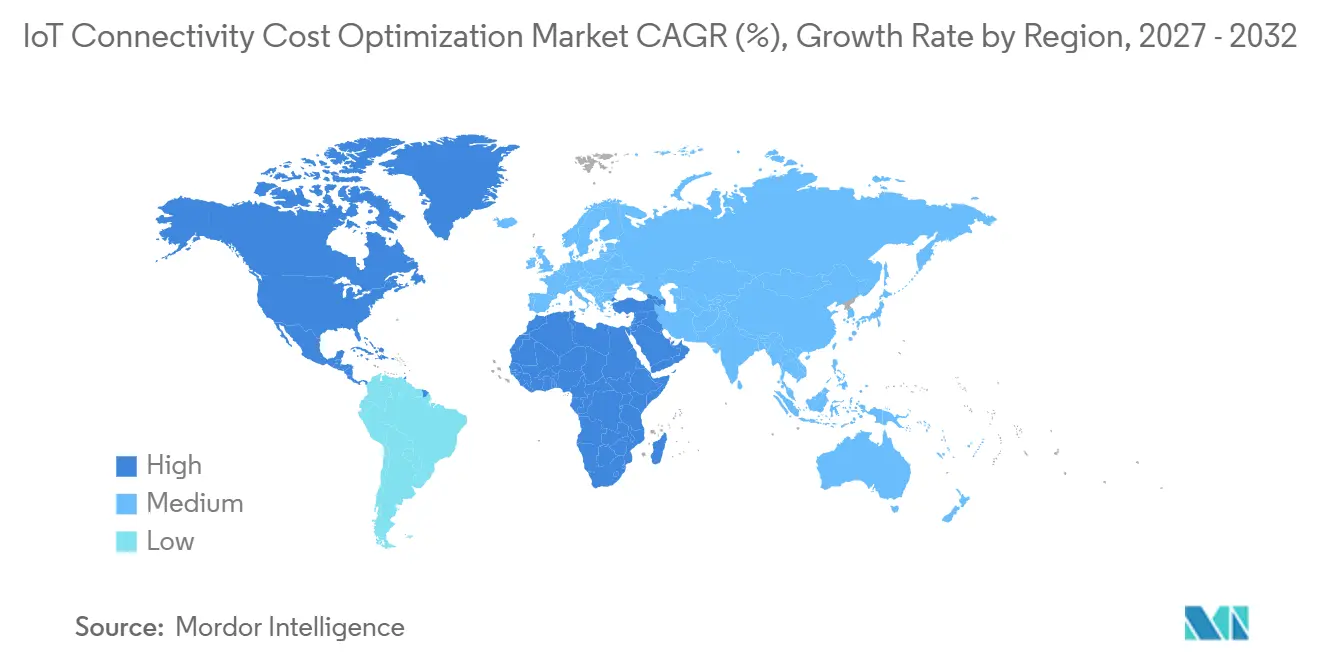
- By geography, North America held 26.87% of revenue in 2026, while the Middle East is projected to expand at a 24.32% CAGR through 2032.
Note: Market numbers in this report are based on Mordor Intelligence's proprietary estimation framework, which combines nine months of actuals with Q4 projections for base year 2026.
Market Trends and Insights
Drivers Impact Analysis of IoT Connectivity Cost Optimization Market*
| DRIVER | (~) % IMPACT ON CAGR FORECAST | GEOGRAPHIC RELEVANCE | IMPACT TIMELINE |
|---|---|---|---|
| Proliferation of Connected Devices | +4.80% | Global | Short term (≤ 2 years) |
| eSIM and iSIM Adoption | +4.20% | Global, with early gains in North America, Europe, and China | Short term (≤ 2 years) |
| Expansion of 5G, LPWAN, and Edge Connectivity | +3.80% | Asia-Pacific core, spill-over to North America and Europe | Medium term (2-4 years) |
| Shift Toward Cloud-Managed Connectivity Services | +3.30% | Global | Short term (≤ 2 years) |
| Digital Transformation in Industrial, Transport, and Utility Operations | +2.60% | North America, Europe, and the Asia-Pacific | Medium term (2-4 years) |
| Demand for Unified Multi-Network Orchestration | +1.80% | Global, with early gains in North America and Europe | Medium term (2-4 years) |
| Source: Mordor Intelligence | |||
Proliferation of Connected Devices
The scale of connected fleets makes small reductions in per-device charges meaningful for operating budgets. Cellular IoT connections reached 4.5 billion at the end of 2025, including 2.6 billion broadband and critical 4G and 5G IoT connections, while total IoT connections reached 22.3 billion.[1] Ericsson expects total connections to reach 47.1 billion by 2031. The IoT connectivity cost optimization market, therefore, serves organizations that need to control spending across larger and more varied device fleets. Device growth among health care operators, agricultural businesses, and utility operators also expands demand for managed support where internal network expertise is limited. By the end of 2025, 80 service providers had completed 3G shutdowns, and 46 had fully decommissioned 2G, prompting device migrations and contract reviews.
eSIM and iSIM Adoption
The GSMA SGP.32 specification enables remote management of IoT eSIM profiles and can reduce the need for physical SIM handling. This capability allows enterprises to switch carriers remotely when coverage, commercial terms, or operating conditions change. Global eSIM smartphone penetration reached 5% at the end of 2025 and is expected to reach 10% by the end of 2026.[2] Apple’s wider eSIM-only device strategy and the launch of smartphone eSIM services by Chinese operators were important late-2025 developments. The IoT connectivity cost optimization market can benefit as device makers and operators use remote profile management for global deployment, especially when fleets cross carrier boundaries and cannot rely on a single local network. iSIM adoption can further lower hardware and logistics costs in metering and asset-tracking programs because SIM functions are embedded in the chipset.
Expansion of 5G, LPWAN, and Edge Connectivity
5G RedCap offers a lower-complexity option for connected sensors and wearables that do not need the full capability of conventional 5G. In April 2026, Ericsson reported that 14 service providers had launched 5G RedCap commercially and 42 providers in 27 countries were investing in the technology. The development makes 5G more practical for mid-range IoT devices and adds new workloads to connectivity management platforms. Semtech stated that LoRa technology had reached 125 million LoRaWAN deployments globally by January 2026.[3] Enterprises increasingly operate cellular, LPWAN, and satellite connections in parallel, which increases the value of a single system for usage visibility and policy control. The IoT connectivity cost optimization market is positioned to address this multi-network complexity without requiring each business unit to manage separate tools.
Shift Toward Cloud-Managed Connectivity Services
Enterprises are moving from individual carrier portals to cloud-managed systems that can monitor multiple operators through a single interface. Cisco stated that its Mobility Services Platform served more than 60 telecommunications operators, managed more than 270 million devices, and processed over 500 terabytes of data each day in mid-2025.[4] Cisco and Tata Communications announced a collaboration in September 2025 to integrate Tata’s MOVE eSIM orchestration solution into Cisco IoT Control Center. Tata’s solution covered 350 million eSIM operating systems across more than 200 countries at the time of the announcement. Cloud platforms can give procurement teams usage evidence for carrier discussions and make contract management more transparent. The IoT connectivity cost optimization market benefits when customers view the platform as a tool for contract control and operational monitoring.
Restraints Impact Analysis of IoT Connectivity Cost Optimization Market*
| RESTRAINT | (~) % IMPACT ON CAGR FORECAST | GEOGRAPHIC RELEVANCE | IMPACT TIMELINE |
|---|---|---|---|
| Cybersecurity, Privacy, and Data-Governance Exposure | -1.30% | Global | Short term (≤ 2 years) |
| High Infrastructure and Network-Management Costs | -1.00% | Emerging markets in South America, Africa, and the Middle East | Medium term (2-4 years) |
| Interoperability Across Networks, Protocols, and Platforms | -0.80% | Global | Medium term (2-4 years) |
| Permanent-Roaming Restrictions and Local Data-Residency Requirements | -0.60% | Europe, the Middle East, and the Asia-Pacific | Long term (≥ 4 years) |
| Source: Mordor Intelligence | |||
Cybersecurity, Privacy, and Data-Governance Exposure
Connectivity platforms combine device telemetry, location data, usage data, and SIM controls into a single environment. A 2025 article in Electronics identified insecure APIs, adversarial AI attacks, and constraints in lightweight cryptography as linked vulnerabilities in cloud-connected IoT systems. A compromised platform could disrupt connectivity across a large device fleet by retaining control-plane access to SIM profiles. These risks lengthen procurement reviews and increase demand for security assessments, audit records, and documented data controls. Smaller providers can face a heavier compliance burden when customers require extensive evidence of security readiness. The IoT connectivity cost optimization market may consequently favor vendors with established security and regulatory capabilities.
High Infrastructure and Network-Management Costs
Multi-carrier agreements, global SIM provisioning, and around-the-clock network operations can reduce the immediate savings from a new optimization program, particularly when a customer must build interfaces and support processes across several network partners. These fixed costs are easier to spread across large device fleets than small fleets. The burden is pronounced in parts of South America and Sub-Saharan Africa where carrier consolidation has been slower and tariff visibility can be limited. Local compliance rules can add further implementation work for organizations managing international devices. Large enterprises can offset these costs through savings across many connections, while smaller firms may postpone investment. This limits the short-term reach of the IoT connectivity cost optimization market in areas where connectivity charges and potential savings are both high.
*Our forecasts treat driver/restraint impacts as directional, not additive. The impact forecasts reflect baseline growth, mix effects, and variable interactions.
IoT Connectivity Cost Optimization Market Segment Analysis
By Offering:
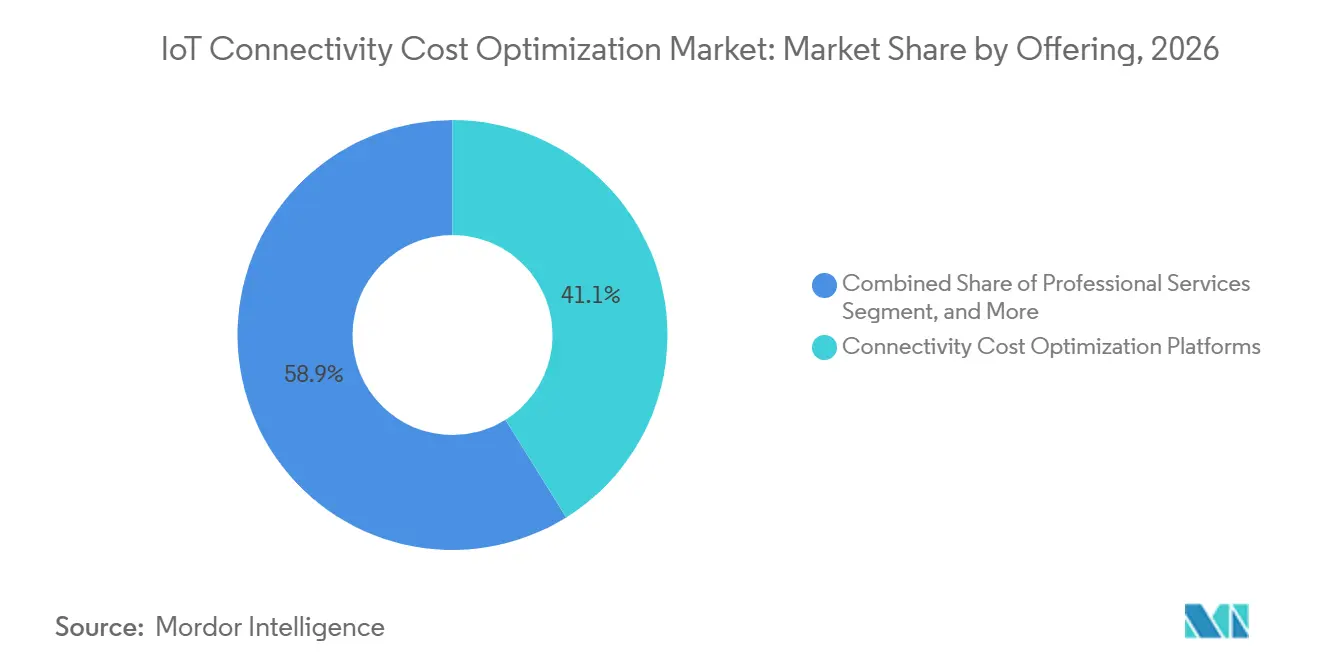
Platforms Lead While Managed Services ScaleConnectivity cost optimization platforms are projected to hold a 41.12% share of the IoT connectivity cost optimization market in 2026. This position reflects demand for a unified control plane that tracks carrier spending, data anomalies, and plan usage across large device fleets. Platform capabilities now extend beyond reporting to include automated policies, threshold controls, and profile management. Cisco IoT Control Center has introduced policy automation that supports SIM profile changes based on cost and coverage conditions. This capability shifts cost management from post-use bill reviews to action-based on predefined operating rules.
Managed connectivity optimization services are projected to grow at a 23.44% CAGR through 2032. Many customers in the IoT connectivity cost optimization market prefer contracts that define service outcomes rather than purchasing software licenses and operating systems independently. Providers can assume responsibility for monitoring data plans, resolving exceptions, and supporting carrier negotiations. Professional services also remain relevant for assessment, implementation, integration, support, and maintenance. SGP.32 transitions may further increase demand for these services, as enterprises will need to migrate SIM inventories and reconfigure provisioning workflows.

By Connectivity Technology:
Cellular Leads While Satellite Extends ReachCellular connectivity is projected to account for 39.16% of revenue in 2026, making it the largest technology category in the IoT connectivity cost optimization market. Extensive carrier infrastructure across North America, Europe, and Asia-Pacific supports its use across enterprise fleets. The retirement of legacy 2G and 3G networks is driving device migrations and new commercial agreements. Ericsson expects 80 service providers to complete 3G shutdowns by the end of 2025. These changes allow customers to reassess tariffs, coverage, and management models as they migrate devices to current networks.
Satellite and non-terrestrial connectivity are projected to grow at a 24.66% CAGR through 2032. The IoT connectivity cost optimization market supports assets operating beyond reliable terrestrial coverage, including remote industrial sites and transportation routes, through services that compare satellite and terrestrial usage. This segment strengthens the case for platforms that apply common cost policies across satellite and cellular connections. Non-cellular LPWAN remains important in utility and smart-city systems, where low-power devices require cost-effective connectivity. Semtech expects LoRaWAN deployments to reach 125 million by January 2026. Short-range, local-area, wired, and Ethernet connections also remain relevant when optimization decisions are made at the gateway or site level rather than at each SIM.
By Deployment Model:
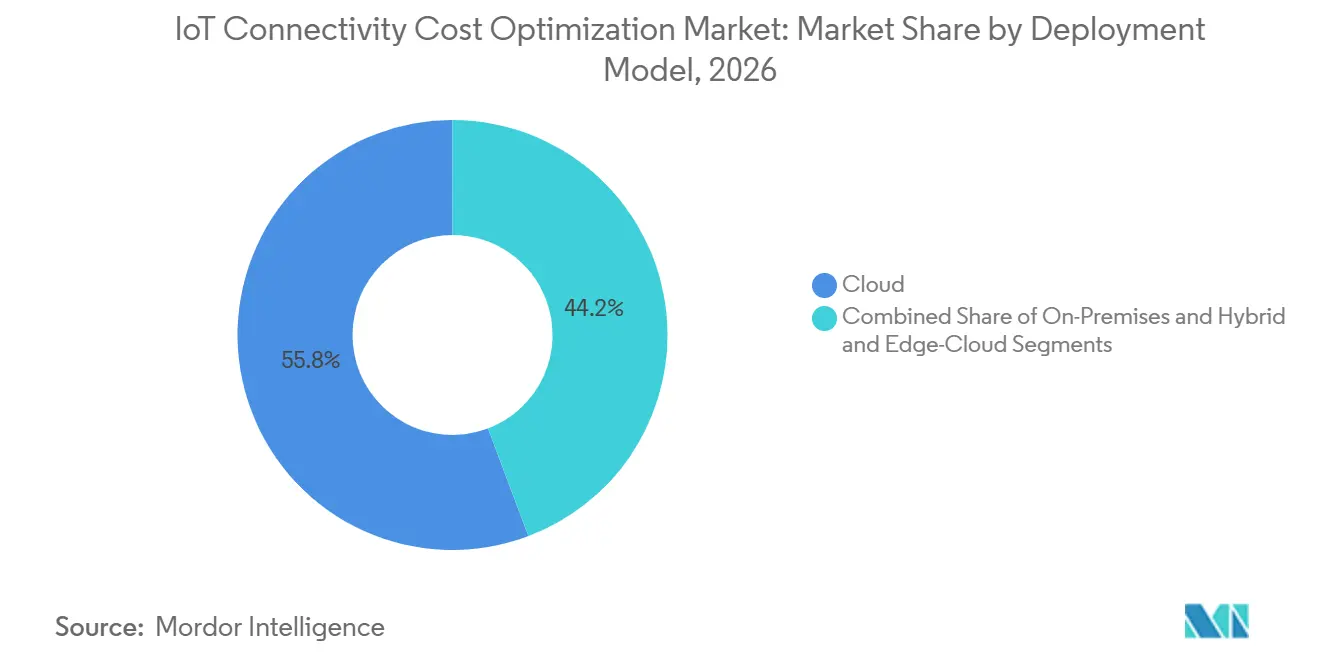
Cloud Leads While Hybrid Models Gain UseCloud deployment is projected to account for 55.76% of revenue in 2026, representing the largest share of the IoT connectivity cost optimization market. SaaS delivery eliminates the need for customers to maintain their own network operations infrastructure. A centralized system can apply SIM policies, monitor usage, and assess carrier performance across dispersed sites. 1NCE expects to manage more than 40 million endpoints for 30,000 customers by January 2026. This operating model can make large-scale connectivity management accessible to mid-sized IoT deployments and larger fleets.
Hybrid and edge-cloud deployment is projected to grow at a 23.78% CAGR through 2032. This model suits industrial environments that require local policy enforcement and very low latency. In February 2026, SoftBank, Murata, and CLPA are expected to report TSN-over-5G synchronization accuracy of 122 nanoseconds. Such technical performance can support manufacturing workflows that cannot depend entirely on remote cloud processing. On-premises systems will retain a role in regulated industries and government operations with strict data-residency requirements.
By Application:
Industrial Automation Leads While Smart Cities AdvanceIndustrial manufacturing and automation are projected to account for 20.17% of revenue in 2026. Factories often connect large numbers of sensors, programmable logic controllers, and automated guided vehicles across multiple sites. This scale makes even small changes in data-plan costs significant when applied across an entire fleet. Samsung and Hyundai Motor Company are expected to complete a private 5G RedCap trial in February 2025, demonstrating the use of lower-cost cellular connectivity for automotive production. Energy and utilities, automotive and connected mobility, transportation and logistics, and retail and e-commerce also use the IoT connectivity cost optimization market to manage large device populations and maintain visibility across field locations.
Smart cities and infrastructure are projected to grow at a 24.11% CAGR through 2032. This segment connects public lighting, metering, traffic assets, environmental devices, and other civic systems through a shared connectivity foundation. GSMA’s 2025 Digital Foundations report is expected to outline the role of connected infrastructure in public services and urban systems. Municipal operators require visibility into usage patterns because recurring data charges accumulate across large numbers of public assets. This application also faces heightened procurement scrutiny, as service continuity, security, and budget discipline are closely linked. Cost optimization is therefore becoming an important operational capability for connected infrastructure programs.
Geography Analysis
North America IoT Connectivity Cost Optimization Market
North America is projected to account for 26.87% of revenue in 2026, supported by mature enterprise IoT deployments and a competitive mobile virtual network operator environment. Cisco, AT&T, and Verizon provide a substantial base of carrier-grade platforms and network capabilities in the region. According to ATT.COM, AT&T is expected to acquire EchoStar’s 3.45 GHz spectrum for USD 23 billion in September 2025 and identify IoT and AI-driven connectivity workloads as key use cases. According to ATT.COM, AT&T, T-Mobile, and Verizon are expected to announce an agreement in principle in February 2026 for a joint venture to address wireless dead zones through spectrum pooling and satellite integration. These developments could reduce the cost premium associated with rural and remote IoT coverage.
Europe and APAC IoT Connectivity Cost Optimization Market
Europe plays a significant role in the IoT connectivity cost optimization market, as Germany, the United Kingdom, and France generate substantial industrial IoT demand. Data protection requirements also support demand for platforms that offer data-residency routing and auditable controls. The regional 3G shutdown cycle is prompting organizations to modernize device connectivity and reassess carrier contracts. Asia-Pacific combines mature, high-volume markets with countries that continue to expand utility and urban connectivity programs. According to ERICSSON.COM, North East Asia is expected to account for 70% of global cellular IoT connections by the end of 2025. India, South Korea, and Australia are also generating demand through smart metering and urban digitalization programs.
MEA and South America IoT Connectivity Cost Optimization Market
Within the IoT connectivity cost optimization market, the Middle East is projected to expand at a CAGR of 24.32% through 2032. GCC investments in 5G and smart-city programs in Saudi Arabia and the United Arab Emirates are expected to support enterprise adoption. According to GSMA.COM, 86% of MENA operators are projected to offer IoT services in 2025, while NOKIA forecasts that 5G will account for 91% of GCC connections by 2030. South America and Africa remain earlier-stage regions, where platform providers face growth opportunities alongside tariff, infrastructure, and regulatory constraints.
Competitive Landscape
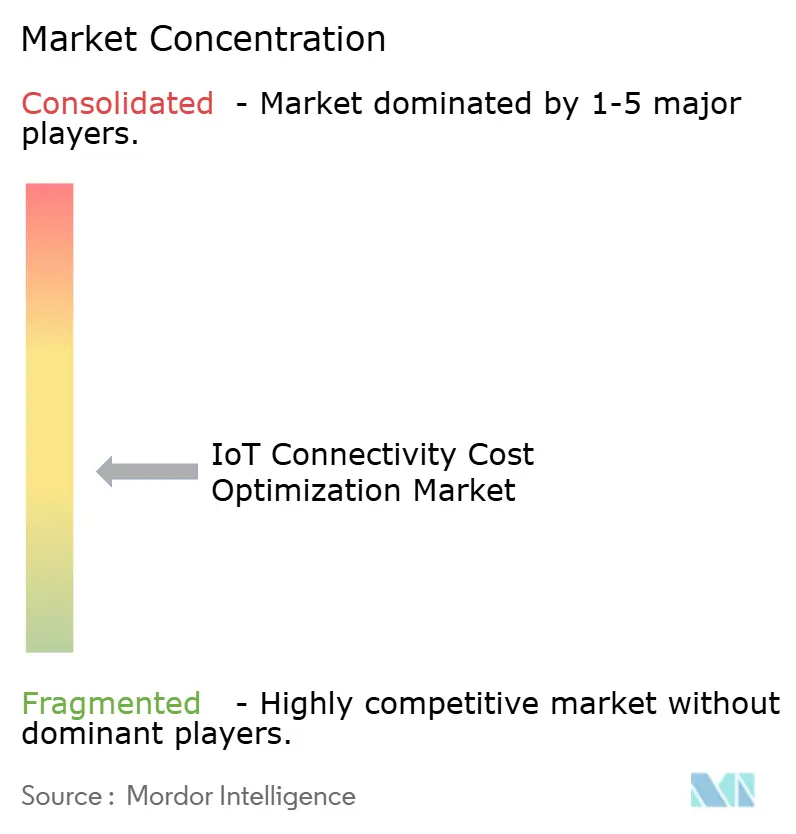
The IoT connectivity cost optimization market is moderately fragmented. Cisco, Vodafone Group, Verizon, AT&T, and Telefónica compete through extensive network reach, large installed bases, and broad platform portfolios. KORE Group Holdings, 1NCE, emnify, Soracom, and Eseye compete through eSIM orchestration, flexible pricing, and cloud-native architectures. The market presents significant opportunities among enterprises managing 50,000 to 2 million connections, as these organizations require material cost savings but may not align with the commercial models of the largest platforms. According to IRIDIUM.COM, Vodafone IoT manages more than 215 million connected devices across 180 countries and maintains more than 760 network partnerships, demonstrating the scale available to established global providers.
Competition in the IoT connectivity cost optimization market increasingly depends on the breadth of carrier partnerships, eSIM profile management capabilities, and the quality of usage analytics. Providers that support GSMA SGP.32 requirements and data-residency controls are better positioned to serve regulated cross-border deployments. According to CISCO.COM, Cisco and Tata Communications are expected to combine their platforms in September 2025 to support broader eSIM orchestration and cross-carrier management. According to IRIDIUM.COM, Vodafone IoT and Iridium are expected to announce a partnership in November 2025 to add NTN Direct, 3GPP-compliant NB-IoT, and satellite connectivity to Vodafone IoT’s portfolio. According to SORACOM.IO, Soracom is expected to make its Skylo satellite integration generally available in October 2025, enabling standard cellular devices to connect to satellite networks via 3GPP-compliant non-terrestrial networks.
According to KOREWIRELESS.COM, KORE and Kigen are expected to announce SGP.32-compliant IoT connectivity solutions in April 2026, targeting devices ranging from high-power gateways to battery-powered sensors. According to SEMTECH.COM, Semtech’s LoRa software and multi-protocol connectivity capabilities support low-power deployments. Providers in the IoT connectivity cost optimization market must combine predictable pricing with reliable technical support as customers deploy cellular, LPWAN, and satellite connections. Market concentration remains moderate because established telecommunications groups possess global scale, while specialist providers retain significant opportunities in targeted deployments. The available evidence does not provide the combined market share of leading players; therefore, a market concentration score cannot be assigned.
IoT Connectivity Cost Optimization Industry Leaders
-
Cisco Systems, Inc.
-
Verizon Communications Inc.
-
AT&T Inc.
-
Vodafone Group Plc
-
Telefónica, S.A.
- *Disclaimer: Major Players sorted in no particular order
IoT Connectivity Cost Optimization Market Companies Covered in this Report
- Cisco Systems, Inc.
- Verizon Communications Inc.
- AT&T Inc.
- Vodafone Group Plc
- Telefónica, S.A.
- KORE Group Holdings, Inc.
- 1NCE GmbH
- Aeris Communications, Inc.
- Eseye Limited
- Wireless Logic Group Limited
- emnify GmbH
- Soracom, Inc.
- floLIVE Ltd.
- Comarch S.A.
- Tata Communications Limited
- Nokia Corporation
- Ericsson AB
- Huawei Technologies Co., Ltd.
- Telit Cinterion
- Transatel S.A.
- BICS SA
- Giesecke+Devrient GmbH
- Semtech Corporation
Recent Industry Developments in IoT Connectivity Cost Optimization Market
- April 2026: KORE Group Holdings and Arm's Kigen announced a portfolio of SGP.32-compliant IoT connectivity solutions, with commercial availability planned for later in 2026, supporting devices from high-power gateways to battery-powered sensors with streamlined global roaming and multi-network resilience.
- April 2026: Soracom and EdgeBeam Wireless announced a strategic partnership combining Soracom's 4G/5G global cellular platform with EdgeBeam's ATSC 3.0-powered broadcast data distribution, enabling cost-efficient one-to-many IoT data transmissions for last-mile deployments.
- March 2026: Semtech announced that its LoRa technology will serve as the core radio modulation for Amazon Sidewalk's international expansion, beginning in Canada and Mexico. Amazon Sidewalk covers approximately 95% of the US population and will extend license-free LPWAN connectivity globally through 2026.
- February 2026: AT&T, T-Mobile, and Verizon announced an agreement in principle to form a new joint venture to eliminate wireless dead zones in the US by pooling spectrum and integrating satellite connectivity, directly expanding terrestrial coverage for IoT fleet operators in remote and rural geographies.
Global IoT Connectivity Cost Optimization Market Report Scope
The IoT Connectivity Cost Optimization Market Report is Segmented by Offering (Connectivity Cost Optimization Platforms, Managed Connectivity Optimization Services, Professional Services [Consulting and Assessment, Implementation and Integration, and Support and Maintenance]), Connectivity Technology (Cellular Connectivity, Non-Cellular LPWAN, Short-Range and Local-Area Connectivity, Satellite and Non-Terrestrial Connectivity, and Wired and Ethernet Connectivity), Deployment (Cloud, On-Premises, and Hybrid and Edge-Cloud), Application (Automotive and Connected Mobility, Transportation and Logistics, Industrial Manufacturing and Automation, Energy and Utilities, Smart Cities and Infrastructure, Retail and E-Commerce, and Other IoT Applications), and Geography. The Market Forecasts are Provided in Value (USD).
Segmentation Overview
| Connectivity Cost Optimization Platforms | |
| Managed Connectivity Optimization Services | |
| Professional Services | Consulting and Assessment |
| Implementation and Integration | |
| Support and Maintenance |
| Cellular Connectivity |
| Non-Cellular LPWAN |
| Short-Range and Local-Area Connectivity |
| Satellite and Non-Terrestrial Connectivity |
| Wired and Ethernet Connectivity |
| Cloud |
| On-Premises |
| Hybrid and Edge-Cloud |
| Automotive and Connected Mobility |
| Transportation and Logistics |
| Industrial Manufacturing and Automation |
| Energy and Utilities |
| Smart Cities and Infrastructure |
| Retail and E-Commerce |
| Other IoT Applications |
| North America | United States |
| Canada | |
| Mexico | |
| South America | Brazil |
| Argentina | |
| Rest of South America | |
| Europe | Germany |
| United Kingdom | |
| France | |
| Italy | |
| Spain | |
| Rest of Europe | |
| Asia-Pacific | China |
| Japan | |
| India | |
| South Korea | |
| Australia | |
| Rest of Asia-Pacific | |
| Middle East | Saudi Arabia |
| United Arab Emirates | |
| Rest of Middle East | |
| Africa | South Africa |
| Nigeria | |
| Rest of Africa |
| By Offering | Connectivity Cost Optimization Platforms | |
| Managed Connectivity Optimization Services | ||
| Professional Services | Consulting and Assessment | |
| Implementation and Integration | ||
| Support and Maintenance | ||
| By Connectivity Technology | Cellular Connectivity | |
| Non-Cellular LPWAN | ||
| Short-Range and Local-Area Connectivity | ||
| Satellite and Non-Terrestrial Connectivity | ||
| Wired and Ethernet Connectivity | ||
| By Deployment Model | Cloud | |
| On-Premises | ||
| Hybrid and Edge-Cloud | ||
| By Application | Automotive and Connected Mobility | |
| Transportation and Logistics | ||
| Industrial Manufacturing and Automation | ||
| Energy and Utilities | ||
| Smart Cities and Infrastructure | ||
| Retail and E-Commerce | ||
| Other IoT Applications | ||
| By Geography | North America | United States |
| Canada | ||
| Mexico | ||
| South America | Brazil | |
| Argentina | ||
| Rest of South America | ||
| Europe | Germany | |
| United Kingdom | ||
| France | ||
| Italy | ||
| Spain | ||
| Rest of Europe | ||
| Asia-Pacific | China | |
| Japan | ||
| India | ||
| South Korea | ||
| Australia | ||
| Rest of Asia-Pacific | ||
| Middle East | Saudi Arabia | |
| United Arab Emirates | ||
| Rest of Middle East | ||
| Africa | South Africa | |
| Nigeria | ||
| Rest of Africa | ||
Key Questions Answered in the Report
What is the IoT connectivity cost optimization market size?
The IoT connectivity cost optimization market is valued at USD 0.57 billion in 2026 and is projected to reach USD 1.94 billion by 2032, at a 22.97% CAGR from 2027 to 2032.
Which offering leads the IoT connectivity cost optimization market?
Connectivity cost optimization platforms lead with a 41.12% share in 2026, while managed connectivity optimization services are projected to expand at a 23.44% CAGR through 2032.
Why do enterprises use connectivity cost optimization platforms?
Enterprises use these platforms to monitor data usage, manage carrier plans, apply policies, and control charges across large or multi-network device fleets.
Which connectivity technology is expanding fastest?
Satellite and non-terrestrial connectivity is projected to grow at a 24.66% CAGR through 2032, as remote deployments require coverage beyond terrestrial networks.
Which application has the strongest projected expansion?
Smart cities and infrastructure is projected to advance at a 24.11% CAGR through 2032 as municipalities manage growing fleets of connected public assets.
Which region is projected to expand fastest?
The Middle East is projected to expand at a 24.32% CAGR through 2032, supported by GCC 5G investment and smart-city programs.