
Market Overview
| Study Period | 2021 - 2031 |
|---|---|
| Market Size (2026) | USD 153.85 Billion |
| Market Size (2031) | USD 204.23 Billion |
| Growth Rate (2026 - 2031) | 5.83 % |
| Fastest Growing Market | Middle East and Africa |
| Largest Market | Asia Pacific |
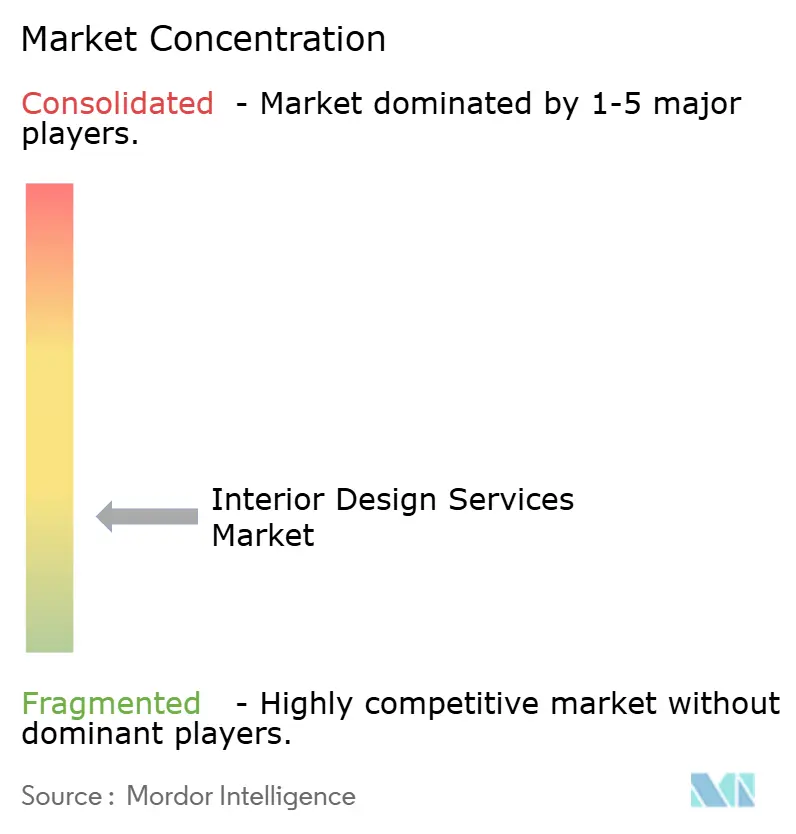
| Market Concentration | Low |
Major Players *Disclaimer: Major Players sorted in no particular order Image © Mordor Intelligence. Reuse requires attribution under CC BY 4.0. | |
Interior Design Services Market Analysis by Mordor Intelligence
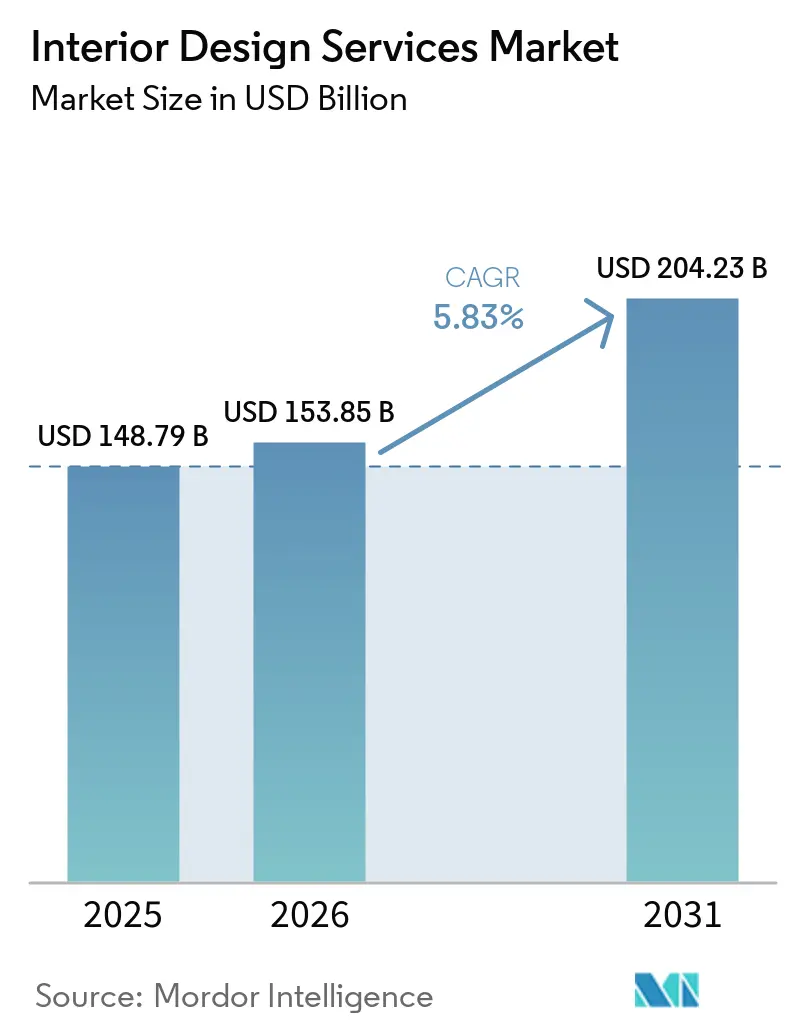
The Interior Design Services Market size is USD 153.85 billion in 2026 and is forecast to reach USD 204.23 billion by 2031 at a CAGR of 5.83%. The interior design services market is being shaped by durable demand for renovation in mature economies and steady new-build activity in fast-growing urban hubs, with hybrid work policies now codified at most large organizations and driving adaptive layouts that blend collaboration with privacy. Wellness-forward specifications and third-party certifications are moving into mainstream programs as owners seek health, productivity, and ESG outcomes that can be validated and reported. Generative AI is shortening concept-to-approval cycles and expanding visualization options, which supports mass personalization at mid-range budgets while also boosting win rates and client experience. Tight labor markets in finishing trades and volatile input costs continue to pressure project budgets and schedules, which favors refurbishment strategies, standardized packages, and supplier partnerships across the interior design services market [1].
Key Report Takeaways
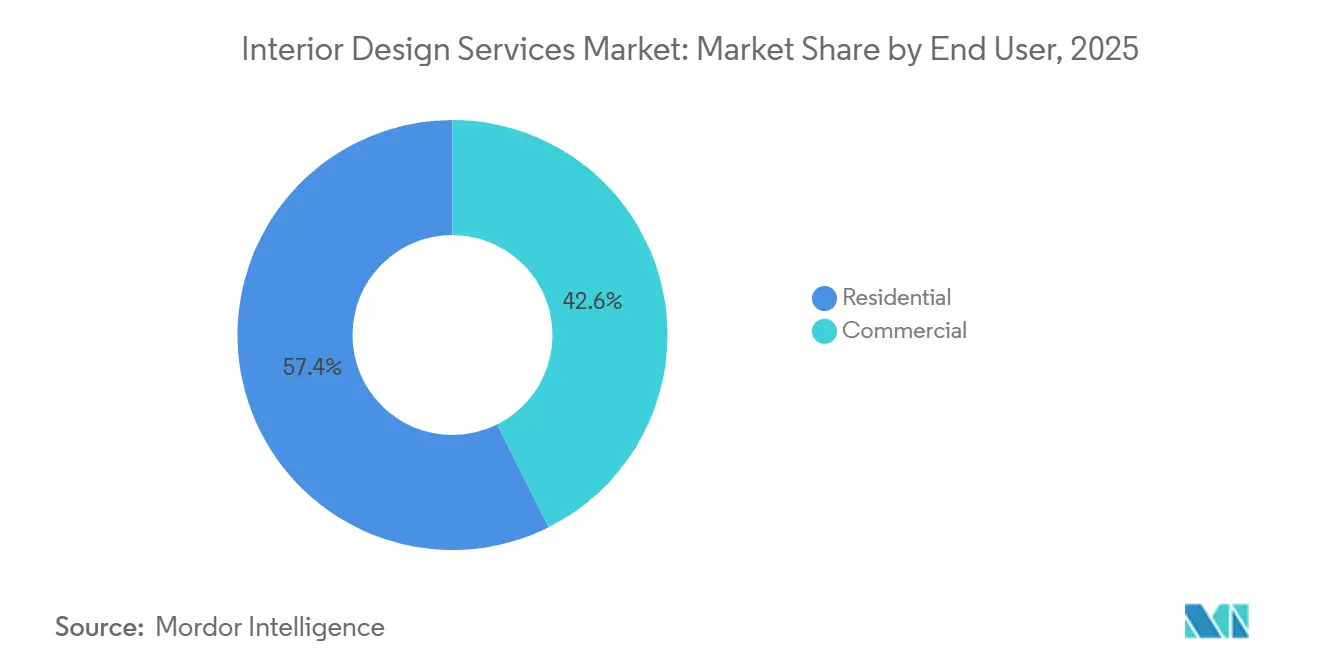
- By end-user, residential accounted for a 57.39% share of the interior design services market size in 2025, while commercial is projected to expand at a 12.26% CAGR through 2031.
- By service type, renovation and remodeling accounted for 47.85% of the interior design services market share in 2025 and are projected to grow at an 11.78% CAGR to 2031.
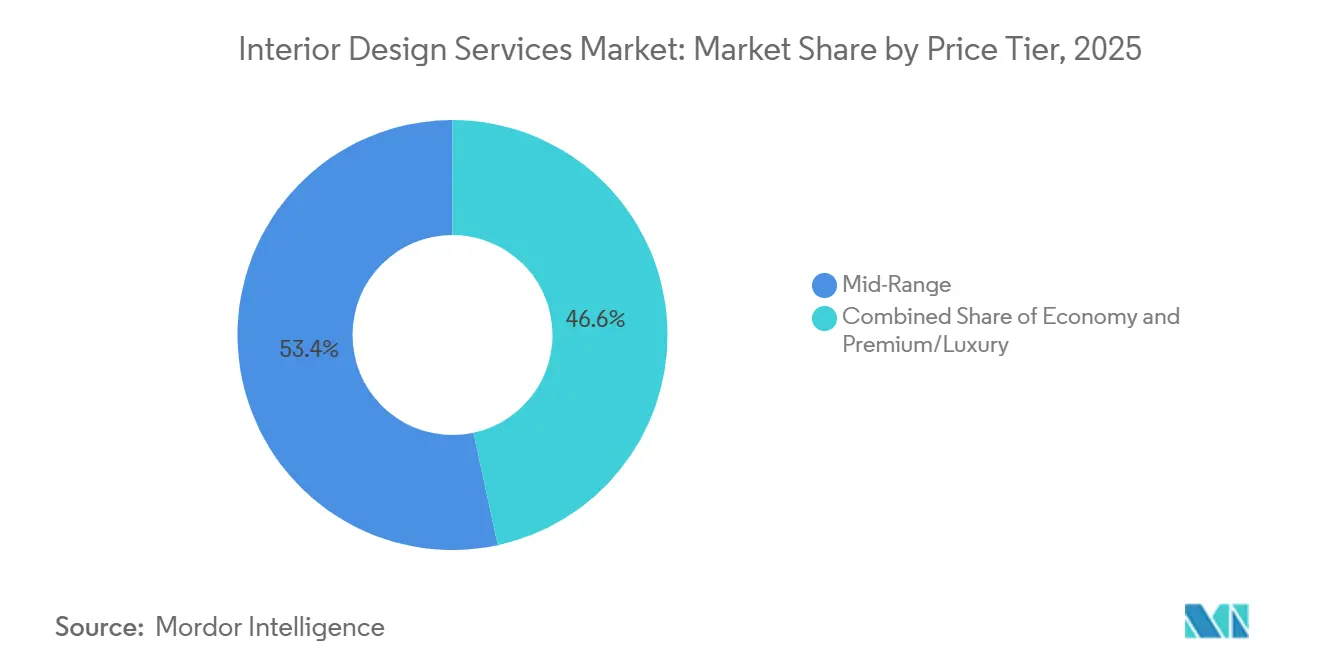
- By price tier, mid-range held 53.37% of the interior design services market share in 2025, while premium and luxury are projected to expand at a 13.84% CAGR through 2031.
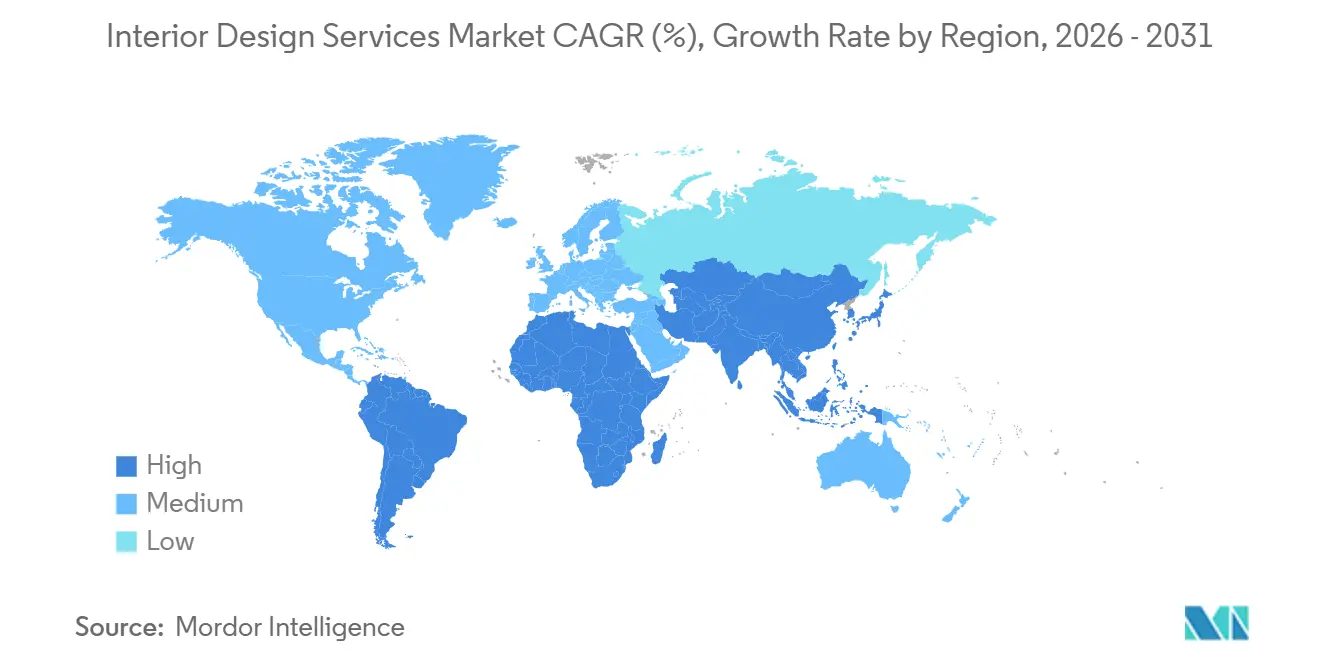
- By geography, Asia-Pacific accounted for 38.39% of the interior design services market share in 2025, while the Middle East and Africa are set for a 17.33% CAGR through 2031.
Note: Market size and forecast figures in this report are generated using Mordor Intelligence’s proprietary estimation framework, updated with the latest available data and insights as of January 2026.
Market Trends and Insights
Drivers Impact Analysis of Interior Design Services Market*
| Driver | (~) % Impact on CAGR Forecast | Geographic Relevance | Impact Timeline |
|---|---|---|---|
| Post-pandemic hybrid working spurs commercial re-layouts | +1.2% | Global, strongest in North America and Europe | Medium term (2-4 years) |
| Rapid urban condo construction in Tier-2 Asian cities | +0.9% | Asia-Pacific core, spillover to Middle East & Africa | Long term (≥ 4 years) |
| Surge in wellness-oriented interior materials | +0.8% | Global, premium segments in Asia-Pacific, North America, Middle East & Africa | Medium term (2-4 years) |
| Generative-AI-driven design visualization tools | +0.6% | Global, early gains in North America, Europe, select Asia-Pacific metros | Short term (≤ 2 years) |
| ESG-linked green-building certifications | +1.1% | Global, the strongest regulatory push in Europe, and broad corporate adoption | Medium term (2-4 years) |
| Ultra-high-net-worth migration to tax-friendly hubs | +1.0% | Concentrated in the UAE and Singapore, with select Mediterranean and North American cities | Long term (≥ 4 years) |
| Source: Mordor Intelligence | |||
Post-Pandemic Hybrid Working Spurs Commercial Re-Layouts
Hybrid work moved from experiment to expectation in 2025, with many companies operating formal hybrid programs and employees averaging 2.9 days on-site each week. These policies are reshaping project briefs as employers target commute-worthy spaces that balance collaboration with individual focus in the same footprint. Office utilization remains structurally below pre-pandemic norms, which pushes landlords to differentiate with amenity-rich interiors and ready-to-lease spec suites as employers right-size locations and seek flexible layouts [2]. Quiet zones, enclosed rooms, and privacy-first planning have renewed importance as workers return on defined days, supported by smart pods and noise control to support deep work. Portfolio decisions now emphasize elasticity over expansion, which supports retrofit programs that can be delivered in phases and validated against engagement, utilization, and wellness metrics. These shifts reinforce demand for adaptive design packages across the interior design services market as employers and owners steer toward continuous improvement rather than one-off fit-outs.
Surge in Wellness-Oriented Interior Materials
Wellness has become integral to interior specifications, extending from premium to mid-range projects as owners link design choices to health, productivity, and tenant experience. The WELL Building Standard has expanded its global footprint to projects covering billions of square feet, underlining the momentum behind evidence-based approaches to air, water, light, acoustics, and materials. Designers are deploying biophilic strategies, acoustic wellness, and circular materials to reduce stressors and improve comfort, with suppliers advancing absorptive surfaces, low-VOC finishes, and renewable content lines [3]. Owners favor third-party certifications where benefits can be benchmarked, reported, and tied to leasing or valuation outcomes, which directs budgets toward smart metering and performance features. Wellness-aligned offerings are translating into repeatable design kits for the interior design services market as owners seek scale, consistency, and measurable returns across portfolios. This steady shift supports premium pricing for health-centered assets while reinforcing mid-market demand for accessible wellness upgrades.
Generative-AI-Driven Design Visualization Tools
Generative AI has moved into everyday workflows, compressing concept development and enabling clients to explore more options before committing to detailed design. Firms report active pilots and broader adoption of AI-enabled visualization, content generation, and feasibility modeling, supported by rapid advances in the tool ecosystem. Digital twin and scanning technologies now automate documentation and lower preconstruction costs, with reported planning cost reductions of up to 75% in complex environments when AI-enabled scanning is deployed [4]. As embedded analytics progress, layouts can be optimized for utilization, energy, and comfort, creating feedback loops that justify continuous updates and phased refreshes. The near-term impact is higher decision speed and stronger client engagement, which can improve win rates and margins on visualization-heavy scopes. Over time, AI will push standardized yet personalized packages that scale across the interior design services market as owners balance speed, quality, and cost.
ESG-Linked Green-Building Certifications
ESG is now embedded in design briefs as owners aim to decarbonize portfolios and improve occupant outcomes with transparent reporting. Certification frameworks such as LEED and WELL guide specification choices for energy, materials, and well-being, and are increasingly used to document and communicate performance. Corporate tenants and investors favor frameworks that support comparable disclosures, which encourage dual pathways and smart building technologies to measure progress. Enhanced performance and verified outcomes can support rent and valuation resilience in competitive markets, which elevates ESG features from optional extras to requirements in many tenders. This shift to verifiable performance underpins consistent demand across the interior design services market as owners seek to future-proof assets and reduce compliance and obsolescence risk. The adoption of credible frameworks also creates capability moats for firms with trained teams and audit-ready documentation.
Restraints Impact Analysis of Interior Design Services Market*
| Restraint | (~) % Impact on CAGR Forecast | Geographic Relevance | Impact Timeline |
|---|---|---|---|
| Skilled labor shortages in finishing trades | -1.1% | Global, acute in North America, Europe, select Asia-Pacific metros | Long term (≥ 4 years) |
| Volatility in key material costs (timber, steel) | -0.9% | Global tariff amplification in North America | Medium term (2-4 years) |
| Rising interest rates are dampening home upgrades | -0.7% | Global, most pronounced in North America and Europe | Short term (≤ 2 years) |
| Regulatory delays on heritage-property refurbishments | -0.4% | Concentrated in North America and Europe's historic districts | Medium term (2-4 years) |
| Source: Mordor Intelligence | |||
Skilled-Labor Shortages in Finishing Trades
Contractors continue to report difficulty hiring qualified tradespeople, which delays timelines and raises soft and hard costs for interiors. The United States requires an estimated 439,000 net new construction workers in 2025 to meet demand, and a large majority of firms report open craft positions that are hard to fill. Labor scarcity is acute in finishing trades such as carpentry, drywall, electrical, and HVAC, which are critical to interior schedules and often determine the path to occupancy. Wage inflation and subcontractor availability have become decisive schedule risks, driving owners to pre-negotiate capacity and to phase scopes to secure teams. Large infrastructure, manufacturing, and data center programs absorb significant local labor pools and can crowd out smaller interior projects, which forces price escalation and sequencing changes. The interior design services market adapts to these constraints with more standardization, off-site fabrication, and early trade engagement to reduce friction at installation.
Volatility in Key Material Costs (Timber, Steel)
Input costs for metals and building systems remained volatile in 2025, with trade policy shifts and supply constraints influencing procurement strategies. Tariff adjustments elevated prices in several categories, and contractors reported continued pressures across metals, electrical gear, and mechanical equipment as supply chains rebalanced. Owners and designers mitigated risk through early buys, alternates, and value engineering, which together aim to protect the scope while keeping projects on track. Logistics improved in some corridors, yet trucking capacity, port conditions, and lead times remained inconsistent, which complicates delivery sequencing on fast-track interiors. In this context, finish selections emphasize availability, local sourcing, and circular content where quality and supply can be verified. These pressures accelerate the shift toward templated material palettes in the interior design services market to keep budgets predictable and schedules reliable.
*Our forecasts treat driver/restraint impacts as directional, not additive. The impact forecasts reflect baseline growth, mix effects, and variable interactions.
Interior Design Services Market Segment Analysis
By End-User:
Commercial Adoption Outpaces Residential BaselineResidential design captured 57.39% share in 2025, while commercial is the fastest-growing end-user with a projected 12.26% CAGR to 2031, reflecting the enforcement of hybrid work policies and the need to elevate in-person experience. Corporate programs now require a mix of collaboration spaces and privacy-first areas, which directs spending toward flexible layouts, acoustic solutions, and integrated technology as employers calibrate attendance policies. Portfolio planning prioritizes elasticity and speed of change, which supports phased upgrades and adaptive reuse over large static fit-outs in the interior design services market. These dynamics align with the broader retrofit cycle underway in older buildings, where targeted upgrades and wellness features reset asset positioning. Residential demand remains broad due to the installed base of homes and sustained equity, even as transaction volumes face headwinds in some markets.
Commercial interior programs increasingly link design to measurable outcomes such as utilization, engagement, and health metrics, which drives uptake of amenity zones, meeting suites, and standardized focus pods. Landlords position amenity-rich spec suites to accelerate leasing in competitive submarkets, a trend that favors repeatable packages across the interior design services market. In parallel, residential clients continue to invest in kitchens, baths, and multi-functional rooms that support work and wellness without relocation. As project briefs converge on flexibility and day-to-day well-being, suppliers and studios embed wellness and ESG features into mainstream offerings for both end-users. Taken together, the interior design services industry is balancing residential volume with accelerating commercial upgrades that seek to capture the return-to-office moment.
By Service Type:
Renovation Anchors Volume While Sustaining High GrowthRenovation and remodeling accounted for a 47.85% share in 2025 and hold the highest projected growth at an 11.78% CAGR through 2031, a profile supported by owners who prefer to optimize existing space rather than pursue ground-up construction in volatile cost environments. Homeowners are positioned to fund improvements through increased refinance activity in 2026, which can channel equity toward interiors when move decisions are delayed. Corporate occupiers also redirect resources into quality-of-space improvements as they consolidate locations and target attendance lift on anchor days. In response, designers offer templated playbooks and wellness-aligned upgrades that shorten lead times and limit change orders across the interior design services market.
New construction remains relevant where performance goals require modern shells, such as healthcare, logistics, or specialized corporate facilities. However, materials volatility, labor scarcity, and permitting complexity add risk to ground-up schedules, which lifts the appeal of retrofit strategies that can be phased and measured. As hybrid work stabilizes, value-add programs converge on flexible infrastructures, integrated technology, and smart building systems that inform continuous improvement cycles. This balance positions renovation to command both the largest share and sustained growth within the interior design services industry through the forecast horizon.
By Price Tier:
Luxury Surges as Mid-Range Anchors VolumeMid-range captured 53.37% share in 2025 and serves the broadest base of residential and commercial clients, while premium and luxury lead growth with a projected 13.84% CAGR, supported by wealth migration and branded residence pipelines that prioritize experiential quality. Branded residences have expanded globally and command notable price premiums in major hubs where lifestyle services, wellness suites, and concierge programs carry weight in purchase decisions. Developers in key destinations align interiors with hospitality standards and wellness certifications to differentiate and protect asset values. This demand anchors high-spec packages across the interior design services market and lifts adjacent categories such as specialty lighting and acoustics.
Mid-range growth reflects the ongoing democratization of design, where AI visualization and supplier ecosystems make personalization affordable and fast. Standardized modules and curated finish libraries help control costs and lead times without reducing perceived quality. Designers combine these elements with wellness features, low-VOC materials, and efficient lighting to help clients achieve practical ESG outcomes. This approach scales across residential and commercial scopes and underpins steady volume in the interior design services market as budgets seek maximum value. At the top tier, wealth hubs and trophy assets continue to pull high-spec interiors, which reinforces the premium growth profile over the forecast period.

Geography Analysis
APAC Interior Design Services Market
Asia-Pacific accounted for 38.39% of the interior design services market share in 2025, anchored by urban condominium activity in India and stable spending on household durables in China. Ongoing infrastructure and consumption programs support project pipelines, while global occupiers seek quality upgrades and flexible layouts in regional hubs. Policy support in China has helped underpin demand for household durables and select categories of home improvement, even as the property sector adjusts, which supports interior activity in priority cities. Multinational tenants continue to prioritize ESG-aligned amenities and wellness features across new and existing space, which elevates certified interiors in major business districts.
North America and MEA Interior Design Services Market
The Middle East and Africa are set for the fastest growth at a projected 17.33% CAGR through 2031 as large national programs and sustained wealth inflows create high-spec residential and mixed-use demand. The UAE remains a leading magnet for entrepreneurial and financial capital, which translates into steady pipelines of branded residences and lifestyle-driven interiors. Saudi Arabia’s transformation agenda supports multi-year investment in civic, hospitality, and cultural assets where interior quality is central to placemaking and guest experience. Across North America, hybrid work retrofits and amenity-rich repositioning support interior demand in major cities, even as total office footprints evolve to match attendance patterns. Owners in the region are also standardizing wellness and ESG features to improve leasing velocity and resilience.
Europe and LATAM Interior Design Services Market
Europe is advancing large-scale retrofit programs to reduce obsolescence risk in older office stock and to align with decarbonization targets, which supports sustained demand for certified interior upgrades. Wealth migration patterns within and into Europe continue to influence high-end residential projects in safe-haven and lifestyle locations, with developers integrating hospitality-grade amenities and wellness features. In Latin America, innovative demonstration sites are showcasing low-carbon materials, on-site energy generation, and circular practices that filter into commercial interiors over time. These regional patterns reinforce the broad footprint of the interior design services market while highlighting the outperformance potential of certified, wellness-forward, and tech-enabled interiors in major hubs.
Regulatory Landscape
Interior design services regulation remains fragmented globally, with requirements for qualifications, scope of practice, and cross-border delivery varying by jurisdiction. In the United States, a patchwork of practice acts and title or registration regimes persists across states. Florida is an example of structured oversight through boards that regulate architecture and interior design and restrict certain life-safety-related activities to qualified license holders.
A notable policy signal for 2025 to 2026 is California AB-1796 (2025-2026 session), which proposes shifting from a certification-based framework to a licensure-based practice act, with an implementation date proposed for July 1, 2028. This also raises compliance monitoring needs for firms operating across multiple states. In March 2026, the Interorganizational Council on Regulation (ICOR), with participation from bodies such as NCEES, CLARB, CIDQ, and NCARB, issued guidance on overlapping practice across design and engineering disciplines, supporting clearer delineation and procurement documentation for multidisciplinary teams. Outside North America, some country-level regimes are more prescriptive; the Philippines, for example, regulates interior design under Republic Act No. 10350, including provisions that require foreign interior designers to collaborate with licensed local professionals. For cross-border services, trade frameworks under the WTO General Agreement on Trade in Services (GATS) intersect with local licensing, legal-entity, and market-access constraints, which adds another layer of diligence for global delivery models.
Value Chain Analysis
The interior design services value chain typically moves from client discovery and programming (brief, budget, and performance targets) through conceptual and schematic design, design development, construction documentation, procurement, and site implementation, followed by close-out and post-occupancy tuning. Increasingly, delivery is tied to measurable outcomes, including wellness and ESG reporting, which expands documentation workloads such as material attributes, low-VOC specifications, and certification-ready evidence. It also tightens coordination with architects, MEP engineers, and general contractors earlier in the process.
Downstream, procurement and fulfillment connect designers with furniture and fixture manufacturers, lighting and surface suppliers, specialty fabricators, and logistics providers that consolidate multi-vendor shipments for phased installation. To limit schedule risk tied to labor constraints and volatile input costs, firms and owners are leaning toward nearer-sourcing, prefabrication, and controlled production partnerships, including integrated contracting or in-house manufacturing models that improve quality control and reduce site rework. Manufacturing consolidation hubs, including export-oriented clusters such as Foshan in China, remain important aggregation points for multi-category interior packages. Tighter shop-drawing discipline and early trade engagement are also used to prevent costly errors during on-site execution.
Competitive Landscape
Competition is broad and diverse, with global multi-disciplinary studios, regional specialists, and integrated engineering and construction providers all active in interior scopes. Clients increasingly select partners on the basis of workplace strategy, performance reporting, and data-driven design that links brief to outcomes, which shifts bidding from transactional to strategic. Certification fluency and supplier depth are now critical capabilities as owners embed health and sustainability targets in program requirements across the interior design services market. This landscape rewards firms that can handle visualization at scale, document ESG performance, and deliver predictable schedules despite labor and material constraints.
Strategic vectors converge on four themes. First, geographic expansion into wealth hubs and growth corridors enables firms to follow client capital and deliver premium interiors with hospitality-grade experiences. Second, vertical integration and alliances help reduce delivery risk and create single-accountability models that are attractive to institutional owners. Third, specialization in wellness-certified workplaces, branded residences, and adaptive reuse aligns with secular demand and supports premium fees. Fourth, technology leadership matters more each year as generative AI, digital twins, and automated documentation help compress timelines and improve accuracy in the interior design services market.
Tool-enabled differentiation is growing clearer. Designers and owners now iterate more options up front, test occupancy or wellness goals in simulation, and validate decisions with data during and after fit-out. AI-driven scanning and photorealistic rendering reduce site time and speed approvals, while digital twins support continuous tuning of lighting, HVAC, and space allocation, which converts one-off scopes into ongoing service relationships. Sustainability credentials serve as capability moats where procurement requires audited processes, trained staff, and third-party documentation that not every studio can provide. Regulatory knowledge is also a differentiator as firms navigate permitting frameworks that can add months to schedules for historic properties or sensitive sites. In combination, these assets position well-resourced and technology-forward teams to compete effectively across the interior design services market.
Interior Design Services Industry Leaders
-
Gensler
-
Perkins and Will
-
AECOM
-
Hirsch Bedner Associates
-
HOK
- *Disclaimer: Major Players sorted in no particular order
Interior Design Services Market Companies Covered in this Report
- Gensler
- HOK
- Perkins & Will
- AECOM
- IA Interior Architects
- Hirsch Bedner Associates (HBA)
- Stantec
- Jacobs
- CallisonRTKL
- Foster + Partners
- DP Design
- Leo A Daly
- NBBJ
- Skidmore, Owings & Merrill (SOM)
- Studio O+A
- Yabu Pushelberg
- Wilson Associates
- M Moser Associates
- HKS Architects
- Kimball International
Market Opportunities and Future Outlook
A growing opportunity sits in compliance-led, data-rich interiors where clients need traceability and verifiable performance, not just aesthetic outcomes. In Europe, the Energy Performance of Buildings Directive (EU) 2024/1275 (recast) and the Ecodesign for Sustainable Products Regulation (EU) 2024/1781 raise the bar for energy and product sustainability considerations. That shift pushes interior teams toward structured product evidence, such as Environmental Product Declarations, and more disciplined procurement files that can support audits and portfolio reporting. It also creates room for design firms to package certification fluency (LEED, WELL) with materials documentation workflows, supplier vetting, and handover deliverables that owners can reuse across multi-site programs.
Technology-enabled service models also create differentiation opportunities in mid-range renovation and fast-cycle commercial refreshes, where speed-to-decision and optioning breadth support higher conversion. ASIDs 2026 Trends Outlook points to rising energy demand and the spread of smart systems and AI-enabled devices, which increases the need for interior design teams to incorporate basic energy literacy, load implications, and coordination with building systems into standard scopes. In parallel, reported AI adoption among interior designers reached 29% in 2025, supporting opportunities for firms to productize AI-assisted visualization and specification support that shorten concept-to-approval cycles while keeping budget control and documentation consistency, particularly for renovation-heavy demand.
Recent Industry Developments in Interior Design Services Market
- July 2026: Gensler announced a partnership with IPark Hyundai Development tied to the Gwangmyeong Haan Jugong 6 and 7 reconstruction project in South Korea. The collaboration aligns design delivery with a large-scale redevelopment program, expanding the pipeline for integrated architecture and interior scopes in a major Asia-Pacific urban market.
- May 2026: Perkins&Will was selected as lead consultant to design the new James Paget Hospital in Great Yarmouth under the UK Governments New Hospital Programme. The award reinforces healthcare as a durable demand pool for complex interior environments where compliance, user experience, and operational performance shape specification and planning depth.
- January 2024: HOK was selected to design AstraZenecas new R&D site in Kendall Square, Cambridge, Massachusetts. The project highlights continued investment in life sciences facilities, where laboratory-adjacent workplaces and amenity interiors require specialized planning, technical coordination, and high-performance material choices.
Interior Design Services Market Report Scope and Research Methodology
Market Definition and Coverage
This market covers paid interior design services delivered for residential and commercial spaces, including concept development, space planning, specification support, and project-level design coordination tied to new builds and renovation work.
Scope exclusions: We exclude revenues from construction contracting and general architectural/engineering services when they are not billed as interior design services.
Segments Covered in This Report
- By End-User
- Residential
- Commercial
- By Service Type
- New Construction
- Renovation / Remodeling
- By Price Tier
- Economy
- Mid-Range
- Premium / Luxury
- By Geography
- North America
- Canada
- United States
- Mexico
- South America
- Brazil
- Peru
- Chile
- Argentina
- Rest of South America
- Europe
- United Kingdom
- Germany
- France
- Spain
- Italy
- BENELUX (Belgium, Netherlands, Luxembourg)
- NORDICS (Denmark, Finland, Iceland, Norway, Sweden)
- Rest of Europe
- Asia-Pacific
- India
- China
- Japan
- Australia
- South Korea
- South East Asia (Singapore, Malaysia, Thailand, Indonesia, Vietnam, Philippines)
- Rest of Asia-Pacific
- Middle East And Africa
- United Arab Emirates
- Saudi Arabia
- South Africa
- Nigeria
- Rest of Middle East And Africa
- North America
Data Sources, Market Sizing, and Validation
Desk Research
Desk research is used to set the market boundary, build the first demand picture, and create check points that can be verified later through interviews. We reviewed public construction and renovation indicators and service-sector output signals, which helps us avoid overstating interior design spend when building activity is softening.
Sources used include public datasets and publications such as the US Census Bureau construction and housing releases, Eurostat construction statistics, the UK Office for National Statistics services output series, the World Bank and IMF macro indicators for inflation and real growth, and trade bodies and standards resources such as ASID and IIDA where publicly available. We also reviewed company filings, investor presentations, major procurement announcements, and reputed press coverage, and then used paid subscriptions for company financials and intelligence, patents, and contract and tenders tracking where it improved coverage. These examples are not exhaustive, and many other sources were also referred to for data collection, validation, and research clarification.
Primary Interviews and Surveys
Primary work is used to pressure-test the desk assumptions and to fill gaps that public sources do not show clearly, such as typical fee structures, project mix shifts, and how quickly pricing changes. Inputs were gathered from interior design studios, design and build coordinators, commercial property stakeholders, and procurement contacts across APAC, EMEA, and the Americas, so the model reflects both mature and high-growth markets.
Distribution of primary research fieldwork respondents
| Company type | Respondent position | Region |
|---|---|---|
| Top tier: 38% | CXOs: 20% | APAC: 49% |
| Mid tier: 40% | Functional/Unit leaders: 34% | EMEA: 29% |
| Smaller Players: 22% | Managers: 46% | Americas: 22% |
Market-Sizing & Forecasting
Sizing starts with a top-down build that links construction and renovation value pools to the portion typically allocated to interior design services, and then applies region-specific conversion assumptions for commercial and residential work. Once the demand pool is shaped, it is further filtered through service adoption levels and average project fee intensity to arrive at market value by region.
To keep the model practical, we used a small set of measurable inputs such as new construction starts, renovation and remodeling activity indicators, commercial real estate completions and refurbishments, building permits and housing turnover signals, and service-price inflation for professional services. These drivers are adjusted using interview feedback on how project sizes are changing, how often clients bundle procurement with design, and where remote or hybrid delivery is lowering time per project. For forecasting, scenario analysis is applied around construction cycles and fee rate movement, and the final growth path is cross-checked against expert expectations by region. Where bottom-up detail is thin, selective roll-ups from sampled studio revenues and typical project counts are used as a reasonableness check, and any gaps are corrected by revisiting adoption and fee assumptions rather than forcing a full supplier census.
Data Validation & Update Cycle
Validation is done by comparing the modeled totals against independent signals like services output trends, construction spending direction, and observed fee inflation, and then checking whether the implied design spend per project stays realistic. Outliers are investigated at the region and end-use level, and if a swing is driven by one assumption, it is reworked and tested again before sign-off.
A second analyst review is completed to confirm definitions, math flow, and consistency of assumptions across chapters. Reports are refreshed annually, and interim updates are triggered when major construction slowdowns, policy changes, or sharp inflation moves are seen in key countries. Before delivery, a final review pass is completed so clients receive the most current view available at that time.
Mordor Intelligence's Interior Design Services Market Size Compared Against Other Published Estimates
Published market sizes for interior design services can look far apart because firms do not always count the same revenue streams, and they also anchor their math to different years and construction cycle assumptions. Differences in whether design-related product procurement is included, how commercial versus residential mixes are treated, and how currency timing is handled can all move the total.
A common gap driver is scope, where some estimates fold in broader fit-out, furniture, and adjacent design and build revenues that are not consistently billed as interior design services alone. Another driver is the base year and price progression logic, since applying aggressive fee inflation uniformly across regions can inflate the number even when project volumes soften. The spread below is largely explained by excluding bundled goods and procurement pass-throughs and by tying the demand pool to construction and renovation indicators that are rechecked through interviews, a choice applied by Mordor Intelligence.
Benchmark comparison
| Source | Market Size | Gaps in Research Methodology |
|---|---|---|
| Mordor Intelligence | USD 153.85 B (2026) | |
| Global Market Publisher A | USD 87.09 B (2025) | Uses a different base year and a narrower value definition that can exclude parts of project-level design coordination, and its market value treatment may not align with how design fees are recognized across regions. |
| Global Research Portal B | USD 52.02 B (2025) | Leans on a smaller measured revenue pool and a shorter service scope that can undercount commercial design work linked to new construction and large refurbishments, especially where projects are contracted through multiple entities. |
Taken together, the comparison shows that year selection, what is counted as service revenue, and whether adjacent fit-out activities are included are the practical reasons the totals differ. Our approach stays traceable because each step is tied to visible construction and renovation signals, and assumptions on fees and adoption are reviewed with industry respondents before the final number is locked.
Key Questions Answered in the Report
What is the interior design services market size in 2026, and how fast is it growing through 2031?
The interior design services market size is USD 153.85 billion in 2026 and is projected to reach USD 204.23 billion by 2031 at a 5.83% CAGR.
Which end-user segment leads and which will grow fastest by 2031?
Residential holds the largest 2025 share at 57.39%, while commercial is projected to be the fastest-growing with a 12.26% CAGR through 2031.
Which service type shows the strongest outlook to 2031?
Renovation and remodeling lead with 47.85% share in 2025 and the highest projected growth at an 11.78% CAGR, supported by retrofit cycles and flexible workplace demand.
What are the top regional dynamics shaping the next phase of growth?
Asia-Pacific leads by 2025 share, while the Middle East and Africa are projected to grow fastest as wealth inflows and national programs lift premium residential and mixed-use interiors.
How is hybrid work influencing interior design priorities for employers?
Codified hybrid policies drive elastic layouts with a balance of collaboration, private focus areas, and wellness amenities that make office visits worthwhile on anchor days.
Where is technology creating the most impact in design workflows today?
Generative AI and digital twins are compressing concept cycles, cutting documentation costs, and enabling data-driven refinements that extend interior value after occupancy.