Intellectual Property Management Software Market Size and Share
Market Overview
| Study Period | 2020 - 2031 |
|---|---|
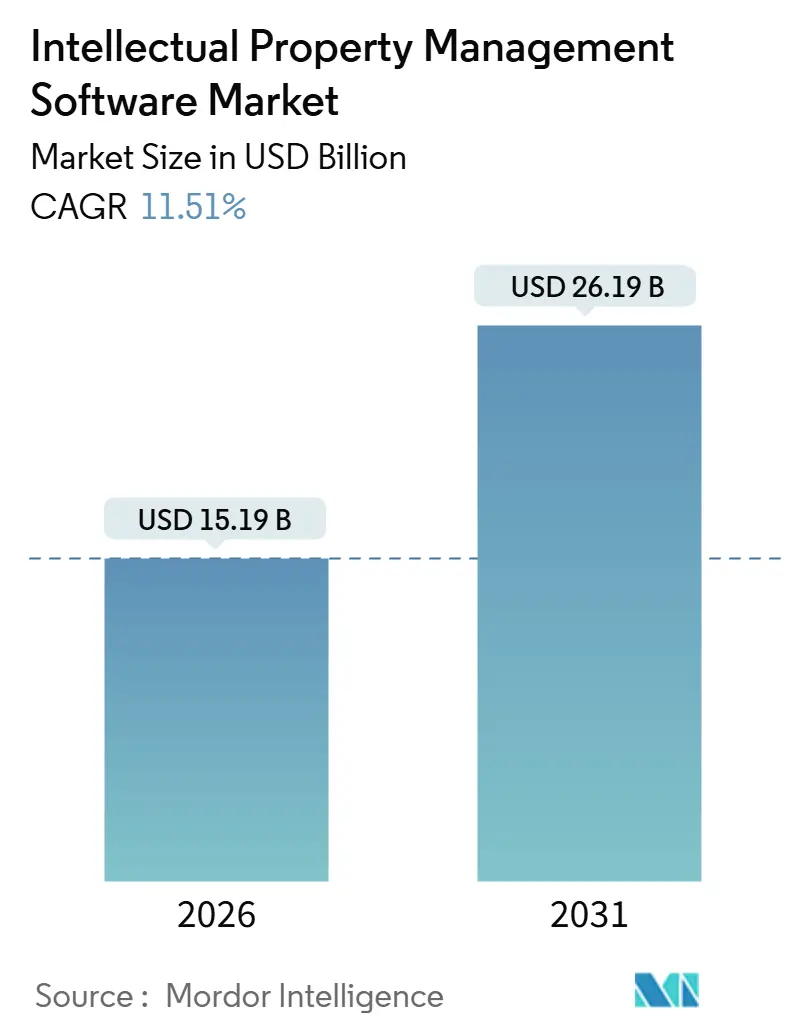
| Market Size (2026) | USD 15.19 Billion |
| Market Size (2031) | USD 26.19 Billion |
| Growth Rate (2026 - 2031) | 11.51% CAGR |
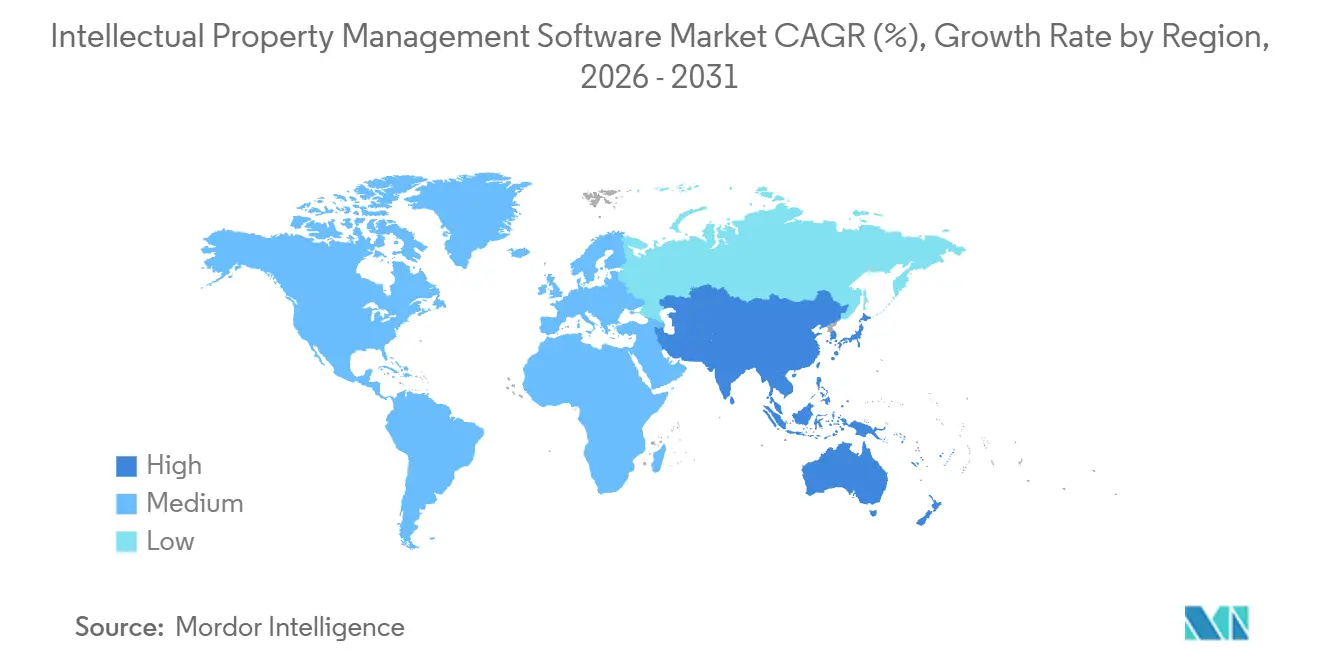
| Fastest Growing Market | Asia Pacific |
| Largest Market | North America |
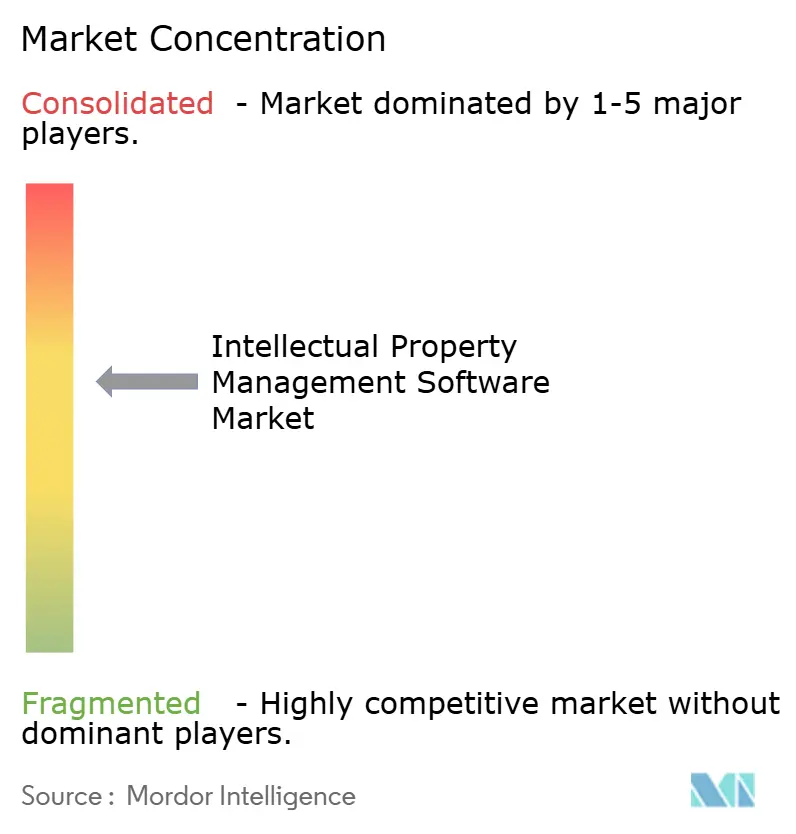
| Market Concentration | Medium |
Major Players *Disclaimer: Major Players sorted in no particular order Image © Mordor Intelligence. Reuse requires attribution under CC BY 4.0. | |
Intellectual Property Management Software Market Analysis by Mordor Intelligence
The intellectual property management software market size stands at USD 15.19 billion in 2026 and is projected to reach USD 26.19 billion by 2031, advancing at an 11.51% CAGR through the forecast period. Growing patent volumes, the incorporation of generative AI into prior-art workflows, and Asia’s surge of direct-to-consumer brands are pushing enterprises to refresh legacy docketing tools with cloud-native, analytics-rich platforms. Regulatory bodies are reinforcing this momentum: the United States Patent and Trademark Office (USPTO) plans to embed machine-learning support tools in examiner workflows by 2027. Meanwhile, China continued to command more than 45% of global trademark filings in 2024, compelling multinationals to deploy real-time cross-border surveillance dashboards. Hybrid architectures are gaining favor as organizations balance data-sovereignty mandates with a need for AI-driven analytics, and services revenue is accelerating as firms outsource valuation and competitive-intelligence tasks to cover talent gaps in markets such as Japan. Vendors able to weave compliance intelligence, geopolitical-risk monitoring, and ESG-linked valuation into unified suites are positioned to capture disproportionate share of the intellectual property management software market during the outlook period.
Key Report Takeaways
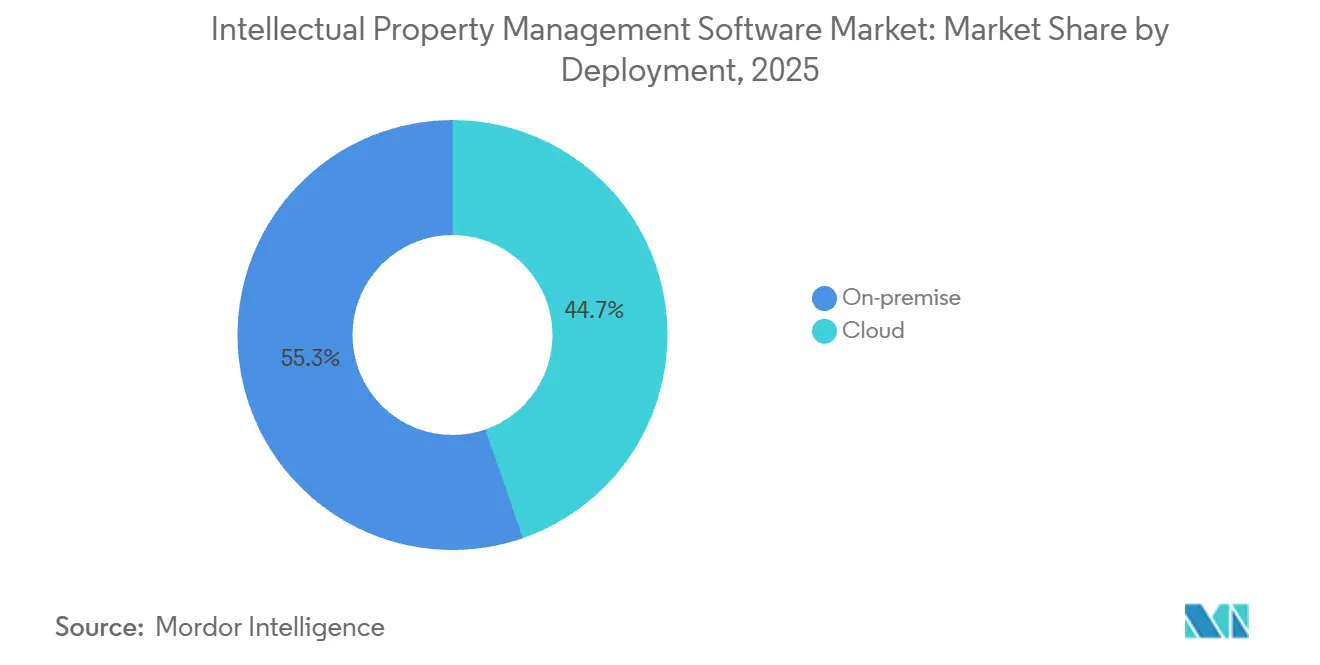
- By deployment, on-premise solutions led with 55.31% revenue share in 2025, while cloud is forecast to expand at a 12.36% CAGR through 2031.
- By component, software held 63.36% of 2025 revenue, whereas services are projected to grow at a 13.52% CAGR to 2031.
- By IP type, patent modules captured 41.27% of 2025 spending, but design-right tools are advancing at a 14.12% CAGR through 2031.
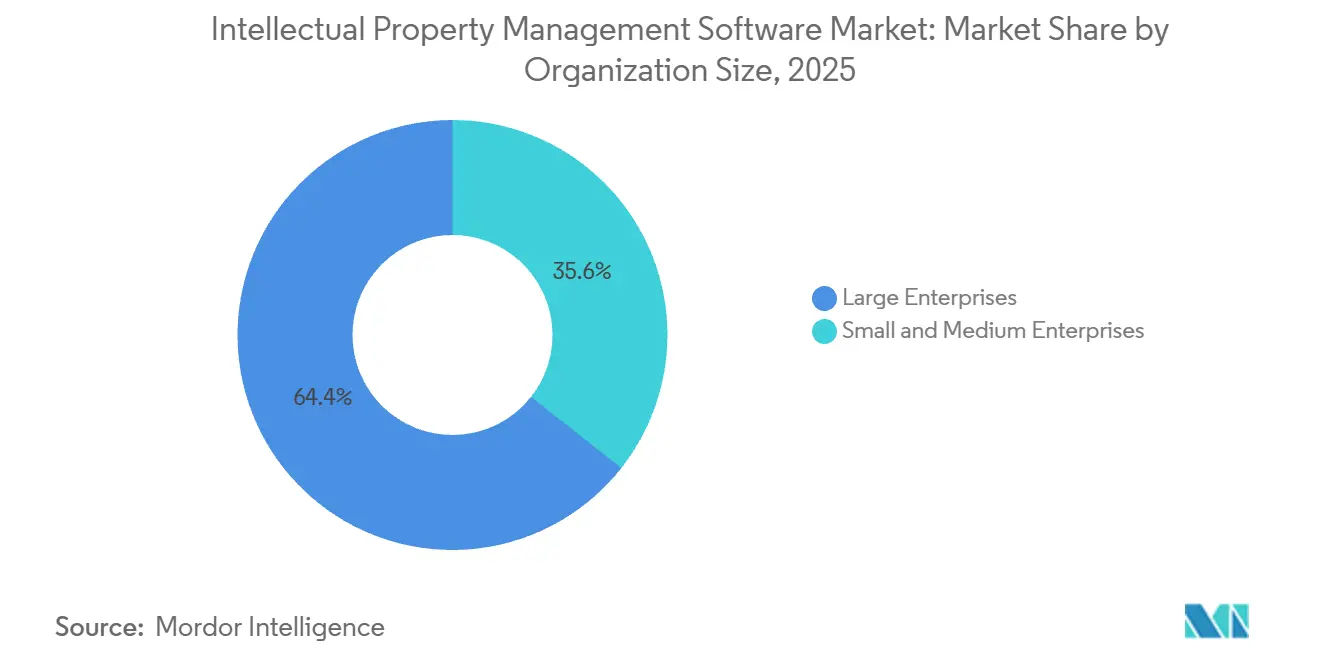
- By organization size, large enterprises accounted for 64.38% of 2025 spend, yet small and medium enterprises are expected to post a 12.36% CAGR to 2031.
- By end-user industry, information technology and telecom commanded 29.71% of 2025 revenue, while healthcare and life sciences will expand at a 13.82% CAGR through 2031.
- By geography, North America held 38.36% of 2025 revenue, whereas Asia Pacific is projected to grow at a 14.32% CAGR to 2031.
Note: Market size and forecast figures in this report are generated using Mordor Intelligence’s proprietary estimation framework, updated with the latest available data and insights as of January 2026.
Global Intellectual Property Management Software Market Trends and Insights
Drivers Impact Analysis*
| Driver | (~) % Impact on CAGR Forecast | Geographic Relevance | Impact Timeline |
|---|---|---|---|
| Adoption of AI-Powered Patent-Analytics | +2.3% | North America with spillover to Europe and Japan | Medium term (2-4 years) |
| Generative AI-Based Prior-Art Search | +2.2% | Global with early uptake in North America, Europe, China | Short term (≤ 2 years) |
| D2C Brand Trademark Surge in Asia | +2.1% | Asia Pacific core, notably China, India, Southeast Asia | Short term (≤ 2 years) |
| U.S.-China Semiconductor Patent Wars | +1.8% | Global, concentrated in North America, China, Taiwan, South Korea | Long term (≥ 4 years) |
| ESG-Linked IP Valuation Mandates | +1.5% | Global, led by North America and European Union | Medium term (2-4 years) |
| India and Brazil Fast-Track Schemes | +1.7% | India and Brazil with ripple effects across ASEAN and Latin America | Short term (≤ 2 years) |
| Source: Mordor Intelligence | |||


Adoption of AI-Powered Patent-Analytics Driving Suite Upgrades Across North America
Corporations across the United States and Canada are moving from keyword-search tools to transformer-based analytics that cluster patents semantically, trimming freedom-to-operate studies from weeks to days. The USPTO piloted its Automated Subject-Matter Analysis Platform in June 2025, signaling regulatory approval for AI-assisted examination.[1]United States Patent and Trademark Office, “USPTO Artificial Intelligence Strategic Plan,” uspto.gov Automotive and pharmaceutical filers handling portfolios that exceed 10,000 active families are early adopters. Clarivate partnered with DesignVision in September 2025 to add computer-vision detection of design infringement on e-commerce sites, a feature that counters the 18-month publication lag between filing and public visibility. LexisNexis followed in March 2025 with predictive-allowance scoring based on examiner histories, letting counsel shift prosecution resources to high-probability applications. Collectively, these innovations shorten prosecution cycles and have begun to divide the intellectual property management software market into efficiency leaders and laggards.
Generative AI-Based Prior-Art Search Reducing Draft Cycles
Large language models now synthesize abstracts, standards, and academic papers into ranked relevance lists that attorneys review in hours rather than days. The European Patent Office embedded a generative assistant in April 2025 that lets examiners pose natural-language queries and receive citation suggestions with context snippets.[2]European Patent Office, “Generative AI Assistant for Examiners,” epo.org In private practice, LexisNexis reported a 42% drop in average search time during a 2025 pilot with 15 law firms. Patsnap launched a generative-search tool in January 2025 for problem-statement inputs and multi-source outputs. The resulting cost savings have paved the way for fixed-fee engagements, intensifying price competition among outside counsel. As models mature, vendors that fine-tune them on domain-specific corpora and loop examiner feedback into retraining pipelines are likely to widen their lead.
D2C Brand Trademark Surge in Asia Accelerating SaaS Adoption
Asia’s wave of digitally native consumer brands pushed trademark filings in India up 7.4% year on year in 2024, while China processed 4.5 million applications, the largest global tally. Startups lacking in-house counsel choose cloud-based monitoring suites that issue real-time alerts for similar marks across marketplaces. Tiered subscription plans that bundle docketing with analytics make entry feasible for small and medium enterprises, supporting the 12.36% CAGR forecast for cloud deployments. Local-language interfaces and regional payment gateways further lower adoption barriers in Indonesia and Vietnam. The outcome is a rapidly expanding subscriber base that favors modular, upgradeable platforms over traditional, monolithic licenses.
U.S-China Semiconductor Patent Wars Spurring Cross-Border Monitoring Demand
Export controls issued by the United States Bureau of Industry and Security in October 2024 tightened access to advanced node electronic-design-automation tools. Semiconductor firms now track jurisdiction-specific licensing constraints alongside patent validity challenges in both the USPTO Patent Trial and Appeal Board and China’s invalidation proceedings. Portfolio dashboards have begun to layer geopolitical-risk scores that display exposure by technology node and fab location. Royalty flows from cross-licensing agreements reached USD 12 billion in 2024, underscoring the financial stakes. Vendors that automate compliance reporting and visualize cross-border risks are becoming indispensable to chip-design houses.
Restraints Impact Analysis*
| Restraint | (~) % Impact on CAGR Forecast | Geographic Relevance | Impact Timeline |
|---|---|---|---|
| Fragmented EU Data Standards | -1.4% | European Union with spillover to the United Kingdom post-Brexit | Medium term (2-4 years) |
| Rising Cyber-Insurance Premiums | -1.2% | Global with acute pressure in North America and Europe | Short term (≤ 2 years) |
| IP-Analytics Talent Shortage in Japan | -0.9% | Japan with emerging gaps in South Korea and Taiwan | Long term (≥ 4 years) |
| Slow Blockchain Registry Adoption | -0.8% | Global with pilots in China, United Arab Emirates, select EU states | Long term (≥ 4 years) |
| Source: Mordor Intelligence | |||
Fragmented EU Data Standards Hindering Portfolio Consolidation
National nuances in the General Data Protection Regulation require multinationals to manage parallel docket systems, as residency and localization rules vary across the 27-member bloc. Separate metadata schemas at the European Patent Office and the European Union Intellectual Property Office further complicate the integration process. Pharmaceutical companies managing supplementary protection certificates must file country-specific extensions, which require varying documentation. Each national patent office often requires bespoke application programming interface connectors, which inflates development costs for vendors and delays feature parity across Europe. Until the bloc harmonizes a digital services framework for IP data, enterprises will see reduced savings from cloud adoption.
Rising Cyber-Insurance Premiums Inflating Cloud Total Cost of Ownership
Cyber-insurance premiums for cloud-hosted IP portfolios climbed 28% in 2024, spurred by high-profile ransomware incidents that exposed prosecution correspondence for more than 1,200 clients. Insurers now demand multi-factor authentication, quarterly penetration testing, and end-to-end encryption as policy pre-conditions. Compliance adds USD 15,000 to USD 50,000 in annual costs for mid-sized enterprises, eroding the price advantage of the cloud. For portfolios exceeding 5,000 assets, combined insurance, audit, and security-tooling costs can top USD 200,000 each year, nudging some organizations toward hybrid architectures that keep active prosecution files on-premise while offloading analytics to the cloud.
*Our forecasts treat driver/restraint impacts as directional, not additive. The impact forecasts reflect baseline growth, mix effects, and variable interactions.
Segment Analysis
By Deployment: Hybrid Architectures Gain Traction
On-premise installations accounted for 55.31% of the intellectual property management software market share in 2025, largely because law firms and pharmaceutical multinationals retain legacy systems for sovereignty and audit purposes. Cloud revenue, however, is projected to advance at a 12.36% CAGR, reflecting uptake among small and medium enterprises in India, Brazil, and Southeast Asia that favor subscription economics over server procurement. Hybrid models, which store sensitive correspondence on-premise but route analytics queries to cloud AI engines, are bridging the gap. European life sciences companies are adopting regional cloud instances housed within the bloc to meet data-localization requirements. Vendors are responding with consumption-based pricing that charges per active family, making cost forecasts easier for corporate legal departments to manage.
The intellectual property management software market is likely to see on-premise deployments drop below 45% by 2031, as patent office digitization and cyber insurance normalization reduce the perceived risk of cloud deployment. Hybrid adoption is gaining momentum among automotive manufacturers that segregate confidential design drawings while syncing granted patents to cloud dashboards for competitive intelligence. Japan’s inclusion of machine translation in patent examination has improved comfort with cloud services that handle cross-lingual analytics. Collectively, these shifts suggest that flexibility rather than deployment purity will drive procurement over the forecast horizon.

By Component: Services Outpace Software Growth
Software modules made up 63.36% of 2025 revenue, spanning docketing, search databases, analytics dashboards, and valuation tools. Services implementation, consulting, analytics, and managed support are forecast to grow at a 13.52% CAGR to 2031, outstripping software growth as enterprises confront talent shortages. In Japan, retirements among registered patent attorneys outpaced new certifications by 15% in 2024, spurring demand for third-party analytics contracts that deliver periodic landscape reviews. ESG-linked valuation mandates from investors have also expanded the addressable services pool, as finance teams seek audit-ready intangible-asset appraisals.
Enterprises migrating from legacy on-premise stacks to cloud-native suites require data cleansing, workflow reconfiguration, and user training, lengthening implementation cycles to an average of nine months for large deployments. The intellectual property management software market size attached to services is therefore rising faster than that of software alone, and outcome-based pricing, where clients pay for delivered insights rather than perpetual licenses, is strengthening this trend. Vendors that combine robust platforms with consulting arms stand to win bundled contracts.
By IP Type: Design Rights Accelerate
Patent modules captured 41.27% of revenue in 2025; however, design-right functionality is the fastest-growing segment of the intellectual property management software market, expanding at a 14.12% CAGR through 2031. EU design filings increased by 19% in 2024, with smartphone accessories, wearable devices, and automotive interiors leading the way.[3]European Union Intellectual Property Office, “Metadata Harmonization Challenges,” euipo.europa.eu Consumer electronics brands value computer-vision analytics that map e-commerce images against registered drawings, an innovation Clarivate integrated into its platform during 2025.
Trademark watch services remain critical for Asia’s proliferating direct-to-consumer brands, and copyright tracking is gaining prominence among generative AI developers who need to confirm the provenance of training data. Trade-secret modules still occupy a niche, but new features such as employee-access logging are aligning with European legal requirements. Vendors that can offer all four IP categories in a unified dashboard are best positioned to capitalize on the rising trend of cross-licensing and infringement enforcement.
By Organization Size: SMEs Drive Incremental Growth
Large enterprises with 1,000 or more employees generated 64.38% of 2025 spending, underpinned by multi-year licenses that integrate with enterprise resource planning suites. Yet small and medium enterprises are forecast to post a 12.36% CAGR to 2031, benefiting from expedited examination pathways in India and Brazil that cut pendency and lower opportunity costs. Cloud platforms with tiered pricing have democratized access by eliminating server outlays and converting capital expenditure into operating expense.
Brazilian cleantech startups, for instance, filed 1,200 green-technology patents in 2024 and now adopt dashboards that include carbon-impact scoring. Southeast Asian small businesses benefit from local-language interfaces and regional payment gateways that eliminate foreign-exchange friction. For vendors, scalable architectures that grow from 100 to 10,000 assets without re-engineering will capture the broadest segment of the intellectual property management software market.
By End-User Industry: Healthcare Leads Services Uptake
Information technology and telecom firms commanded 29.71% of 2025 revenue as 5G and standard-essential patent disputes demanded real-time analytics. Healthcare and life sciences are projected to grow at a 13.82% CAGR, driven by biologics patent estates that often exceed 80 families per therapy and require meticulous coordination of term extensions and data-exclusivity deadlines. Automotive manufacturers are increasingly relying on design-patent modules as electric-vehicle aesthetics become key market differentiators.
Fintech companies, spurred by a 41% rise in related patent filings in 2024, are emerging as key buyers who need dashboards that map claims to regulatory sandboxes. Government patent offices and university tech-transfer centers are modernizing legacy systems to support electronic filing and AI-assisted screening. As industries converge, R&D, regulatory compliance, and commercial decision-making will remain inside unified platforms, with specialized vertical modules remaining a core purchase criterion.
Geography Analysis
North America contributed 38.36% to 2025 revenue, supported by the USPTO’s AI roadmap and Canada’s CAD 85 million (USD 63 million) digitization initiative. Nearshoring trends increased Mexican patent applications by 12% in 2024, driving demand for bilingual dashboards. Enterprises across the region are now prioritizing analytics and valuation tools as private-equity sponsors demand audit-ready metrics for intangible assets.
Asia Pacific is the fastest-growing region, forecast at a 14.32% CAGR to 2031. China’s 4.5 million trademark filings in 2024 and India’s twelve-month expedited examination pathway have accelerated the growth of the intellectual property management software market across the bloc. Japan’s talent shortage in patent analytics fuels the uptake of managed services, while South Korea’s semiconductor focus and Australia’s agri-innovation agenda diversify demand. ASEAN’s 23% jump in Vietnamese trademark filings underscores the broader regional expansion.
Europe holds a mid-tier share but faces data-standard fragmentation that slows platform consolidation. The European Patent Office’s generative search assistant, introduced in April 2025, demonstrates the regulatory agency's willingness to modernize. Brazil leads South America after launching a fast-track green-tech route in March 2025, and Argentina reports 90% digitization of prosecution workflows. Middle Eastern nations experiment with blockchain registries, albeit with limited interoperability, while Africa’s growth centers on university tech-transfer offices in South Africa, Nigeria, and Kenya.

Regulatory Landscape
Regulatory requirements are increasingly shaping product roadmaps for intellectual property management software through standardized data exchange, AI transparency, and enforcement-oriented compliance. The World Intellectual Property Organization (WIPO) Committee on WIPO Standards approved a revision of ST.90 (v2.0) for web APIs in November 2025, supporting harmonized IP data exchange across offices and raising the bar for API-ready platforms that can ingest and normalize records from multiple offices.
In 2026 policy actions added to software governance. CNIPA published its 2026 Plan for Building a Strong Intellectual Property Nation, tightening guidelines on genuine software management and audits. The EU AI Act imposes compliance obligations on general-purpose AI model providers, with an August 2026 milestone for transparency and training-data disclosures. In the United States, national security enforcement was linked to IP protection through February 2026 PAIPA actions, reinforcing defensible trade-secret controls in IP repositories.
Value Chain Analysis
The value chain starts with upstream data and infrastructure inputs, including patent and trademark databases and standards-based exchanges. Cloud, identity, encryption, and audit logging layers then enable controlled access to prosecution artifacts. Key modules typically span docketing and workflow automation, portfolio repositories, prior-art search and analytics dashboards, watch and enforcement tooling, and licensing and royalty management capabilities. AI enablement is embedded in the build layer, which depends on domain corpora, model governance controls, and integration patterns that route outputs into attorney and examiner workflows.
In midstream execution, systems integrators and vendor professional services teams handle data migration, cleansing, connector buildouts to patent and trademark data sources, SSO configuration, and workflow re-engineering. Cyber and compliance checks are often built alongside these activities to support hybrid deployments. Downstream channels include direct enterprise sales to corporate IP departments and law-firm procurement, along with self-serve SaaS entry points aimed at SMEs seeking faster onboarding and subscription economics. Buyers also increasingly see suite integrations that connect renewal services, clearance and watch tools, and financial or royalty systems. As a signal of packaging and buyer intent, Questel published its 2026 IP Outlook survey in April 2026, reporting that 73% of respondents viewed AI as permanently transforming IP roles and 59% planned to increase spending on IP technology in 2026, reinforcing the shift toward integrated, AI-augmented platforms and services-heavy implementations.
Competitive Landscape
The top five vendors controlled approximately 42% of the 2025 revenue, indicating moderate concentration within the intellectual property management software market. Incumbents such as Clarivate, CPA Global, and Anaqua retain large-enterprise licenses thanks to proven integrations, whereas challengers like Patsnap, Questel, and Alt Legal target analytics or fast-onboarding SaaS niches. AI-powered prior-art search, ESG-ready valuation, and hybrid deployments are the main battlegrounds. Clarivate’s 2025 DesignVision partnership added real-time design-patent infringement detection, attracting consumer electronics and fashion brands.
LexisNexis rolled out examiner-history-based grant-probability scoring in March 2025, sharpening prosecution strategies for law firms and in-house teams. Vendors are layering geopolitical risk visualizations onto dashboards to help general counsel track technology node exposure after tightened U.S. export controls. Blockchain-backed patent registries, although still in pilot stages, could redefine ownership validation once interoperability challenges are resolved.
Market dynamics resemble a barbell: global law firms and pharmaceutical majors negotiate multi-year enterprise deals, while startups and university tech-transfer offices opt for modular SaaS subscriptions. This leaves mid-tier enterprises underserved, creating white space for integrators that mesh legacy on-premise stacks with cloud-native AI modules without forcing rip-and-replace transformations.
Intellectual Property Management Software Industry Leaders
Anaqua Inc.
Clarivate PLC
DoketTrak
WebTMS Limited
TM Cloud Inc.
- *Disclaimer: Major Players sorted in no particular order

Market Opportunities and Future Outlook
One major opportunity is the shift from administrative docketing to unified, decision-support IP intelligence that can function as a governed data layer for enterprise AI. Vendors are moving toward API-first integration and tighter coupling between proprietary IP datasets and enterprise workflows. Clarivate launched IPOne in May 2026, connecting proprietary data assets (Derwent, Darts-ip, and CompuMark) with AI agents and enterprise AI environments, which points to demand for end-to-end platforms that reduce context switching between search, enforcement, and portfolio operations while keeping governance centralized.
Another opportunity is AI-driven semantic retrieval and plain-language analytics that reduce expertise barriers for business users and improve throughput for counsel, while maintaining auditability as AI transparency and copyright obligations tighten. Questel announced an AI model for semantic patent search integrated into Orbit Intelligence in April 2026, and LexisNexis introduced the Protege AI assistant within PatentSight+ in May 2026 to translate patent data into business insights through natural language. With hybrid deployment needs persisting due to data sovereignty and cyber requirements in the installed base, these developments create white space for vendors and integrators that can deliver secure connectors, provenance tracking, and interoperability across patent, trademark, design, and copyright workflows without requiring rip-and-replace transformations.
Recent Industry Developments
- July 2026: Anaqua renewed its long-standing partnership with Sony Group Corporation, continuing Sony's use of the AQX platform and expanding access to AI-powered IP capabilities. The renewal underscores enterprise demand for scalable, vendor-supported platforms that combine core portfolio operations with embedded AI features across large, complex IP estates.
- April 2026: Questel announced an AI model for semantic patent search integrated into Orbit Intelligence, improving how users extract actionable insights from patent data. The move reinforces the drive toward AI-enhanced workflows and hybrid deployment patterns that balance data governance with search depth across patent, trademark, design, and copyright assets.
- February 2025: Nordic Capital completed the acquisition of a controlling interest in Anaqua from Astorg. The ownership change provided additional financial backing for product investment and inorganic expansion, supporting consolidation dynamics among scaled IP management suite providers.


Research Methodology Framework and Report Scope
Market Definition and Coverage
This market covers software platforms used to manage intellectual property work, including capturing IP records, tracking deadlines, handling renewals, supporting licensing workflows, and producing portfolio level reporting across patents, trademarks, copyrights, designs, and trade secrets.
Scope exclusions: We exclude professional services that sit outside the software sale, such as law firm prosecution work, valuation consulting, and IP brokerage.
Segmentation Overview
- By Deployment
- On-premise
- Cloud
- By Component
- Software
- IP Portfolio Management Suites
- Patent and Trademark Search Databases
- IP Analytics Dashboards
- Docketing and Workflow Automation
- Services
- Implementation and Integration
- Consulting and Analytics
- Support and Maintenance
- Software
- By IP Type
- Patent
- Trademark
- Copyright
- Design
- Trade Secret
- By Organization Size
- Large Enterprises (?1,000 Employees)
- Small and Medium Enterprises (<1,000 Employees)
- By End-User Industry
- BFSI
- Healthcare and Lifesciences
- Automotive and Mobility
- IT and Telecom
- Consumer Electronics and Semiconductor
- Government and Public Sector
- Academia and Research Institutes
- Other End-User Industries
- By Geography
- North America
- United States
- Canada
- Mexico
- South America
- Brazil
- Argentina
- Rest of South America
- Europe
- Germany
- United Kingdom
- France
- Italy
- Spain
- Russia
- Rest of Europe
- Asia Pacific
- China
- Japan
- South Korea
- India
- Australia
- New Zealand
- Rest of Asia Pacific
- Middle East
- United Arab Emirates
- Saudi Arabia
- Turkey
- Rest of Middle East
- Africa
- South Africa
- Nigeria
- Kenya
- Rest of Africa
- North America
Data Sources, Market Sizing, and Validation
Desk Research
Desk research starts with building a clean view of the IP activity backdrop and the software adoption environment. Public sources such as WIPO activity statistics, USPTO and EPO publication data, and OECD digital economy indicators help frame filing volumes, renewal intensity, and where IP portfolios are expanding faster.
We then map that demand context to supply side signals using SEC filings, annual reports, investor presentations, press releases, and product documentation from software providers and integrators. For additional checks, we also use peer-reviewed journals on IP administration and innovation management, and trade association publications where available. In a few cases, we use paid subscription sources for company financials and news to speed up identification of revenue disclosures and recent contract signals. These desk sources are illustrative rather than exhaustive, and we draw on other public references for data collection, validation, and clarification.
Primary Interviews and Surveys
Primary work is used to confirm what end users actually pay for and how they buy, because packaging and pricing vary across vendors and regions. We speak with a mix of software executives, product and sales leaders, implementation partners, and IP operations teams across enterprises, law firms, and universities, then cross check responses across APAC, EMEA, and the Americas to reduce the risk of carrying one market assumption forward without support.
Distribution of primary research fieldwork respondents
| Company type | Respondent position | Region |
|---|---|---|
| Top tier: 29% | CXOs: 20% | APAC: 52% |
| Mid tier: 51% | Functional/Unit leaders: 38% | EMEA: 30% |
| Smaller Players: 20% | Managers: 42% | Americas: 18% |
Market-Sizing & Forecasting
Our sizing approach uses a top-down demand pool build, where enterprise IP activity and software adoption indicators are converted into an addressable spend envelope, then split by deployment and user type to estimate total market value. We corroborate that view with selective bottom-up approximations, including sampled vendor revenue disclosures, channel checks with implementers, and a sanity check using typical annual subscription values multiplied by plausible user counts.
Inputs are kept practical and traceable, given this is a software market with mixed pricing models. Key variables include patent and trademark filing volumes and renewal behavior, the share of portfolios managed in centralized systems, cloud migration pace in legal and compliance functions, average contract term and seat counts, and implementation intensity for larger portfolios (which can increase first year spend). For forecasting, we use scenario analysis supported by expert views on AI-enabled docketing, regulatory compliance workload, and cross border portfolio complexity, then reconcile scenarios into a single base case. Where bottom-up disclosures are incomplete, gaps are handled with range-based benchmarks by customer size and geography, followed by rechecks with interview inputs before finalizing totals.
Data Validation & Update Cycle
Outputs are validated through triangulation across independent signals, and the largest deltas are required to be explained before final sign-off. We check variance against related indicators such as IP filing momentum, direction of IT spend in legal operations, and observed shifts from on-premise to cloud subscriptions, then review outliers in a second analyst pass.
If a major assumption changes, for example pricing movement, packaging changes, or a regional demand swing, the team re-contacts sources to confirm direction and magnitude. Reports are refreshed annually, and interim updates are done when material events occur that can move demand or pricing. Before delivery, we complete a final review so clients receive the latest updated view.
Mordor Intelligence's Intellectual Property Management Software Market Sizing Compared With Other Published Estimates
Published market sizes for IP management software do not always match because counting rules differ, even when the market name appears identical. Differences typically come from what is treated as software versus services, how bundles are allocated, which buyers are included, and whether the figure reflects a full global view or a narrower country set.
The table below shows that most of the spread is driven by scope and year alignment. In Mordor Intelligence's model, the value is limited to IP management software platforms (including bundled analytics and docketing modules) while excluding IP legal services like prosecution and consulting that can inflate spend when they are grouped together.
Benchmark comparison
| Source | Market Size | Gaps in Research Methodology |
|---|---|---|
| Mordor Intelligence | USD 15.19 B (2026) | |
| Global Consultancy A | USD 12.30 B (2024) | Uses an earlier base year and may mix software with related services and implementation in component splits, which can shift totals depending on how service-heavy deployments are treated. |
| Industry Publisher B | USD 8.90 B (2023) | Reports a 2023 base year and appears to emphasize selected country coverage and segmented views by IP type, which can understate the total if smaller regions and multi-IP suites are not fully captured. |
Taken together, the differences are not only about growth rates, they are about what is counted and when it is counted. By keeping the unit of measure tied to software license and subscription spend and then stress testing it with demand indicators like filings and renewals, our estimate is easier to reproduce and explain.


Key Questions Answered in the Report
What is the current value of the intellectual property management software market?
The market is valued at USD 15.19 billion in 2026 and is projected to reach USD 26.19 billion by 2031.
Which deployment model is growing fastest?
Cloud deployments are forecast to expand at a 12.36% CAGR through 2031, driven by small and medium enterprises adopting subscription pricing.
Why are design-right management tools gaining traction?
Consumer electronics and semiconductor companies use design registrations to delay competitors, pushing this segment to a 14.12% CAGR.
Which region will contribute the most incremental growth through 2031?
Asia Pacific, projected to grow at a 14.32% CAGR, will add the largest revenue share as China and India accelerate filings.
What is the main restraint in Europe?
Divergent data-localization rules across the European Union add integration costs and slow portfolio consolidation efforts.
How are AI tools changing IP management workflows?
Generative models shorten prior-art searches and predictive analytics forecast grant probabilities, reducing prosecution cycle times and legal spend.
Page last updated on:


