Industrial Safety Market Size and Share
Market Overview
| Study Period | 2020 - 2031 |
|---|---|
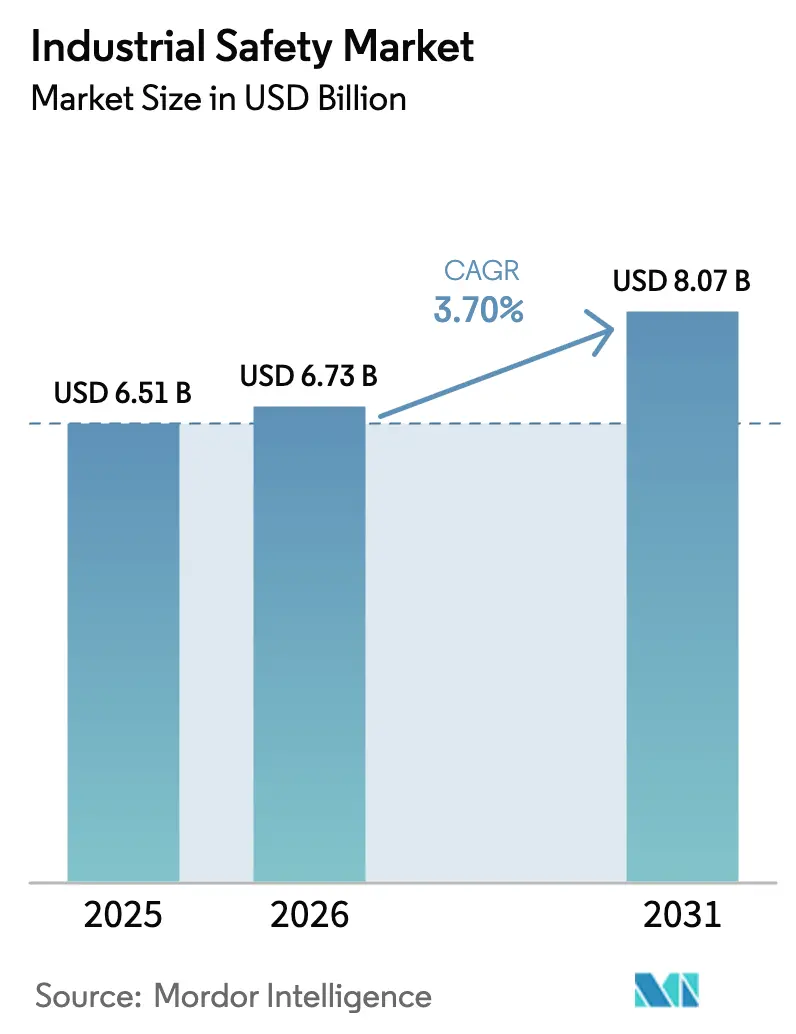
| Market Size (2026) | USD 6.73 Billion |
| Market Size (2031) | USD 8.07 Billion |
| Growth Rate (2026 - 2031) | 3.70% CAGR |
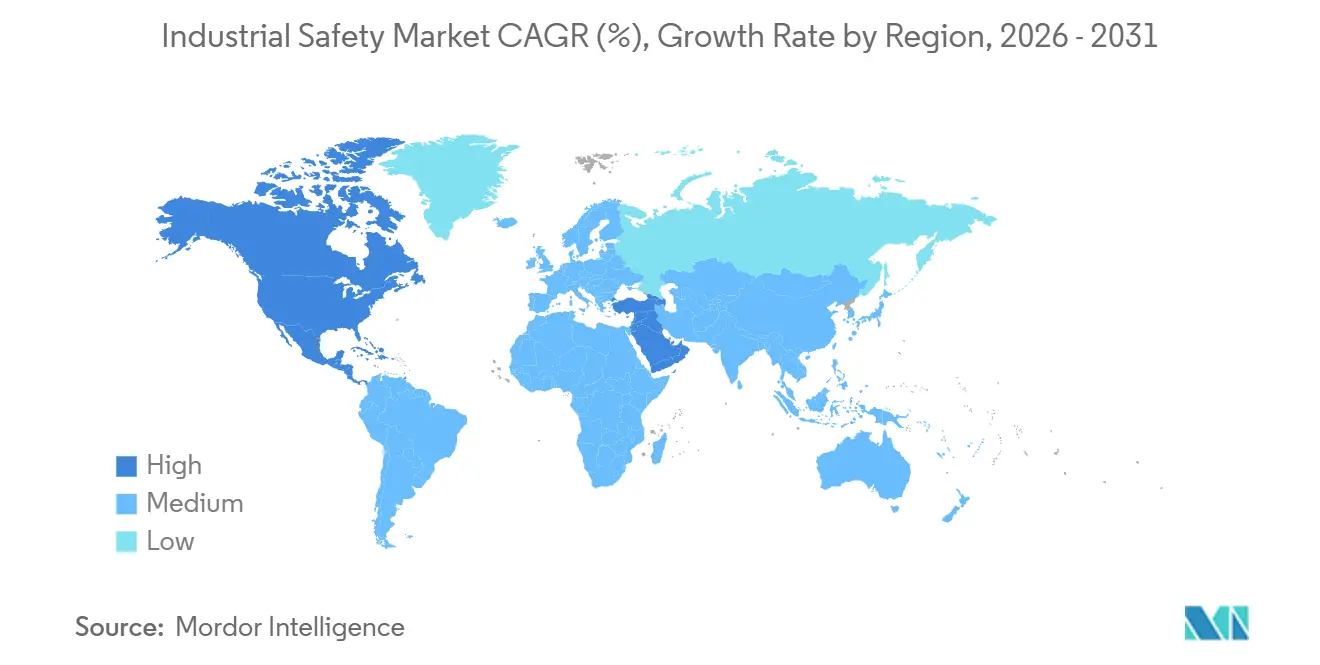
| Fastest Growing Market | Middle East |
| Largest Market | North America |
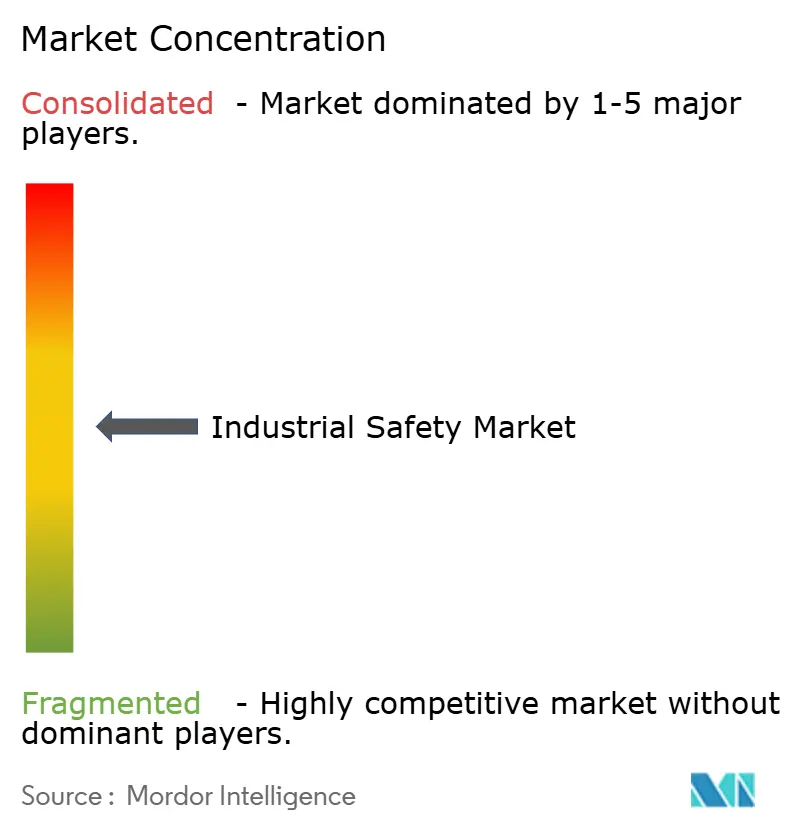
| Market Concentration | Medium |
Major Players *Disclaimer: Major Players sorted in no particular order Image © Mordor Intelligence. Reuse requires attribution under CC BY 4.0. | |
Industrial Safety Market Analysis by Mordor Intelligence
The Industrial Safety market size is projected to be USD 6.51 billion in 2025, USD 6.73 billion in 2026, and reach USD 8.07 billion by 2031, growing at a CAGR of 3.7% from 2026 to 2031. Demand is shifting from one-off hardware upgrades toward integrated safety architectures that combine cybersecurity, real-time analytics, and modular retrofits, enabling operators to satisfy tightening certification timelines and ESG disclosures EUROPEAN COMMISSION. Safety sensors still anchor the hardware stack, yet multiyear service contracts for lifecycle support now secure the strongest pricing power. Emergency Shutdown platforms dominate revenues, but High Integrity Pressure Protection Systems post the fastest unit growth as hydrogen, pharmaceutical, and deep-water producers re-engineer overpressure defenses IEC. Regionally, North America holds the largest spending base, whereas Saudi Arabia and the United Arab Emirates are scaling budgets the quickest under sovereign-fund mandates REUTERS. Vendors are responding with edge-ready controllers, cloud analytics, and plug-and-play modules that shorten brownfield commissioning cycles while lowering total installed cost.
Key Report Takeaways
- By component, safety sensors commanded 33.37% of the Industrial Safety market share in 2025, whereas services are advancing at a 3.96% CAGR through 2031.
- By safety system, Emergency Shutdown captured 37.62% revenue in 2025, and High Integrity Pressure Protection Systems are expanding at a 4.11% CAGR to 2031.
- By security level, SIL 3 architectures led with 38.71% of 2025 revenue, while SIL 4 solutions post the highest projected CAGR of 3.91% through 2031.
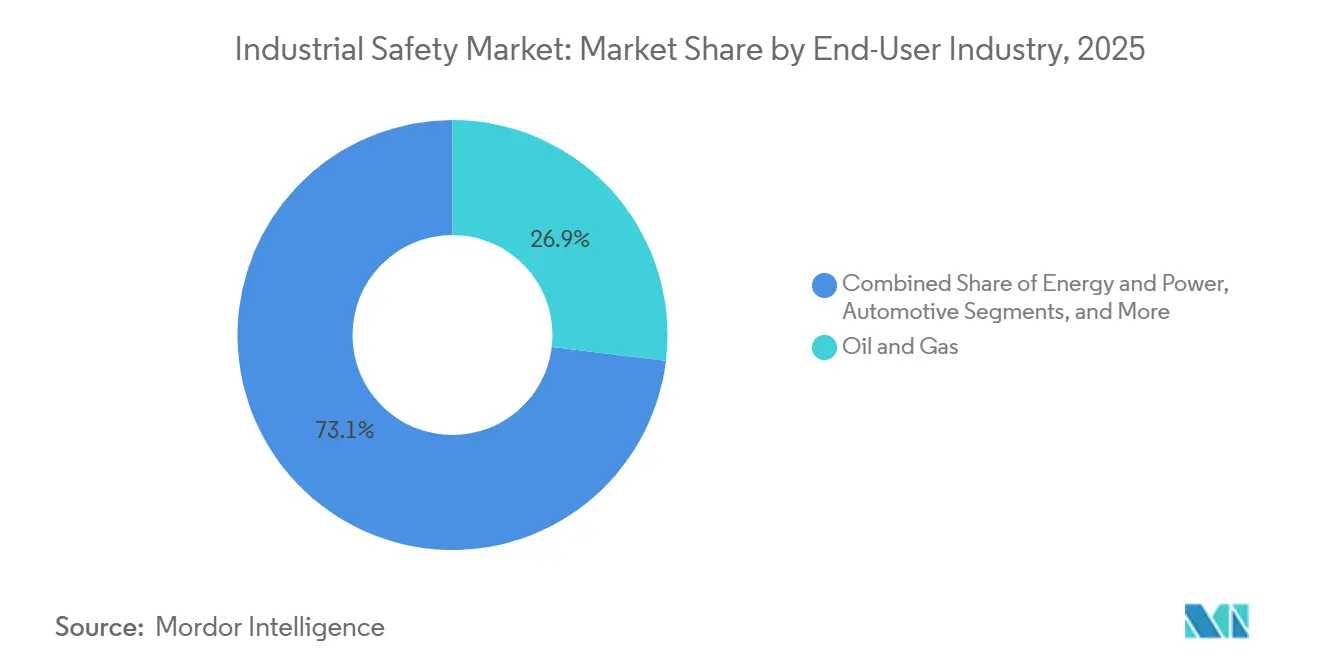
- By end user, oil and gas held 26.91% of Industrial Safety market size in 2025, yet pharmaceutical and healthcare is growing at a 4.24% CAGR through 2031.
- By geography, North America retained 33.73% revenue in 2025; the Middle East records the fastest 4.19% CAGR out to 2031.
Note: Market size and forecast figures in this report are generated using Mordor Intelligence’s proprietary estimation framework, updated with the latest available data and insights as of January 2026.
Market Trends and Insights
Drivers Impact Analysis of Industrial Safety Market*
| DRIVER | (~) % IMPACT ON CAGR FORECAST | GEOGRAPHIC RELEVANCE | IMPACT TIMELINE |
|---|---|---|---|
| Increasing regulatory pressure across high-risk industries | +1.2% | Global, with EU and North America leading enforcement | Medium term (2-4 years) |
| IIoT, robotics and advanced automation penetration | +0.9% | APAC core, spill-over to North America and Europe | Long term (≥ 4 years) |
| Worker-safety KPIs embedded in ESG scorecards | +0.7% | Global, concentrated in publicly listed enterprises | Short term (≤ 2 years) |
| Functional-safety certification demand in emerging economies | +0.5% | Middle East, Southeast Asia, Latin America | Medium term (2-4 years) |
| Cyber-secure safety system architectures | +0.4% | North America and EU, expanding to APAC | Long term (≥ 4 years) |
| Retrofit-friendly, modular safety plug-ins | +0.3% | Global, with early adoption in North America brownfield sites | Medium term (2-4 years) |
| Source: Mordor Intelligence | |||
Increasing Regulatory Pressure Across High-Risk Industries
The European Union’s Corporate Sustainability Reporting Directive obliges more than 50,000 firms to disclose incident data, turning functional-safety outlays into a board-level compliance metric. In the United States, twelve OSHA National Emphasis Programs launched in 2024 lifted maximum penalties to USD 161,323 per violation, accelerating capital allocation for SIL-rated Emergency Shutdown and Fire and Gas Monitoring projects.[1]U.S. Occupational Safety and Health Administration, “National Emphasis Programs,” osha.gov IEC 61511 Edition 2 simultaneously closed cybersecurity loopholes by mandating threat modeling for Safety Instrumented Systems, forcing brownfield operators to upgrade documentation and network segmentation IEC. Insurers have reacted by embedding functional-safety audits into policy renewals, raising premiums on non-compliant sites. Collectively, faster enforcement compresses return-on-investment horizons and elevates safety upgrades from discretionary to essential spending.
IIoT, Robotics and Advanced Automation Penetration
Honeywell’s Forge platform, active across 127 process plants in 2025, combines live telemetry with machine-learning models that predict valve or actuator failure up to 14 days in advance, trimming unplanned downtime by nearly one-fifth.[2]Honeywell International, “Forge Industrial IoT Suite,” honeywell.com ABB’s SafeMove2 robotics suite, certified to IEC 61508 SIL 2, enables dynamic speed and force limiting for collaborative tasks, expanding safety requirements to new automation cells ABB. While these digital layers improve reliability, they also widen the cyber-attack surface and now require ISA/IEC 62443 controls that add double-digit integration cost ISA. Enterprises that bolt IIoT onto legacy controls risk data silos that cannot drive predictive safety, weakening the underlying business case. Still, productivity benefits outweigh incremental complexity, securing a 0.9% positive lift on forecast CAGR.
Worker-Safety KPIs Embedded in ESG Scorecards
MSCI doubled the weight of occupational safety metrics in its 2024 ESG ratings, intensifying investor scrutiny of lost-time injury rates. The London Stock Exchange Workforce Disclosure Initiative found 68% of surveyed issuers linking executive pay to near-miss reporting volumes in 2025 LSEG. Siemens’ Xcelerator now funnels alarms from field safety loops into corporate dashboards, letting boards benchmark incidents by site and peer group. Demand for real-time analytics is therefore rising even in industries with historically low event frequency. The downside is metric proliferation, where firms focus on lagging indicators that satisfy auditors yet do not always improve onsite behavior.
Functional-Safety Certification Demand in Emerging Economies
Saudi Arabia earmarked USD 3.2 billion in 2025 for SIL 3 systems across NEOM industrial districts, leapfrogging incremental adoption curves followed in the West. India’s draft 2025 offshore rules propose mandatory SIL 2 verification for production platforms, widening the addressable market. TÜV Rheinland recorded a 34% jump in exam registrations, but a 52% pass rate keeps certified-engineer supply tight Multinationals are opening regional academies to bridge the gap; however, an average 9-month lag from course completion to onsite deployment still delays commissioning schedules.
Restraints Impact Analysis of Industrial Safety Market*
| RESTRAINTS | (~) % IMPACT ON CAGR FORECAST | GEOGRAPHIC RELEVANCE | IMPACT TIMELINE |
|---|---|---|---|
| High upfront CAPEX for SIL-rated systems | -0.8% | Global, acute in cost-sensitive emerging markets | Short term (≤ 2 years) |
| Complex integration with legacy PLC/DCS | -0.6% | North America and Europe brownfield sites | Medium term (2-4 years) |
| Scarcity of TÜV-certified functional-safety engineers | -0.4% | Global, most severe in Middle East and Southeast Asia | Long term (≥ 4 years) |
| ROI uncertainty in low-incident industries | -0.3% | Food and Beverage, Automotive, Metals and Mining | Medium term (2-4 years) |
| Source: Mordor Intelligence | |||
High Upfront CAPEX for SIL-Rated Systems
A SIL 3 Emergency Shutdown package for a midsize refinery costs USD 4.2–6.8 million plus another USD 1.1–1.9 million for third-party verification, delivering a 3× premium over a non-SIL control upgrade.[3]Baker Hughes Company, “Project Cost Benchmarking Study,” bakerhughes.com Emerging-market contractors face an added burden when local-content rules mandate uncertified valves that require redesign or import waivers. Modular, pre-certified skids can shave 20% off installed cost, yet adoption remains skewed to greenfield builds where layouts are still fluid. Capital scarcity, therefore, delays upgrades at the very assets that bear the highest process-safety risk, clipping 0.8% from the Industrial Safety market CAGR.
Complex Integration with Legacy PLC and DCS Assets
Emerson’s 2025 survey shows 63% of installations hit protocol mismatches that require custom gateways between modern safety controllers and decades-old fieldbus networks. Retrofitting integrated logic into an aging control backbone can elongate shutdown windows by up to 18 months and reduce engineering hours. Digital-twin simulation tools mitigate risk but add USD 0.3-0.5 million per project. The shortage of personnel familiar with both obsolete and contemporary architectures further stretches timelines, pulling down forecast CAGR by 0.6%.
*Our forecasts treat driver/restraint impacts as directional, not additive. The impact forecasts reflect baseline growth, mix effects, and variable interactions.
Industrial Safety Market Segment Analysis
By Component:
Sensors Anchor Hardware, Services Capture Lifecycle ValueSafety sensors secured 33.37% of 2025 revenue as IEC 61511 redundancy rules tripled detector counts in SIL 3 loops IEC. Controllers and relays ranked second, spearheaded by compact, modular designs such as Pilz PSS 4000 that fit pharmaceutical suites. Valves lag as partial-stroke diagnostics extend overhaul intervals, while Asian entrants undercut Western incumbents on price for barriers, power supplies, and HMIs. Services post a 3.96% CAGR because multi-year contracts bundle proof tests, firmware updates, and spare pools, locking in predictable income streams. Honeywell reported a 19% jump in lifecycle-service bookings in 2025, driven by cross-site framework deals. Consulting and training advance at 4.02% as TÜV-licensed auditors command premium day rates amid acute talent gaps.
The shift toward as-a-service engagement pulls margin from hardware into recurring revenue. Installation still holds 30.53% of service spend, although factory-pretested skids compress onsite labor by one-quarter. Maintenance and testing activities scale up because 40% of North American safety systems installed prior to 2010 are now approaching their second proof-test cycle. As brownfield portfolios age, vendors that bundle field services with analytics secure preferred-supplier status, deepening wallet share and raising switching costs across the Industrial Safety market.


By Safety System:
ESD Dominates; HIPPS Accelerates on Hydrogen and Pharma DemandEmergency Shutdown solutions generated 37.62% of 2025 revenue, underpinned by decades of regulatory entrenchment in refining and chemicals API. Fire and Gas Monitoring follows, boosted by wireless detectors that lower cabling cost and reduce false trips by 60%. ESD systems' market leadership reflects decades of installed base and regulatory entrenchment: the American Petroleum Institute's RP 14C standard, last revised in 2017, prescribes ESD logic for offshore platforms, while the European Union's Seveso III Directive mandates ESD interlocks for upper-tier establishments handling flammable or toxic substances.
HIPPS registers the strongest 4.11% CAGR as hydrogen pipelines and aseptic fill-finish suites require millisecond-level cutoffs to avert vent-to-atmosphere penalties. Burner Management gains relevance in waste-heat and hydrogen turbines tied to decarbonization projects. Other Safety Systems, encompassing High Integrity Alarm Management and Safety Instrumented Function logic solvers, are seeing niche adoption in nuclear and aerospace applications where SIL 4 certification is mandatory, but account for less than 8% of total safety-system revenue due to their specialized engineering requirements and limited vendor base.
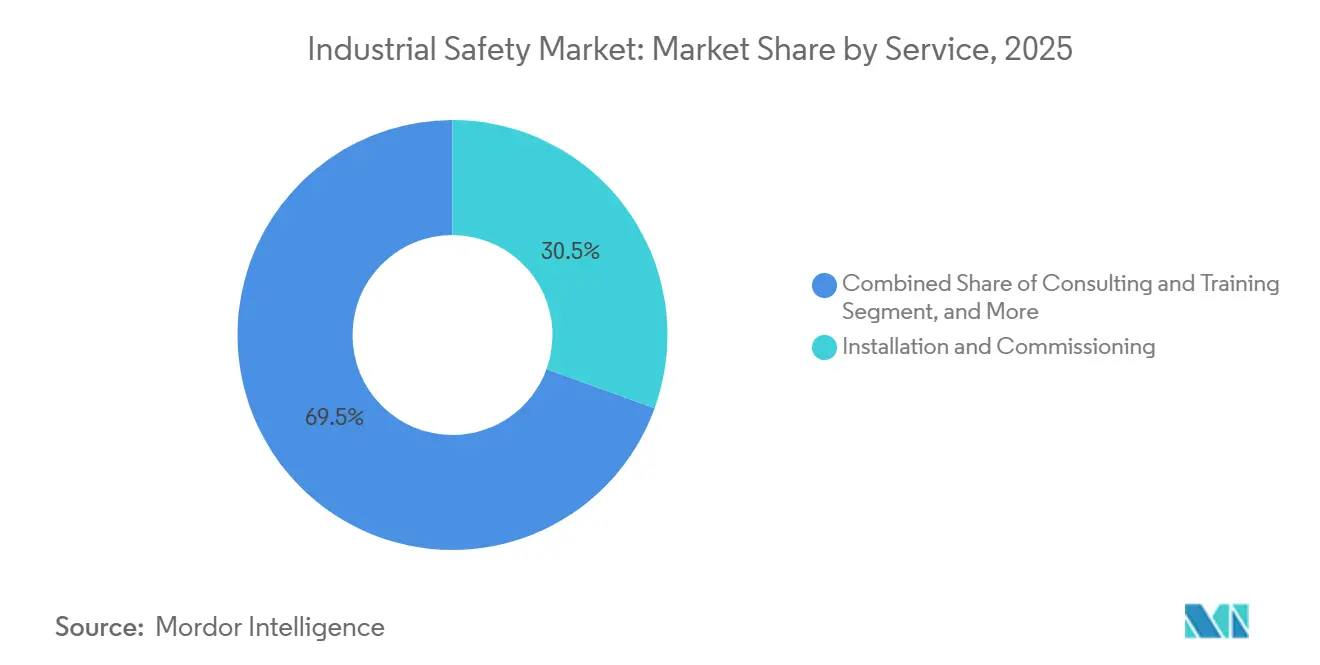
By Service:
Installation Leads; Consulting Gains on Compliance ComplexityAlthough installation and commissioning represent the single largest slice of 2025 revenue, the fastest growth option remains consulting and training at 4.02%.Installation and Commissioning remains the largest service category because it is a mandatory precursor to system operation, but its growth is decelerating as modular, pre-tested safety skids reduce on-site labor intensity and engineering firms offshore detailed design to lower-cost geographies.
Enterprises are responding by hiring third-party consultancies such as exida and SIS-TECH Solutions to conduct hazard and operability studies, layer of protection analyses, and SIL-verification audits, outsourcing tasks that previously resided within internal engineering departments. Multi-vendor maintenance challengers now court clients aiming to decouple from expensive OEM spares, raising competitive tension and spurring price normalization inside the Industrial Safety market.
By Security Level:
SIL 3 Prevails; SIL 4 Expands in Critical InfrastructureSIL 3 delivered 38.71% of 2025 revenue, fitting the bulk of high-risk but not catastrophic scenarios. Schneider Electric’s Triconex controller posts more than 12,000 live installs worldwide. SIL 2 trails yet still secures upgrades in utilities and food plants, while SIL 1 remains largely grandfathered. SIL 4 advances at 3.91% on nuclear reactors, crewed spacecraft, and large-scale hydrogen, where failure probabilities must fall below one in 100,000 annually. Higher certifications command a 2.5–3.5× price premium, constraining uptake to government-mandated environments but lifting blended ASPs across the Industrial Safety market size spectrum.
SIL 1 systems, suitable only for minor-consequence events, are largely obsolete in new installations but persist in legacy facilities where operators have grandfathered existing interlocks under pre-2000 standards. The shift toward higher SIL ratings is compressing the market for entry-level safety controllers and driving consolidation among component suppliers who lack the engineering resources to achieve SIL 3 or SIL 4 certification.
By End-User Industry:
Oil and Gas Tops Spend; Pharma Leads GrowthOil and gas contributed 26.91% of 2025 revenue after multiple refinery incidents pushed consent decrees and modernization budgets. Yet pharmaceutical and healthcare achieve the fastest 4.24% CAGR as FDA aseptic guidelines and serialization rules force integrated interlocks on vial-filling lines.
Chemicals and Petrochemicals, historically a core market, are seeing flat growth as operators defer discretionary capital expenditure amid volatile feedstock costs and margin compression, prioritizing maintenance over greenfield expansions. Metals and Mining, Food and Beverage, Automotive, and Aerospace and Defense collectively represent less than 25% of end-user revenue, constrained by lower incident frequencies and ROI uncertainty that makes safety-system investments harder to justify relative to productivity-enhancing automation.
Geography Analysis
North America Industrial Safety Market
North America held 33.73% of the Industrial Safety market share in 2025, thanks to a dense base of aging refineries and OSHA penalty multipliers that motivate rapid upgrades. Canada’s oil sands producers invested CAD 920 million (USD 680 million) in SIL 3 interlocks for steam-assisted gravity drainage wells, extending the capture of regional spend. Mexico’s opening of upstream acreage sparks new facilities designed around modular safety skids that cut commissioning by one-third.
Europe Industrial Safety Market
Europe advances compliance under Seveso III and worker-safety disclosure mandates. Germany’s chemical majors alone earmarked EUR 1.4 billion (USD 1.5 billion) for safety upgrades in 2025. The United Kingdom’s Health and Safety Executive served 78 improvement notices to operators behind on proof testing, accelerating adoption of remote valve diagnostics. Eastern Europe faces budget friction on greenfield projects, but leverages EU grants to embed SIL-3 controllers in hydrogen hubs.
MEA, APAC and South America Industrial Safety Market
The Middle East logs the fastest 4.19% CAGR throughout 2026-2031. Saudi Arabia’s Public Investment Fund devoted USD 3.2 billion to NEOM industrial clusters, while ADNOC integrates Ability System 800xA controllers and SafeMove2 robotics across 14 Ruwais trains, shaving 22% engineering cost. Africa, led by South Africa’s mining and Nigeria’s upstream sectors, remains nascent due to capital constraints and a shortage of TÜV-certified talent. Asia Pacific displays bifurcation: China and India accelerate under hydrogen and petrochemical expansions, whereas Southeast Asian LNG megaprojects employ SIL-2 detectors to unlock export financing. South America cycles spend with commodity prices, as Petrobras and Vaca Muerta developers rely on pre-certified skids to counter engineering shortages.

Competitive Landscape
Moderate concentration characterizes the Industrial Safety market, with the leading five brands capturing roughly 45–50% revenue. Schneider Electric, Honeywell, Siemens, ABB, and Rockwell Automation integrate safety logic, edge analytics, and cloud dashboards to deliver end-to-end visibility, increasing switching costs. Standalone specialists such as HIMA and Pilz defend share through SIL-4 certifications and retrofit-friendly modules, often partnering with hyperscalers to match digital capabilities HIMA. Asian manufacturers Hollysys and Supcon offer IEC 61508 SIL-2 controllers at a 30-40% price discount, capturing domestic demand but still lack global third-party validation for SIL-3 or SIL-4 criticality.
Technology differentiation pivots on embedded cybersecurity. ABB’s Ability System 800xA High Integrity includes native IEC 62443-4-2 compliance that secures controllers without external firewalls ABB. Emerson’s DeltaV SIS sends edge analytics to flag sensor drift before it erodes integrity levels, slicing spurious trips 18-22%.
Sensor vendors such as SICK, Pepperl+Fuchs, and others now embed diagnostics and voting logic inside detectors, displacing low-end controller demand in robotics and machine-guarding micro-segments. As brownfield operators seek plug-and-play retrofits, vendors that combine modular form factors, third-party SIL certification, and pay-as-you-grow licensing stand to gain incremental Industrial Safety market share.
Industrial Safety Industry Leaders
Schneider Electric SE
Honeywell International Inc.
ABB Ltd.
Rockwell Automation, Inc.
Siemens AG
- *Disclaimer: Major Players sorted in no particular order
Industrial Safety Market Companies Covered in this Report
- Schneider Electric SE
- Honeywell International Inc.
- Rockwell Automation Inc.
- Siemens AG
- ABB Ltd.
- Emerson Electric Co.
- Baker Hughes Company
- HIMA Paul Hildebrandt GmbH
- Yokogawa Electric Corporation
- Omron Corporation
- Johnson Controls International plc
- Balluff GmbH
- Keyence Corporation
- IDEC Corporation
- SICK AG
- Mitsubishi Electric Corporation
- Endress+Hauser AG
- Pilz GmbH & Co. KG
- Pepperl+Fuchs SE

Recent Industry Developments in Industrial Safety Market
- January 2026: Schneider Electric acquired the remaining AVEVA stake for GBP 9.5 billion (USD 12.1 billion), merging SCADA and historian software with EcoStruxure safety modules.
- December 2025: Honeywell launched Forge Safety Manager 2.0, deploying machine-learning drift prediction across 14 refineries.
- November 2025: Saudi Aramco awarded Yokogawa a USD 680 million ProSafe-RS contract for Jafurah shale gas.
- October 2025: Siemens bought Brightly Software for USD 1.6 billion, adding asset-performance tools to Xcelerator.


Global Industrial Safety Market Report Scope
Industrial safety encompasses safety management practices tailored for the industrial sector. These processes are designed to safeguard industrial workers, structures, machinery, facilities, and the surrounding environment. Oversight of industrial safety is provided by state, federal, and local laws and regulations.
The study tracks the revenue accrued through the sale of industrial safety products by various players in the global market. The study also tracks the key market parameters, underlying growth influencers, and major vendors operating in the industry, which supports the market estimations and growth rates over the forecast period. The study further analyzes the overall impact of COVID-19 aftereffects and other macroeconomic factors on the market. The report’s scope encompasses market sizing and forecasts for the various market segments.
The industrial safety market is segmented by component (safety sensors, safety controllers/relays, safety valves, and other components), safety system (emergency shutdown systems (ESD), fire and gas monitoring systems, high integrity pressure protection systems (HIPPS), burner management systems (BMS), other safety systems), end-user industry (aerospace and defense, oil and gas, automotive, energy and power, metals and mining, pharmaceuticals and healthcare, food and beverage, chemical and petrochemical, and other end-user industries), and geography (North America, Europe, Asia-Pacific, Latin America, and Middle East & Africa). The report offers the market size in value terms in USD for all the abovementioned segments.
Segmentation Overview
| Safety Sensors |
| Safety Controllers and Relays |
| Safety Valves |
| Other Components |
| Emergency Shutdown (ESD) |
| Fire and Gas Monitoring |
| High Integrity Pressure Protection (HIPPS) |
| Burner Management Systems (BMS) |
| Other Safety Systems |
| Installation and Commissioning |
| Consulting and Training |
| Maintenance and Support |
| Testing and Inspection |
| SIL 1 |
| SIL 2 |
| SIL 3 |
| SIL 4 |
| Bottles And Jars | |
| Oil and Gas | Caps And Closures |
| Energy and Power | Bulk-Grade Products |
| Chemicals and Petrochemicals | Other Rigid Plastics Product Types |
| Metals and Mining | |
| Food and Beverage | Pouches |
| Pharmaceutical and Healthcare | Bags |
| Automotive | Films And Wraps |
| Aerospace and Defense | Other Flexible Plastics Product Types |
| Other End-user Industries |
| North America | United States |
| Canada | |
| Mexico | |
| South America | Brazil |
| Argentina | |
| Rest of South America | |
| Europe | United Kingdom |
| Germany | |
| France | |
| Italy | |
| Spain | |
| Rest of Europe | |
| Asia Pacific | China |
| Japan | |
| India | |
| South Korea | |
| Australia and New Zealand | |
| Southeast Asia | |
| Rest of Asia Pacific | |
| Middle East | Saudi Arabia |
| United Arab Emirates | |
| Turkey | |
| Rest of Middle East | |
| Africa | South Africa |
| Nigeria | |
| Rest of Africa |
| By Component | Safety Sensors | |
| Safety Controllers and Relays | ||
| Safety Valves | ||
| Other Components | ||
| By Safety System | Emergency Shutdown (ESD) | |
| Fire and Gas Monitoring | ||
| High Integrity Pressure Protection (HIPPS) | ||
| Burner Management Systems (BMS) | ||
| Other Safety Systems | ||
| By Service | Installation and Commissioning | |
| Consulting and Training | ||
| Maintenance and Support | ||
| Testing and Inspection | ||
| By Security Level (SIL) | SIL 1 | |
| SIL 2 | ||
| SIL 3 | ||
| SIL 4 | ||
| By End-user Industry | Bottles And Jars | |
| Oil and Gas | Caps And Closures | |
| Energy and Power | Bulk-Grade Products | |
| Chemicals and Petrochemicals | Other Rigid Plastics Product Types | |
| Metals and Mining | ||
| Food and Beverage | Pouches | |
| Pharmaceutical and Healthcare | Bags | |
| Automotive | Films And Wraps | |
| Aerospace and Defense | Other Flexible Plastics Product Types | |
| Other End-user Industries | ||
| By Geography | North America | United States |
| Canada | ||
| Mexico | ||
| South America | Brazil | |
| Argentina | ||
| Rest of South America | ||
| Europe | United Kingdom | |
| Germany | ||
| France | ||
| Italy | ||
| Spain | ||
| Rest of Europe | ||
| Asia Pacific | China | |
| Japan | ||
| India | ||
| South Korea | ||
| Australia and New Zealand | ||
| Southeast Asia | ||
| Rest of Asia Pacific | ||
| Middle East | Saudi Arabia | |
| United Arab Emirates | ||
| Turkey | ||
| Rest of Middle East | ||
| Africa | South Africa | |
| Nigeria | ||
| Rest of Africa | ||


Key Questions Answered in the Report
How big is the Industrial Safety market in 2026 and where is it heading?
The Industrial Safety market size stands at USD 6.73 billion in 2026 and is on track to reach USD 8.07 billion by 2031 at a 3.7% CAGR.
Which safety system captures the largest spend?
Emergency Shutdown platforms led with 37.62% of 2025 revenue, reflecting their entrenched role in refining and chemical facilities.
Which end-user segment will grow the quickest through 2031?
Pharmaceutical and healthcare facilities show the fastest 4.24% CAGR as FDA aseptic and serialization mandates require integrated interlocks.
Why are services outpacing hardware growth?
Lifecycle contracts covering proof testing, firmware updates, and SIL audits grow at 3.96% annually as operators prioritize uptime and compliance support.
Which region offers the strongest growth opportunity?
The Middle East registers a 4.19% CAGR, fueled by sovereign-fund investments in SIL-rated infrastructure under Saudi Arabia Vision 2030 and ADNOC expansions.
Page last updated on:


