Market Overview
| Study Period | 2018 - 2031 |
|---|---|
| Forecast Data Period | 2026 - 2031 |
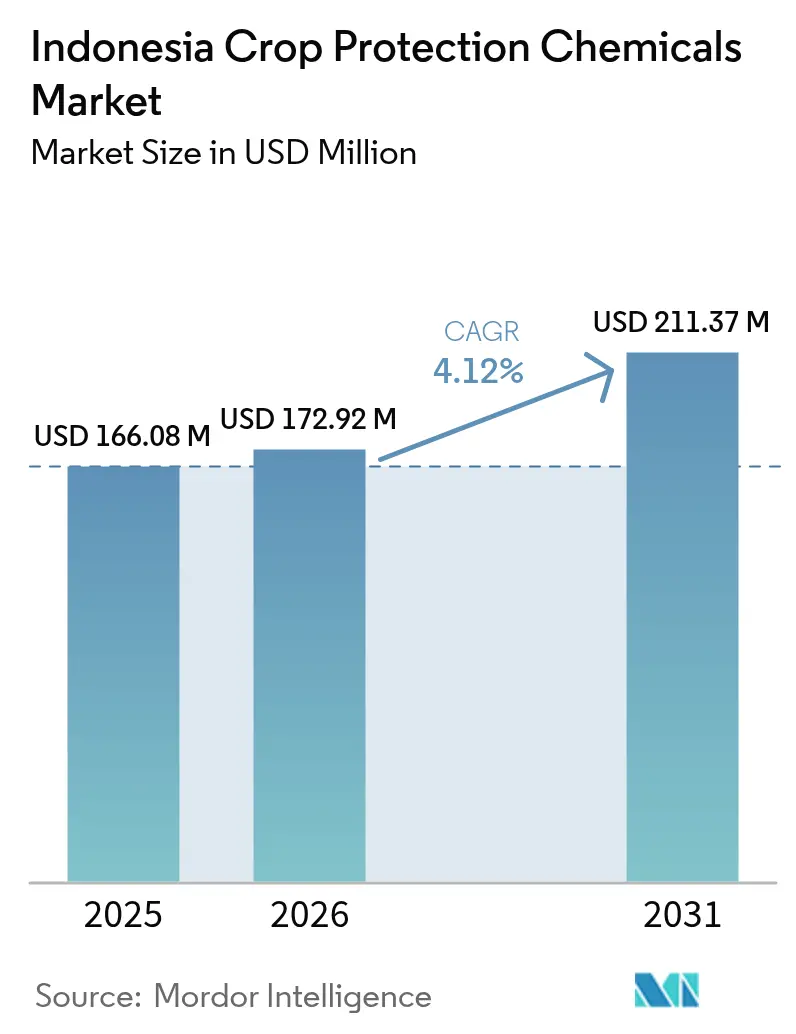
| Base Year Market Size (2025) | USD 166.08 Million |
| Market Size (2026) | USD 172.92 Million |
| Market Size (2031) | USD 211.37 Million |
| Growth Rate (2026 - 2031) | 4.12% CAGR |
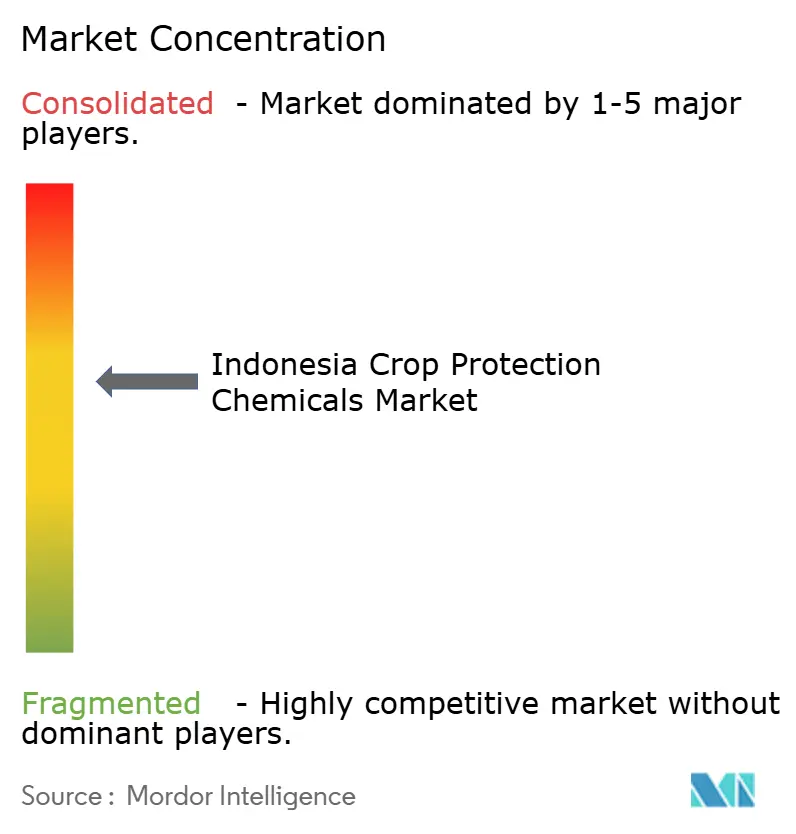
| Market Concentration | Medium |
Major Players *Disclaimer: Major Players sorted in no particular order Image © Mordor Intelligence. Reuse requires attribution under CC BY 4.0. | |
Indonesia Crop Protection Chemicals Market Analysis by Mordor Intelligence
The Indonesia crop protection chemicals market size is expected to grow from USD 166.08 million in 2025 to USD 172.92 million in 2026 and is forecast to reach USD 211.37 million by 2031 at 4.12% CAGR over 2026-2031. Rising herbicide adoption in oil-palm plantations, re-aligned government subsidies that bundle pesticides with fertilizers, and contract farming expansion underpin near-term demand while price-competitive generics and digital delivery platforms shape competitive dynamics. Precision application technologies, carbon-credit incentives for low-tillage practices, and stringent residue standards from export partners are restructuring product portfolios and distribution models across the Indonesia crop protection chemicals market. The insecticide category retains a dominant revenue position, yet robust mechanization and labor scarcity drive the herbicide segment’s outperformance. In parallel, soil treatment products gain traction as conservation agriculture spreads, reinforcing a gradual pivot from foliar-only regimes. Supply chain resilience, counterfeit mitigation, and regulatory compliance remain board-level priorities for both multinationals and local formulators as the Indonesia crop protection chemicals market moves toward sustainable intensification.
Key Report Takeaways
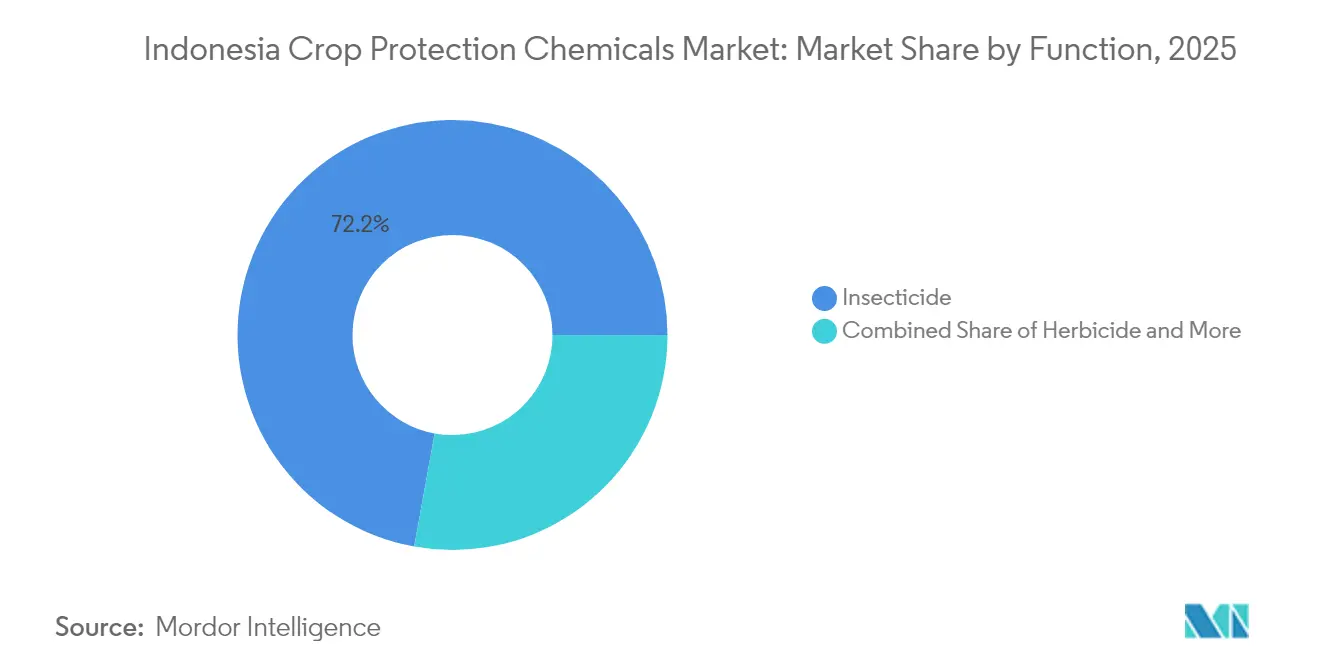
- By function, insecticides led with 72.15% of the Indonesia crop protection chemicals market share in 2025, while herbicides are projected to advance at a 6.28% CAGR through 2031.
- By application mode, foliar products accounted for 53.25% of the Indonesia crop protection chemicals market size in 2025, while soil treatments record the fastest growth at a 5.06% CAGR to 2031.
- By crop type, pulses and oilseeds captured 46.25% revenue share of the Indonesia crop protection chemicals market size in 2025 and are forecast to expand at a 4.21% CAGR between 2026-2031.
Note: Market size and forecast figures in this report are generated using Mordor Intelligence’s proprietary estimation framework, updated with the latest available data and insights as of 2026.
Indonesia Crop Protection Chemicals Market Trends and Insights
Drivers Impact Analysis*
| Driver | (~) % Impact on CAGR Forecast | Geographic Relevance | Impact Timeline |
|---|---|---|---|
| Rising herbicide adoption in oil-palm plantations | +0.8% | Sumatra and Kalimantan expanding to Papua | Medium term (2-4 years) |
| Government fertilizer subsidy re-allocation toward crop protection | +0.6% | National with Java and Sumatra focus | Short term (≤ 2 years) |
| Expansion of contract farming models by food processors | +0.5% | Java and North Sumatra extending nationally | Medium term (2-4 years) |
| Mainstream adoption of herbicide-tolerant rice hybrids | +0.4% | Java, South Sumatra, and Sulawesi | Long term (≥ 4 years) |
| Surge in ag-ecommerce platforms offering last-mile pesticide delivery | +0.3% | Urban-adjacent farming hubs in Java | Short term (≤ 2 years) |
| Carbon-credit incentives for low-tillage chemical weed control | +0.2% | Pilot palm estates in Java and Sumatra | Long term (≥ 4 years) |
| Source: Mordor Intelligence | |||
Rising Herbicide Adoption in Oil-Palm Plantations
Oil-palm growers in Sumatra and Kalimantan are replacing labor-intensive manual weeding with chemical regimes that cut costs and ensure uniform field hygiene. The national biodiesel blending mandate sustains domestic palm oil demand, prompting estates to replant aging trees and rely on selective herbicides during the vulnerable juvenile phase. Drone spraying services enable variable-rate applications that meet the Roundtable on Sustainable Palm Oil certification, anchoring stable herbicide purchases across the Indonesia crop protection chemicals market.[1]Source: Organisation for Economic Co-operation and Development and Food and Agriculture Organization of the United Nations, “OECD-FAO Agricultural Outlook 2024-2033,” oecd.org
Government Fertilizer Subsidy Re-allocation Toward Crop Protection
Jakarta’s pivot from fertilizer-only aid to integrated input packages channels part of PT Pupuk Indonesia’s USD 6.4 billion capital plan into domestic pesticide production and subsidized rural sales. Co-ops now distribute bundled fertilizers and pesticides, shifting farmer purchasing patterns toward state-endorsed brands and disrupting private dealer dominance. Rapid product access accelerates penetration of the Indonesia crop protection chemicals market in remote districts.
Expansion of Contract Farming Models by Food Processors
Indofood and Wilmar International embed pesticide protocols in smallholder contracts, guaranteeing residue compliance for export-oriented vegetables and spices. Input financing within these agreements unlocks premium crop protection products for farmers who previously bought generic formulations only when cash allowed. The model propels predictable volumes and data-driven demand across the Indonesia crop protection chemicals market.
Mainstream Adoption of Herbicide-Tolerant Rice Hybrids
Padjadjaran University trials demonstrated that glyphosate-based weed control systems achieved higher yields in no-tillage upland rice cultivation while significantly reducing labor requirements and fuel consumption. Extension agents actively promote these hybrid varieties to local farmers, driving increased selective herbicide sales and ancillary equipment demand throughout the region. These developments continue to strengthen Indonesia's crop protection chemicals market, particularly in the rice farming segment.
Restraints Impact Analysis*
| Restraint | (~) % Impact on CAGR Forecast | Geographic Relevance | Impact Timeline |
|---|---|---|---|
| Intensifying counterfeit pesticide trade | −0.5% | Border districts and remote islands | Short term (≤ 2 years) |
| Price volatility of imported technical ingredients | −0.4% | Nationwide | Medium term (2-4 years) |
| Stricter maximum residue limits from export partners | −0.3% | Export-oriented clusters | Long term (≥ 4 years) |
| Rising consumer push for organic certification | −0.2% | Urban fringe high-value crops | Long term (≥ 4 years) |
| Source: Mordor Intelligence | |||
Intensifying Counterfeit Pesticide Trade
Sophisticated counterfeiters exploit porous maritime borders and limited lab capacity. Substandard blends damage crops and breed resistance, eroding farmer trust and legitimate sales. BPOM’s 2024 e-commerce regulation tightens online oversight, but enforcement gaps persist in remote markets, tempering near-term gains for the Indonesia crop protection chemicals market.[2]Source: Badan Pengawas Obat dan Makanan, “Peraturan BPOM No. 14/2024,” peraturan.bpk.go.id
Price Volatility of Imported Technical Ingredients
Currency swings and shipping disruptions expose local formulators to input cost spikes. Propargite technical imports fluctuated to USD 8.50 per kilogram in March 2024, squeezing margins. Manufacturers rethink sourcing strategies and hedge currency, yet price instability still weighs on the Indonesia crop protection chemicals market.
*Our forecasts treat driver/restraint impacts as directional, not additive. The impact forecasts reflect baseline growth, mix effects, and variable interactions.
Segment Analysis
By Function: Insecticides Retain Leadership amid Robust Herbicide Momentum
Indonesia crop protection chemicals market size for insecticides accounted for 72.15% revenue in 2025, driven by perpetual pest pressure in humid tropics. High biodiversity sustains complex insect populations that attack rice, palm, and horticultural crops. Continuous rice planting without winter dormancy requires year-round insecticide sprays, ensuring a stable baseline demand. Companies respond with rotation programs and premixed products that deter resistance and simplify application for smallholders. Generics dominate volume, yet patented molecule introductions in 2025 spotlight resistance-breaking modes of action.
Herbicides capture a rising share on the back of mechanization and labor-scarcity economics. A 6.28% CAGR through 2031 positions herbicides as the fastest-growing category in the Indonesia crop protection chemicals market. Plantation managers deploy systemic herbicides during replanting cycles, while smallholders embrace selective products compatible with herbicide-tolerant rice hybrids. Government extension modules combine chemical and cultural methods to avoid resistance, supporting stewardship and sustained growth.


By Application Mode: Foliar Dominance Accompanies Soil-Treatment Upswing
Foliar products generated 53.25% of 2025 revenue, reflecting entrenched farmer familiarity and efficacy against above-ground pests. Continuous canopy cover in rice and palm warrants multiple foliar passes, enabling market stability. Multinationals differentiate via drift-reducing adjuvants and drone-optimized formulations that ensure coverage under variable wind and humidity conditions.
Soil treatments register 5.06% CAGR, underpinned by no-tillage adoption and heightened awareness of soil-borne pathogen management. Seed treatments rise as hybrid seed penetration improves, offering early-season protection that reduces subsequent spray frequency. Conservation agriculture incentives under Indonesia’s climate-smart farming roadmap encourage herbicide-based soil solutions, expanding the addressable base for the Indonesia crop protection chemicals market.
By Crop Type: Pulses and Oilseeds Anchor Diversification
Pulses and oilseeds accounted for 46.25% of 2025 revenue, reflecting rising domestic soybean demand and export-oriented peanut production. Protein self-sufficiency policies encourage growers to expand acreage and adopt input-intensive management. Integrated pest management toolkits designed for legumes and oilseeds include pre-emergence herbicides, systemic insecticides, and biological seed coatings, amplifying category growth at 4.21% CAGR.
Grains and cereals remain foundational despite slower growth, while fruits and vegetables sustain premium pesticide usage per hectare owing to cosmetic standards and export protocol compliance. Commercial crops such as sugarcane contend with price volatility, and turf and ornamentals stay niche around hospitality centers. Overall, crop diversification supports balanced revenue streams within the Indonesia crop protection chemicals market.

Geography Analysis
Java contributes the lion’s share of the Indonesia crop protection chemicals market, given its dense rural population, intensive rice double-cropping, and robust dealer network. Reliable port infrastructure and shorter delivery routes lower logistics costs, making premium branded formulations more accessible. Provincial extension offices execute large-scale demonstration plots that accelerate new product adoption and provide continuous training on resistance management.
Sumatra registers the fastest pace of growth as oil-palm expansion and replanting accelerate pesticide demand. The Trans-Sumatra Highway reduces transit times, enabling distributors to reach estates previously served only by seasonal ferries. Estate-level procurement consolidates orders into high-volume contracts, favoring suppliers with integrated warehousing and on-site technical advisory services. Insecticides secure core volumes, but herbicides lead incremental gains due to intensified weed pressure post-replanting.
Kalimantan and Sulawesi emerge as opportunity zones as transmigration programs relocate farmers and allocate new cropland. Limited agro-dealer density prompts companies to establish mobile depots and leverage digital ordering to ensure timely supply. Papua and Maluku remain frontier territories with low pesticide penetration. Government infrastructure projects and planned agri-industrial corridors signal long-term upside for the Indonesia crop protection chemicals market.
Competitive Landscape
The Indonesia crop protection chemicals market exhibits moderate concentration, with the top five vendors capturing the majority share of 2024 revenue. UPL Limited employs a cost-leadership strategy built on broad generic portfolios and aggressive pricing, dominating rural shelf space. Bayer AG leverages integrated seeds and traits that link herbicide-tolerant crops with proprietary chemistries, strengthening brand stickiness. Syngenta Group differentiates via the Cropwise digital platform and drone-compatible formulations, carving a premium share in large estates.
FMC Corporation and BASF SE focus on resistance-management activities and stewardship programs that resonate with contract farming schemes demanding traceability. Local challengers PT Biotis Agrindo and PT Petrokimia Gresik benefit from government procurement linkages and subsidy channels, narrowing distribution cost gaps with multinationals. Chinese suppliers capitalize on competitive pricing for technical ingredients, partnering with Indonesian formulators to penetrate price-sensitive smallholder segments.
Technology leadership becomes the decisive battleground. Companies invest in analytics-driven advisory apps, IoT pest traps, and drone fleets that guarantee precise placement and reduced labor. Compliance capabilities, especially rapid residue testing and digital documentation, further distinguish leading brands in the Indonesia crop protection chemicals market.
Indonesia Crop Protection Chemicals Industry Leaders
Bayer AG
FMC Corporation
Syngenta Group
UPL limited
BASF SE
- *Disclaimer: Major Players sorted in no particular order

Recent Industry Developments
- October 2025: PT Biotis Agrindo introduced a dual-active ingredient crop protection solution in Tegalsari Lor, Purwoasri Village, aiming to enhance pest control effectiveness and support sustainable farming practices. The initiative also included farmer education and field demonstrations to promote responsible pesticide use.
- September 2025: BASF introduced Efficon Insecticide in Indonesia, which contains IRAC Group 36 chemistry for controlling mealybugs, scale pests, and whiteflies in fruit and vegetable crops. The product, containing Axalion Active, provides extended pest control and aligns with sustainable agricultural practices.


Indonesia Crop Protection Chemicals Market Report Scope
Fungicide, Herbicide, Insecticide, Molluscicide, Nematicide are covered as segments by Function. Chemigation, Foliar, Fumigation, Seed Treatment, Soil Treatment are covered as segments by Application Mode. Commercial Crops, Fruits & Vegetables, Grains & Cereals, Pulses & Oilseeds, Turf & Ornamental are covered as segments by Crop Type.Function
| Fungicide |
| Herbicide |
| Insecticide |
| Molluscicide |
| Nematicide |
Application Mode
| Chemigation |
| Foliar |
| Fumigation |
| Seed Treatment |
| Soil Treatment |
Crop Type
| Commercial Crops |
| Fruits and Vegetables |
| Grains and Cereals |
| Pulses and Oilseeds |
| Turf and Ornamental |
| Function | Fungicide |
| Herbicide | |
| Insecticide | |
| Molluscicide | |
| Nematicide | |
| Application Mode | Chemigation |
| Foliar | |
| Fumigation | |
| Seed Treatment | |
| Soil Treatment | |
| Crop Type | Commercial Crops |
| Fruits and Vegetables | |
| Grains and Cereals | |
| Pulses and Oilseeds | |
| Turf and Ornamental |


Market Definition
- Function - Crop Protection Chemicals are apllied to control or prevent pests, including insects, fungi, weeds, nematodes, and mollusks, from damaging the crop and to protect the crop yield.
- Application Mode - Foliar, Seed Treatment, Soil Treatment, Chemigation, and Fumigation are the different type of application modes through which crop protection chemicals are applied to the crops.
- Crop Type - This represents the consumption of crop protection chemicals by Cereals, Pulses, Oilseeds, Fruits, Vegetables, Turf, and Ornamental crops.
| Keyword | Definition |
|---|---|
| IWM | Integrated weed management (IWM) is an approach to incorporate multiple weed control techniques throughout the growing season to give producers the best opportunity to control problematic weeds. |
| Host | Hosts are the plants that form relationships with beneficial microorganisms and help them colonize. |
| Pathogen | A disease-causing organism. |
| Herbigation | Herbigation is an effective method of applying herbicides through irrigation systems. |
| Maximum residue levels (MRL) | Maximum Residue Limit (MRL) is the maximum allowed limit of pesticide residue in food or feed obtained from plants and animals. |
| IoT | The Internet of Things (IoT) is a network of interconnected devices that connect and exchange data with other IoT devices and the cloud. |
| Herbicide-tolerant varieties (HTVs) | Herbicide-tolerant varieties are plant species that have been genetically engineered to be resistant to herbicides used on crops. |
| Chemigation | Chemigation is a method of applying pesticides to crops through an irrigation system. |
| Crop Protection | Crop protection is a method of protecting crop yields from different pests, including insects, weeds, plant diseases, and others that cause damage to agricultural crops. |
| Seed Treatment | Seed treatment helps to disinfect seeds or seedlings from seed-borne or soil-borne pests. Crop protection chemicals, such as fungicides, insecticides, or nematicides, are commonly used for seed treatment. |
| Fumigation | Fumigation is the application of crop protection chemicals in gaseous form to control pests. |
| Bait | A bait is a food or other material used to lure a pest and kill it through various methods, including poisoning. |
| Contact Fungicide | Contact pesticides prevent crop contamination and combat fungal pathogens. They act on pests (fungi) only when they come in contact with the pests. |
| Systemic Fungicide | A systemic fungicide is a compound taken up by a plant and then translocated within the plant, thus protecting the plant from attack by pathogens. |
| Mass Drug Administration (MDA) | Mass drug administration is the strategy to control or eliminate many neglected tropical diseases. |
| Mollusks | Mollusks are pests that feed on crops, causing crop damage and yield loss. Mollusks include octopi, squid, snails, and slugs. |
| Pre-emergence Herbicide | Preemergence herbicides are a form of chemical weed control that prevents germinated weed seedlings from becoming established. |
| Post-emergence Herbicide | Postemergence herbicides are applied to the agricultural field to control weeds after emergence (germination) of seeds or seedlings. |
| Active Ingredients | Active ingredients are the chemicals in pesticide products that kill, control, or repel pests. |
| United States Department of Agriculture (USDA) | The Department of Agriculture provides leadership on food, agriculture, natural resources, and related issues. |
| Weed Science Society of America (WSSA) | The WSSA, a non-profit professional society, promotes research, education, and extension outreach activities related to weeds. |
| Suspension concentrate | Suspension concentrate (SC) is one of the formulations of crop protection chemicals with solid active ingredients dispersed in water. |
| Wettable powder | A wettable powder (WP) is a powder formulation that forms a suspension when mixed with water prior to spraying. |
| Emulsifiable concentrate | Emulsifiable concentrate (EC) is a concentrated liquid formulation of pesticide that needs to be diluted with water to create a spray solution. |
| Plant-parasitic nematodes | Parasitic Nematodes feed on the roots of crops, causing damage to the roots. These damages allow for easy plant infestation by soil-borne pathogens, which results in crop or yield loss. |
| Australian Weeds Strategy (AWS) | The Australian Weeds Strategy, owned by the Environment and Invasives Committee, provides national guidance on weed management. |
| Weed Science Society of Japan (WSSJ) | WSSJ aims to contribute to the prevention of weed damage and the utilization of weed value by providing the chance for research presentation and information exchange. |


Research Methodology
Mordor Intelligence follows a four-step methodology in all our reports.
- Step-1: Identify Key Variables: In order to build a robust forecasting methodology, the variables and factors identified in Step-1 are tested against available historical market numbers. Through an iterative process, the variables required for market forecast are set and the model is built on the basis of these variables.
- Step-2: Build a Market Model: Market-size estimations for the forecast years are in nominal terms. Inflation is not a part of the pricing, and the average selling price (ASP) is kept constant throughout the forecast period.
- Step-3: Validate and Finalize: In this important step, all market numbers, variables and analyst calls are validated through an extensive network of primary research experts from the market studied. The respondents are selected across levels and functions to generate a holistic picture of the market studied.
- Step-4: Research Outputs: Syndicated Reports, Custom Consulting Assignments, Databases & Subscription Platforms


