Technology, Media and Telecom
5th MayPricing Strategy for Semiconductor Components
3 Min Read
The India Payments Market Report is Segmented by Mode of Payment (Point of Sale, Online), Interaction Channel (Point-Of-Sale, E-commerce/M-commerce), Transaction Type (P2P, C2B, B2B, Remittances and Cross-Border), End-User Industry (Retail, Entertainment and Digital Content, Healthcare, Hospitality & Travel, and More). The Market Forecasts are Provided in Terms of Value (USD).
Market Overview
| Study Period | 2019 - 2030 |
|---|---|
| Base Year For Estimation | 2024 |
| Forecast Data Period | 2025 - 2030 |
| Market Size (2025) | USD 409.91 Billion |
| Market Size (2030) | USD 958.14 Billion |
| Growth Rate (2025 - 2030) | 18.51 % CAGR |
| Market Concentration | High |
Major Players *Disclaimer: Major Players sorted in no particular order. Image © Mordor Intelligence. Reuse requires attribution under CC BY 4.0. |
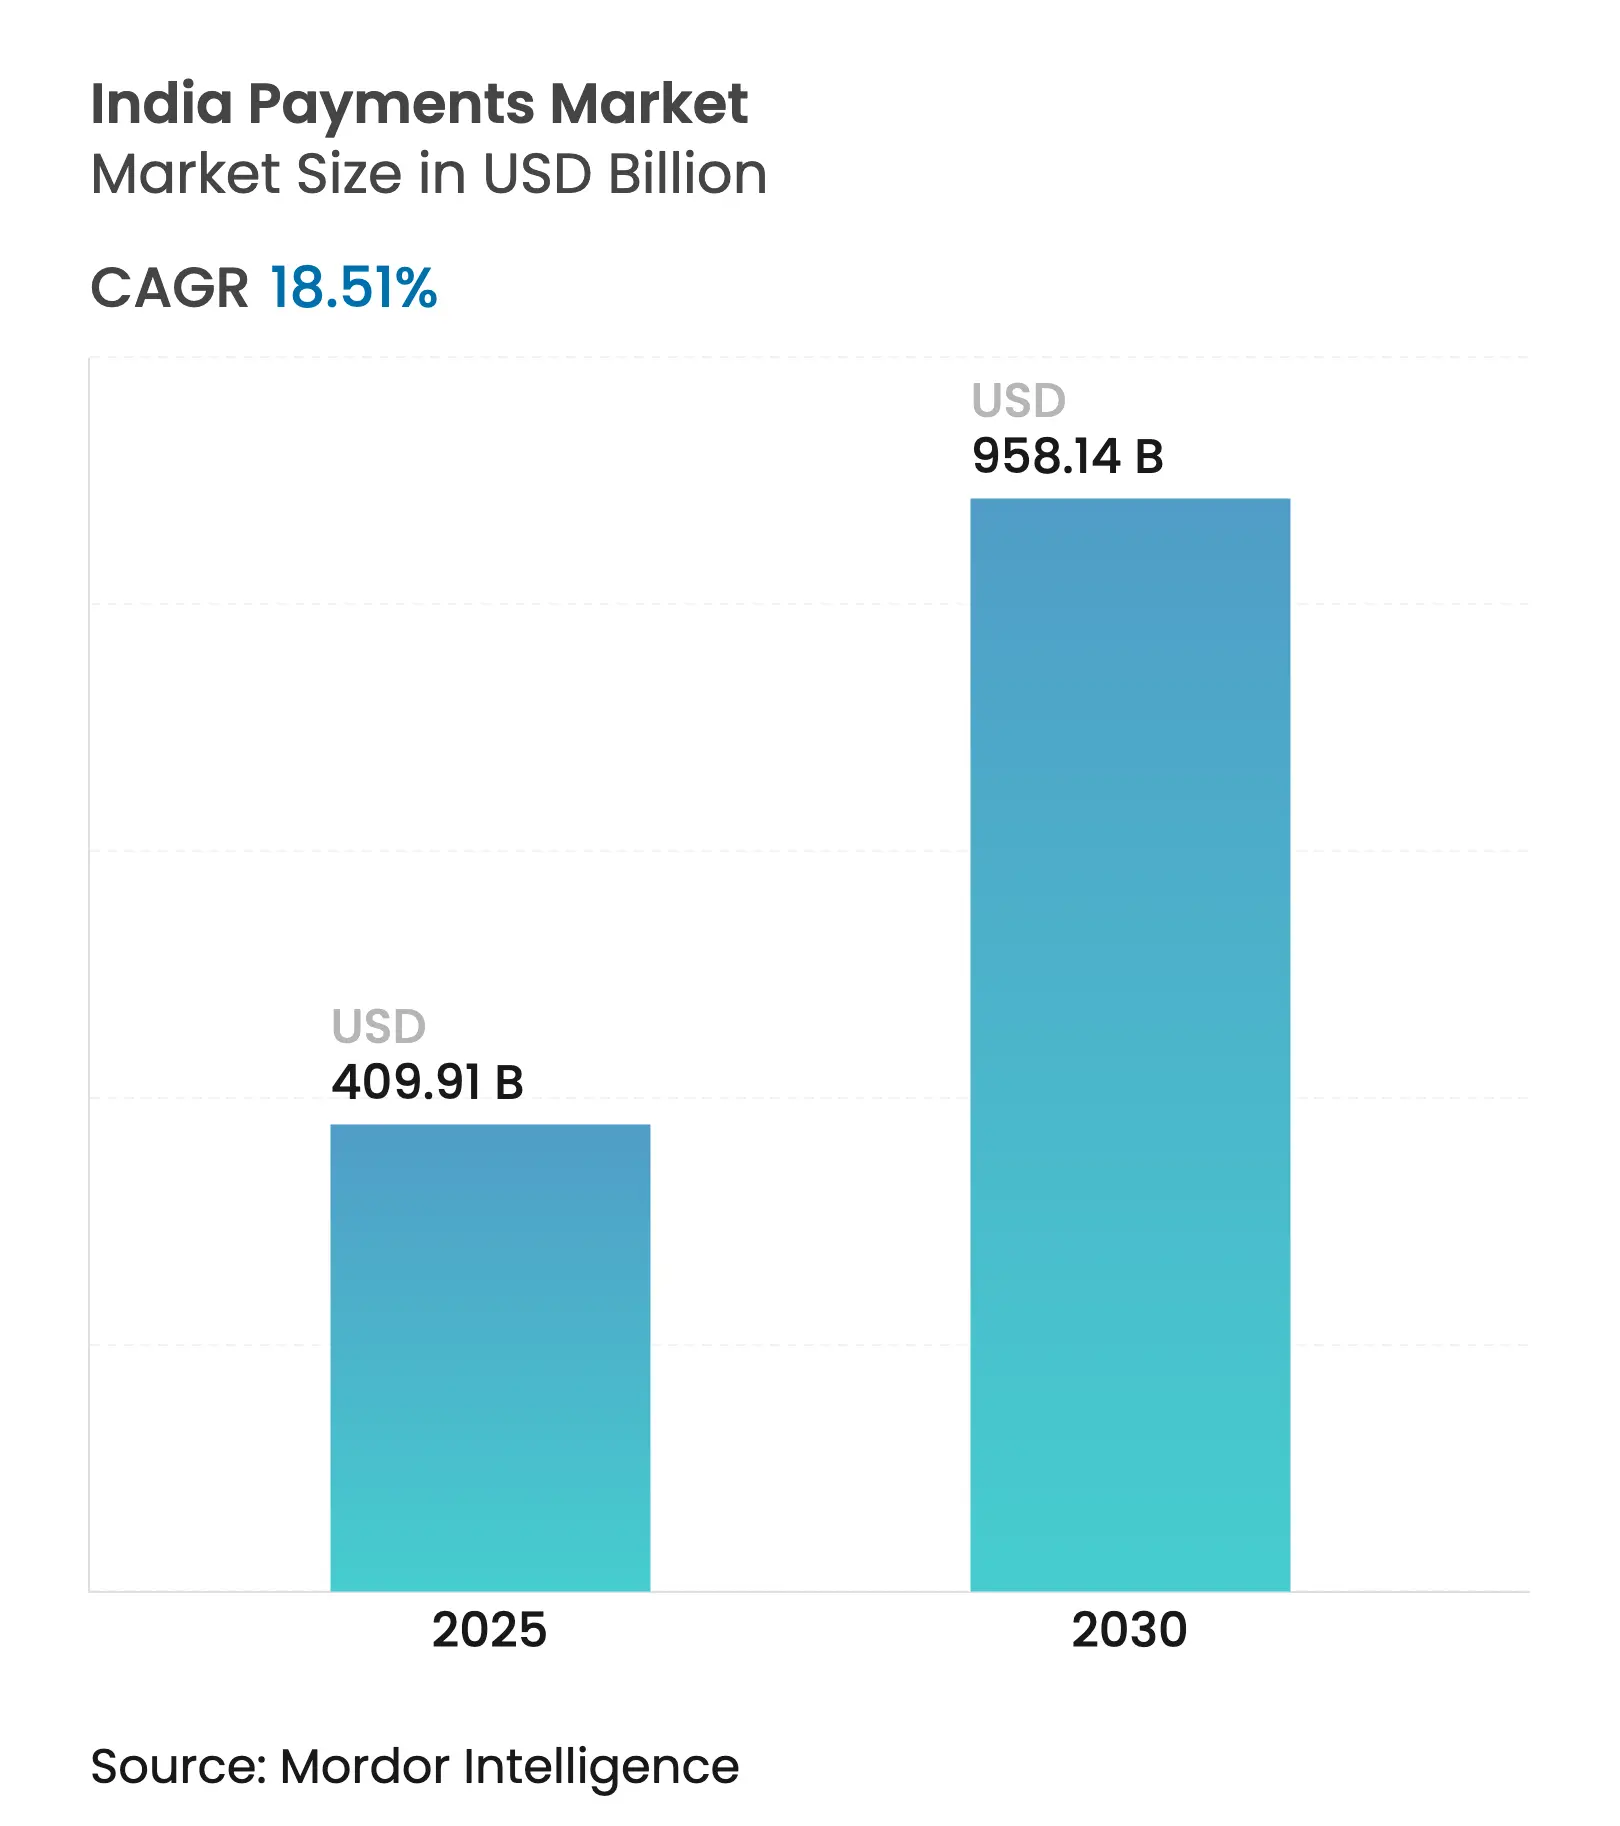
The India payments market stands at USD 409.91 billion in 2025 and is on course to reach USD 958.14 billion by 2030, reflecting an 18.51% CAGR. Expansion is anchored by record Unified Payments Interface (UPI) volumes, rising smartphone ownership, and sustained policy support for cash-lite transactions. UPI handled INR 24.77 lakh crore (USD 297.24 billion) in March 2025 alone, a 25% value jump from March 2024. Momentum is further amplified by Aadhaar-enabled onboarding, QR penetration across micro-merchants, and the introduction of instant settlement variants such as UPI Lite and UPI 123PAY. Growing acceptance of contactless Near Field Communication (NFC) cards, surging subscription-based digital services, and enterprise demand for embedded B2B payment flows add supplementary lift to the India payments market.
Key Report Takeaways
Drivers Impact Analysis
| Driver | (~) % Impact on CAGR Forecast | Geographic Relevance | Impact Timeline | |||
|---|---|---|---|---|---|---|
Expansion of UPI-QR Acceptance Across MSME Merchants
Expansion of UPI-QR Acceptance Across MSME Merchants
| +4.5% | National, with stronger impact in Tier 2 and Tier 3 cities | Medium term (2-4 years) |
(~) % Impact on CAGR Forecast
:
+4.5%
|
Geographic Relevance
:
National, with stronger impact in Tier 2 and Tier 3 cities
|
Impact Timeline
:
Medium term (2-4 years)
|
Government's Digital Public Infrastructure Accelerating
On-Boarding
Government's Digital Public Infrastructure Accelerating
On-Boarding
| +3.8% | National, with emphasis on rural and semi-urban areas | Medium term (2-4 years) | |||
Surging Subscription-based Digital Services (OTT, Ed-tech)
Boosting Recurring e-Mandates
Surging Subscription-based Digital Services (OTT, Ed-tech)
Boosting Recurring e-Mandates
| +3.2% | Urban centers, gradually expanding to Tier 2 cities | Short term (≤ 2 years) | |||
Growth of Contactless NFC Cards
Growth of Contactless NFC Cards
| +2.5% | Metropolitan areas, with gradual adoption in Tier 2 cities | Medium term (2-4 years) | |||
Instant Settlement Schemes (UPI-Lite, UPI 123Pay)
Enhancing Rural Adoption
Instant Settlement Schemes (UPI-Lite, UPI 123Pay)
Enhancing Rural Adoption
| +2.1% | Rural and semi-urban areas | Long term (≥ 4 years) | |||
Fin-tech/Bank Partnerships for Embedded Payments in B2B
Commerce
Fin-tech/Bank Partnerships for Embedded Payments in B2B
Commerce
| +1.8% | National, with initial concentration in industrial hubs | Medium term (2-4 years) | |||
| Source: Mordor Intelligence | ||||||
Expansion of UPI-QR Acceptance Across MSME Merchants
QR codes now drive more than 62% of UPI volume, extending formal payments to cash-orientated micro-businesses. P2M transactions reached 62.35% of UPI traffic in January 2025, with 86% of tickets valued at INR 500 (USD 6) or less. A INR 1,500 crore (USD 180 million) incentive covering FY 2024-25 awards 0.15% on sub-INR 2,000 tickets to accelerate MSME adoption.[1]Press Information Bureau, “Advancing Cashless India,” pib.gov.in The resulting network effect expands acceptance points and entrenches low-value digital habits that lift the India payments market.
Government's Digital Public Infrastructure Accelerating On-Boarding
Aadhaar-linked e-KYC, 641 connected banks, and more than 80 UPI apps simplify customer activation at scale. Rural digital payment usage climbed to 46% of residents by January 2025. Establishment of a Payments Regulatory Board with ministerial representation underscores state commitment to resilient public rails. These measures collectively widen inclusion, strengthening transaction depth across the India payments market.
Surging Subscription-Based Digital Services Boosting Recurring E-Mandates
OTT, ed-tech, and content platforms enlarge the recurring payments base, aided by a raised INR 15,000 (USD 180) no-authentication cap. Digital entertainment revenue is projected at INR 1,107 billion (USD 13 billion) by 2027.[2]Ministry of Information and Broadcasting, “Digital Media Market Report 2025,” mib.gov.in Automated e-mandates nurture habitual digital spend and improve retention, adding predictable flow to the India payments market.
Growth of Contactless NFC Cards
Contactless taps represented 45% of in-store transactions during 2024. RBI removed second-factor checks for sub-INR 5,000 (USD 60) NFC payments, enhancing checkout speed. Hybrid card-plus-UPI propositions combine tokenized security with mobile convenience, raising urban adoption curves and diversifying instrument mix across the India payments market.
Restraints Impact Analysis
| Restraint | (~) % Impact on CAGR Forecast | Geographic Relevance | Impact Timeline | |||
|---|---|---|---|---|---|---|
Regulatory Caps on Merchant Discount Rate (MDR)
Compressing Revenues
Regulatory Caps on Merchant Discount Rate (MDR)
Compressing Revenues
| -2.8% | National | Medium term (2-4 years) |
(~) % Impact on CAGR Forecast
:
-2.8%
|
Geographic Relevance
:
National
|
Impact Timeline
:
Medium term (2-4 years)
|
Escalating Fraud/Cyber-security Incidents in UPI Ecosystem
Escalating Fraud/Cyber-security Incidents in UPI Ecosystem
| -2.3% | National, with higher impact in urban areas | Short term (≤ 2 years) | |||
Mandatory Data-Localisation Increasing Opex for Global
Networks
Mandatory Data-Localisation Increasing Opex for Global
Networks
| -1.9% | National, with particular impact on international payment providers | Medium term (2-4 years) | |||
Intermittent UPI Downtimes Affecting User Experience
Intermittent UPI Downtimes Affecting User Experience
| -1.5% | National, with higher impact during peak transaction periods | Short term (≤ 2 years) | |||
| Source: Mordor Intelligence | ||||||
Regulatory Caps on Merchant Discount Rate Compressing Revenues
The zero-MDR regime introduced in 2020 removes fee income for service providers, trimming an estimated INR 5,500 crore (USD 660 million) annually.[3]Financial Express, “Zero MDR Policy Causing Annual Revenue Loss,” financialexpress.com Policy discussion now evaluates a 0.2%-0.3% MDR for large merchants. Absent relief, operators face constrained margins that could slow reinvestment in infrastructure, tempering the India payments market’s growth trajectory.
Escalating Fraud/Cyber-Security Incidents in UPI Ecosystem
RBI recorded 14,483 fraud cases involving INR 2,642 crore (USD 316 million) in H1 FY24. Authorized push-payment scams rose to 25% of fraud mix by 2022. The Financial Fraud Risk Indicator and e-Zero FIR initiative aim to curb abuse, yet rising attack sophistication can erode user trust, hindering volume expansion within the India payments market.
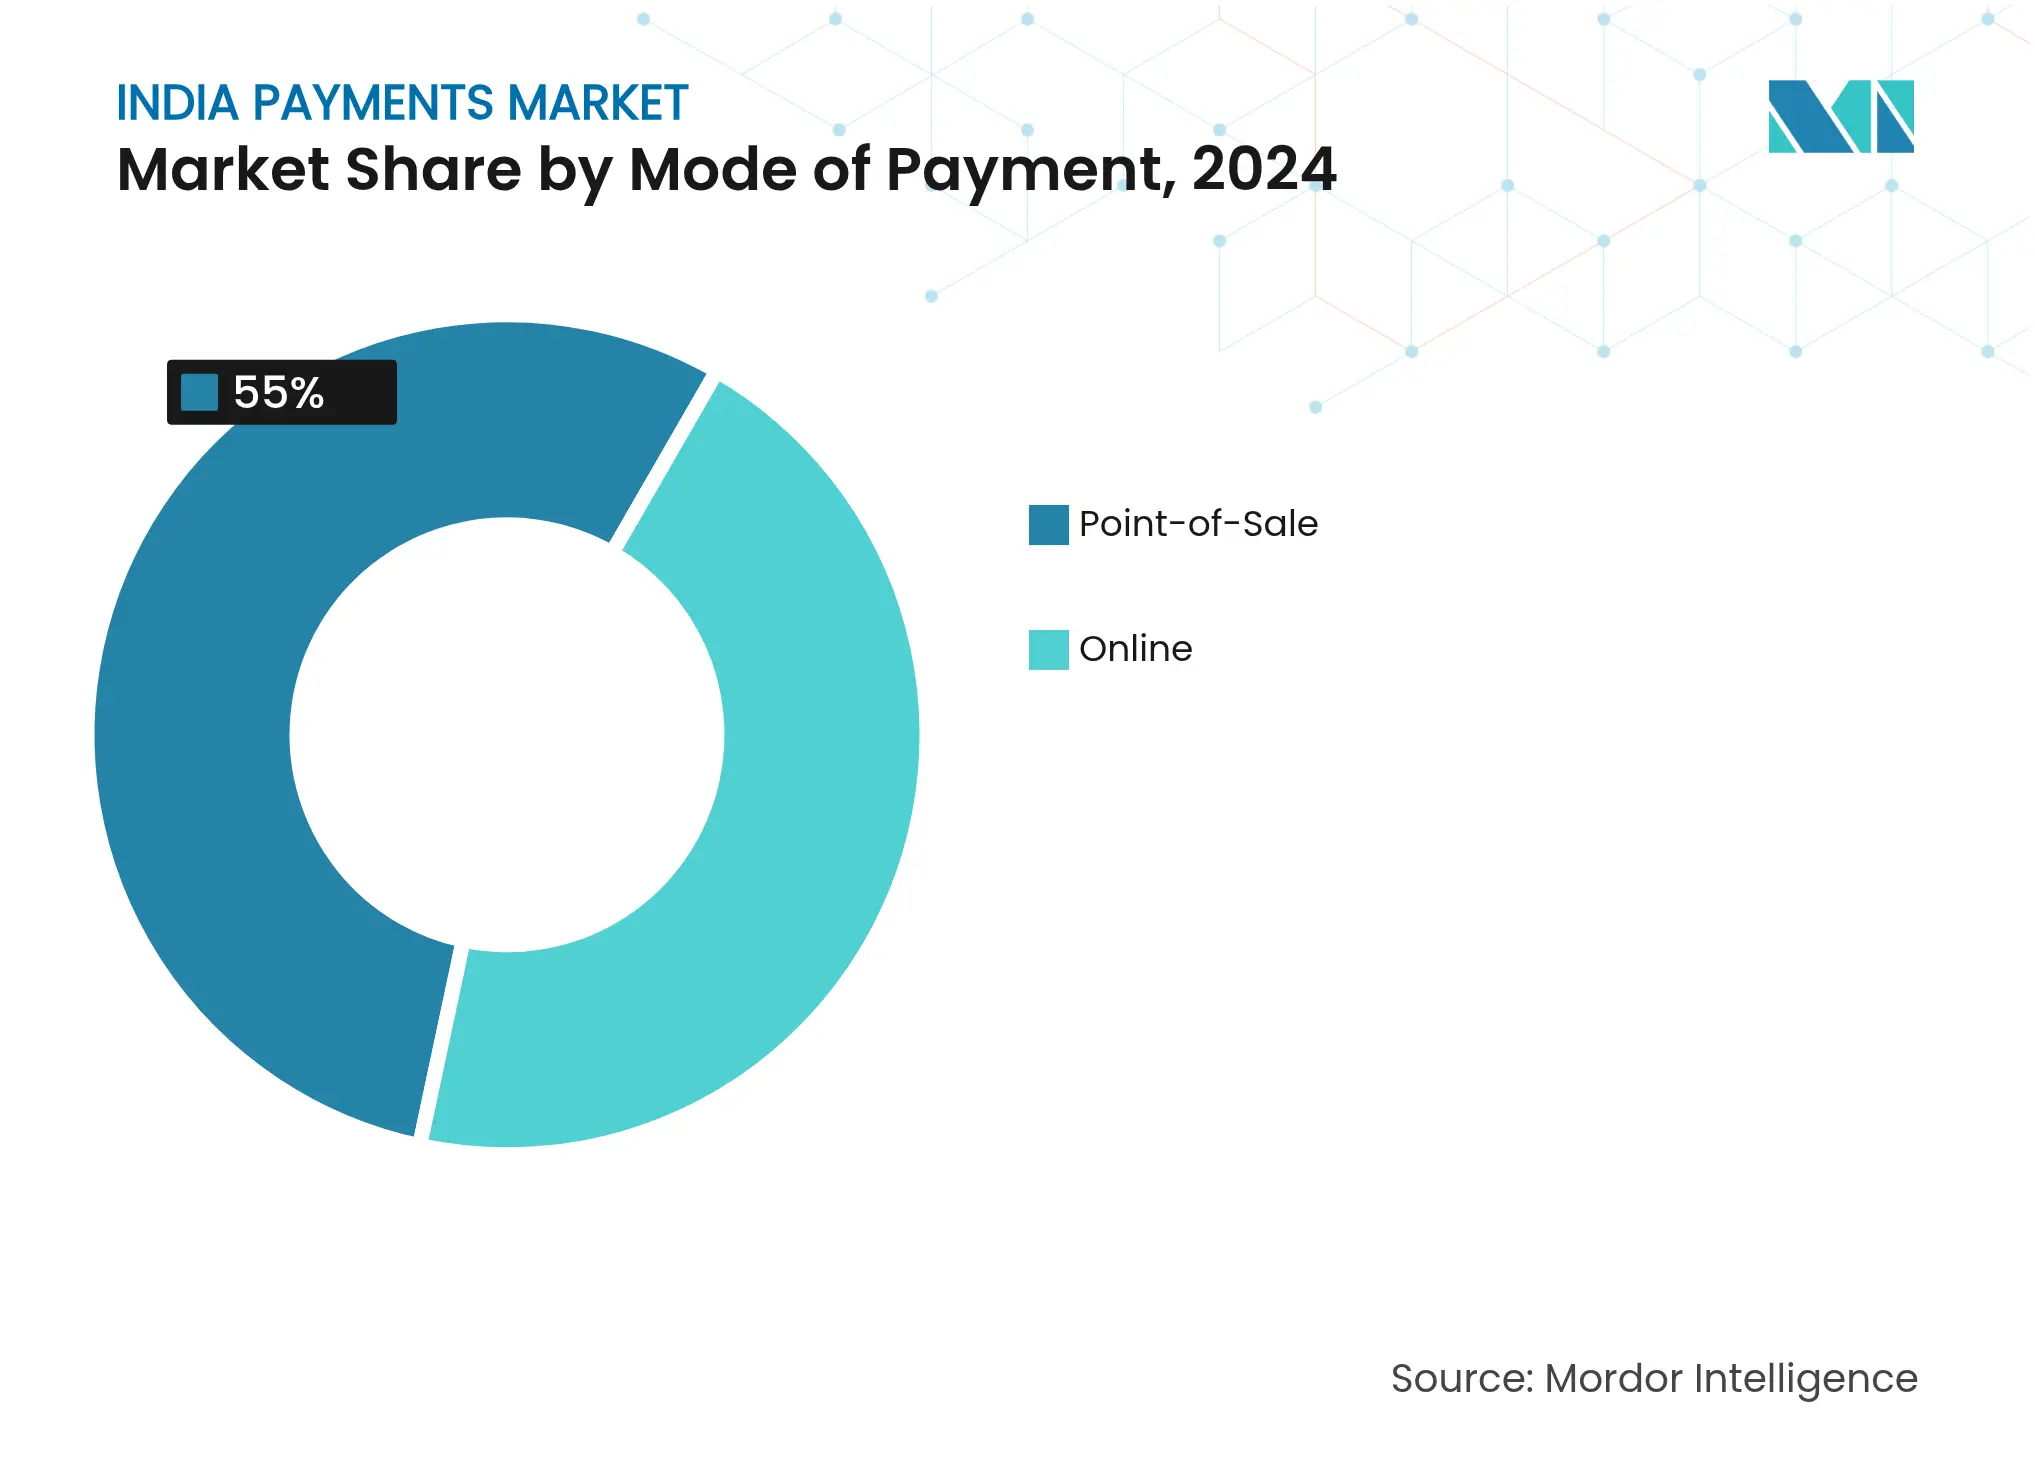
By Mode of Payment: Card-Not-Present Sustains Leadership
Card-not-present flows held a commanding 60% share of the India payments market in 2024, reflecting entrenched e-commerce behaviour and the security lift from tokenisation. Overall Point-of-Sale led with 55% revenue share. The segment’s depth underscores a preference for frictionless checkout while large-ticket physical purchases still lean on POS credentials. Digital wallet and account-to-account options outpace at a 27.5% CAGR to 2030, catalysed by UPI’s record INR 24.77 lakh crore (USD 297.24 billion) monthly volume. Regulatory support for one-click mandates tightens wallet stickiness, raising the India payments market size allocated to mobile-native rails.
Traditional POS cards remain relevant for premium categories, but hybrid constructs such as UPI-linked credit cards blur distinctions and shift value away from mag-stripe hardware. Cash usage persists in several semi-urban nodes, signalling an adoption curve still aligned with connectivity gaps. Yet consistent wallet incentives and QR ubiquity chip away at cash preferences, steadily re-allocating India payments market share toward digital modalities.
By Interaction Channel: E-Commerce and M-Commerce Anchor Growth
E-commerce and mobile commerce accounted for 60% revenue share in 2024 and are set to advance at a 23.1% CAGR through 2030. Merchandise values are projected to climb from USD 147.3 billion in FY 2024 to USD 292.3 billion by 2028. Seamless checkout integrations, embedded finance, and buy-now-pay-later features reinforce consumer expectation for near-instant fulfilment, steering incremental India payments market size toward online retail baskets.
Physical retail migrates to omni-channel, powered by SoftPOS and QR infrastructures that extend acceptance without terminal overheads. Over 10 million POS devices were active by 2H 2024, signalling hardware democratisation. This convergence enables merchants to capture single-view inventory and payment data, driving new loyalty programmes that translate into incremental India payments market share.
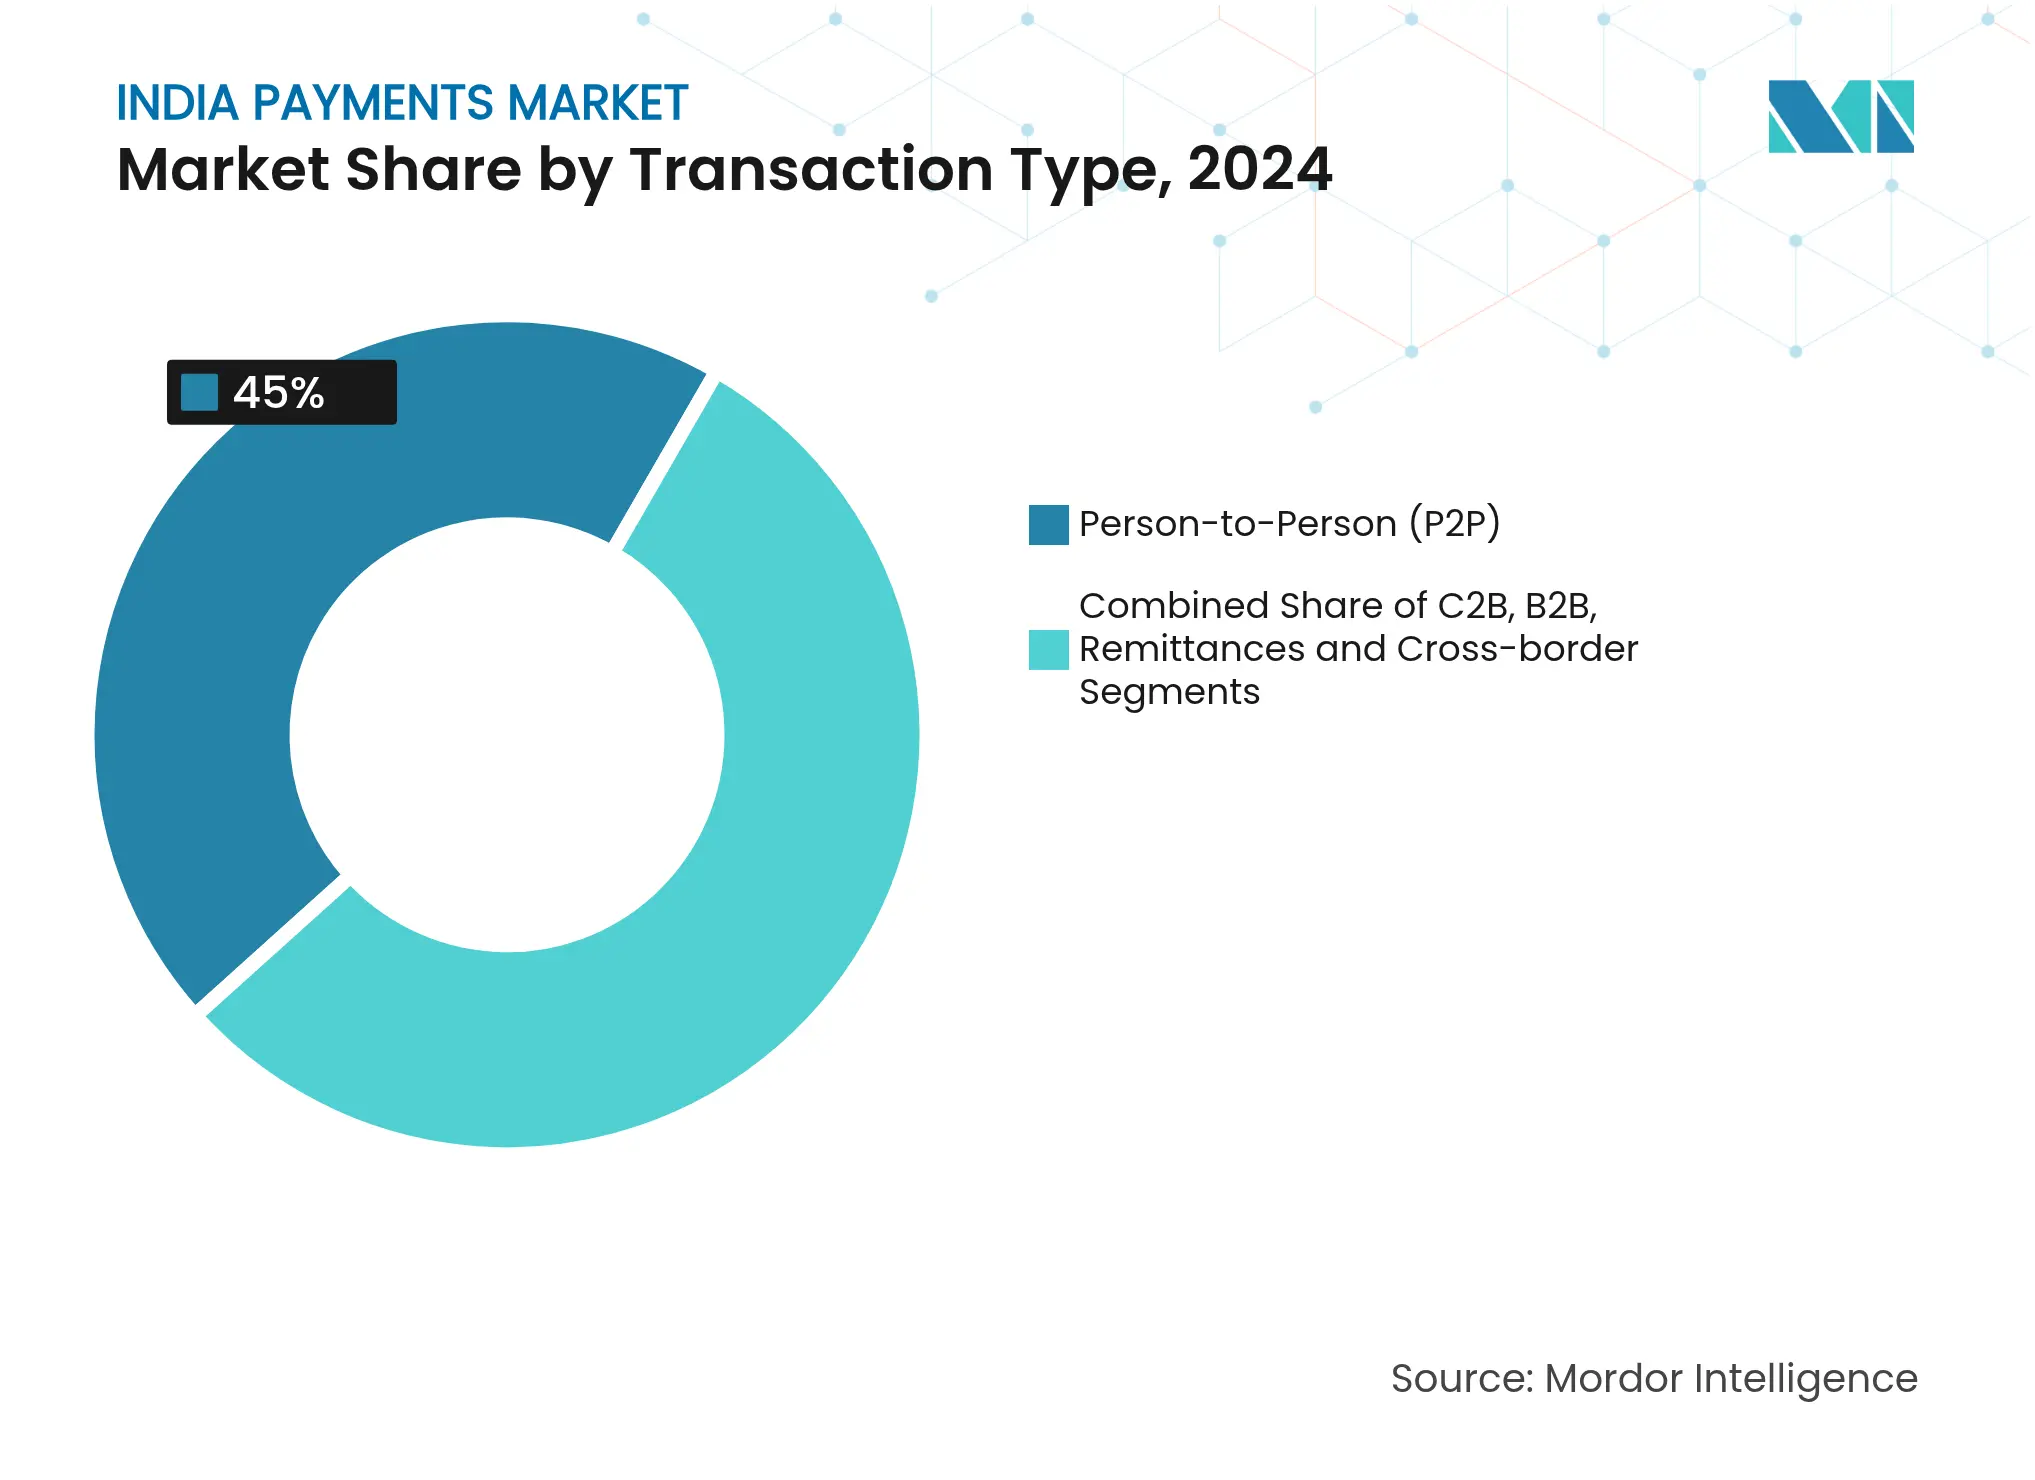
By Transaction Type: P2P Dominates While B2B Accelerates
Person-to-person transfers represented 45% of India payments market share in 2024 and remain central due to zero-cost instant clearing and ubiquitous QR discoverability. Daily family, rent, and micro-commerce flows strengthen network density, reinforcing the habit loop that boosts broader digital adoption.
Business-to-business interactions are forecast to scale at a 21.5% CAGR, supported by marketplace digitisation worth USD 200 billion by 2030. Fintech-bank alliances embed automated reconciliation and ERP linkages, reducing payment friction. As more suppliers migrate to electronic invoicing, the India payments market size attributable to B2B rails widens.
Note: Segment shares of all individual segments available upon report purchase
By End-User Industry: Retail Retains Scale, Healthcare Outpaces
Retail captured 45% of the India payments market size in 2024, underpinned by unified QR acceptance and incentive schemes targeting small outlets. The National Retail Trade Policy and Production-Linked Incentives sustain capital flows into point-of-sale technology, ensuring continuous upgrade cycles that lock in digital preferences.
Healthcare is projected to register a 23.4% CAGR to 2030, fuelled by rising health-tech platforms, tele-consultation payments, and flexible EMI options for elective procedures. Digital finance penetration into clinics and diagnostic networks introduces larger average ticket sizes, translating to incremental India payments market share.
Metropolitan hubs such as Bengaluru, Mumbai, and the Delhi-NCR corridor anchor early adoption, benefitting from high smartphone density and a robust fintech talent pool. Bengaluru alone ranked among the top transaction centres during H2 2024. These cities lead pilot testing for advanced constructs like UPI-based credit cards and tap-and-pay NFC.
Tier 2 and Tier 3 cities illustrate the fastest diffusion curve as internet penetration improves and QR incentives reach local kiranas. Policy thrusts including the INR 1,500 crore incentive and UPI Lite uplift adoption for micro-ticket values, smoothing the urban-rural digital divide and expanding the India payments market footprint.
Rural India, now contributing 54% of the nation’s 820 million active internet users, represents the next frontier. Feature-phone-based UPI 123PAY grants real-time capability to roughly 400 million additional users. Parallel cross-border integration with seven partner countries positions UPI as an exportable standard, adding an outward growth vector that complements domestic volume trajectories.

Reports are available across multiple geographies.
Gain in-depth market insights across regions to support informed decisions.
Market Concentration
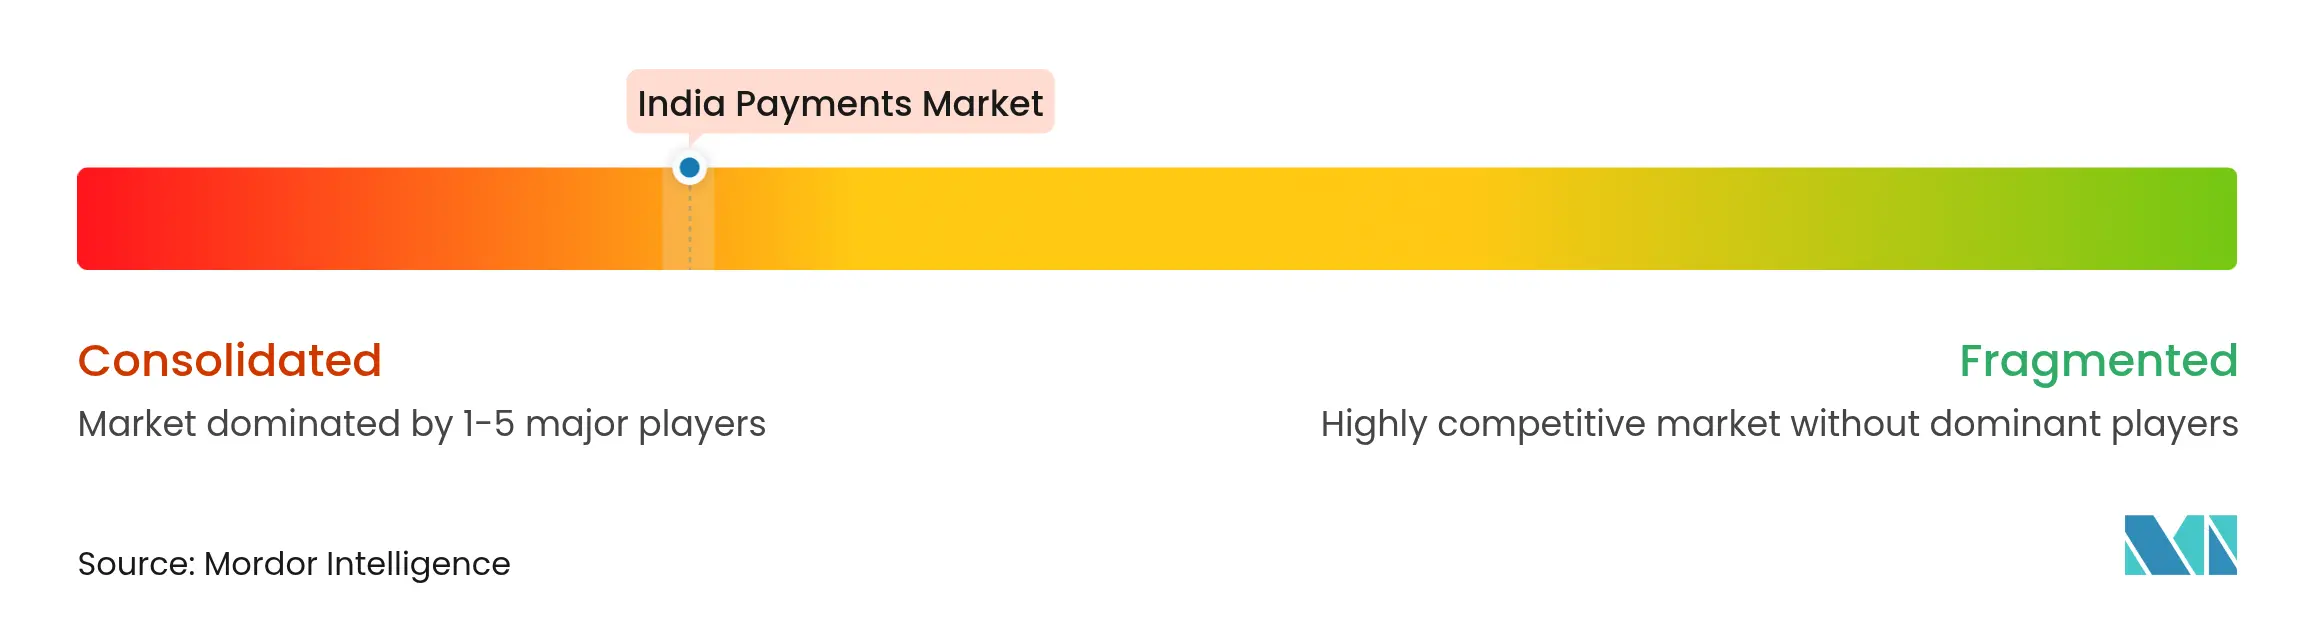
PhonePe and Google Pay collectively processed more than 80% of UPI volume in March 2025, affirming a concentrated structure. A proposed 30% per-app cap, now deferred to December 2026, seeks to curb systemic risk while granting incumbents transition time. The interim horizon allows challenger wallets and bank-centric apps to scale through differentiated loyalty schemes and embedded credit.
Players increasingly pivot from pure payment processing toward value-added ecosystems that include micro-investments, insurance, and contextual commerce. Cashback, scratch-card, and points programmes remain user-stickiness levers. Monetisation prospects hinge on the outcome of MDR deliberations; a nominal fee on large merchants could restore runway for infrastructure investment.
Regulatory licensing for payment aggregators imposes compliance discipline, raising entry thresholds yet reassuring enterprise clients on operational resilience. In parallel, NPCI’s patent on blockchain-enabled UPI settlements targets fraud mitigation and cost efficiency, potentially benefiting the entire India payments industry value chain.

*Disclaimer: Major Players sorted in no particular order
1. INTRODUCTION
2. RESEARCH METHODOLOGY
3. EXECUTIVE SUMMARY
4. MARKET LANDSCAPE
5. MARKET SIZE AND GROWTH FORECASTS (VALUES)
6. COMPETITIVE LANDSCAPE
7. MARKET OPPORTUNITIES AND FUTURE OUTLOOK
Payments entail the transfer of money from one party to another in exchange for goods, services, or the fulfillment of a legal obligation. This transfer can occur through various methods, including credit and debit cards, digital wallets, bank transfers, and virtual currencies.
The Indian payments market is segmented by mode of payment (point-of-sale [card payments, digital wallet, cash, and others] and online sale [card payments, digital wallet, and others]) and end-user industry (retail, entertainment, healthcare, hospitality, and other end-user industries). The market sizes and forecasts are provided in terms of value (USD) for all the above segments.
Pricing Strategy for Semiconductor Components
3 Min Read
Accelerating Additive Manufacturing Adoption in India
3 Min Read
US Market Entry for Taiwanese Machine Tool Manufacturers
5 Min Read
When decisions matter, industry leaders turn to our analysts. Let’s talk.