
Market Overview
| Study Period | 2021 - 2031 |
|---|---|
| Forecast Data Period | 2026 - 2031 |
| Base Year Market Size (2025) | USD 0.71 Billion |
| Market Size (2026) | USD 0.79 Billion |
| Market Size (2031) | USD 1.31 Billion |
| Growth Rate (2026 - 2031) | 10.74 % |
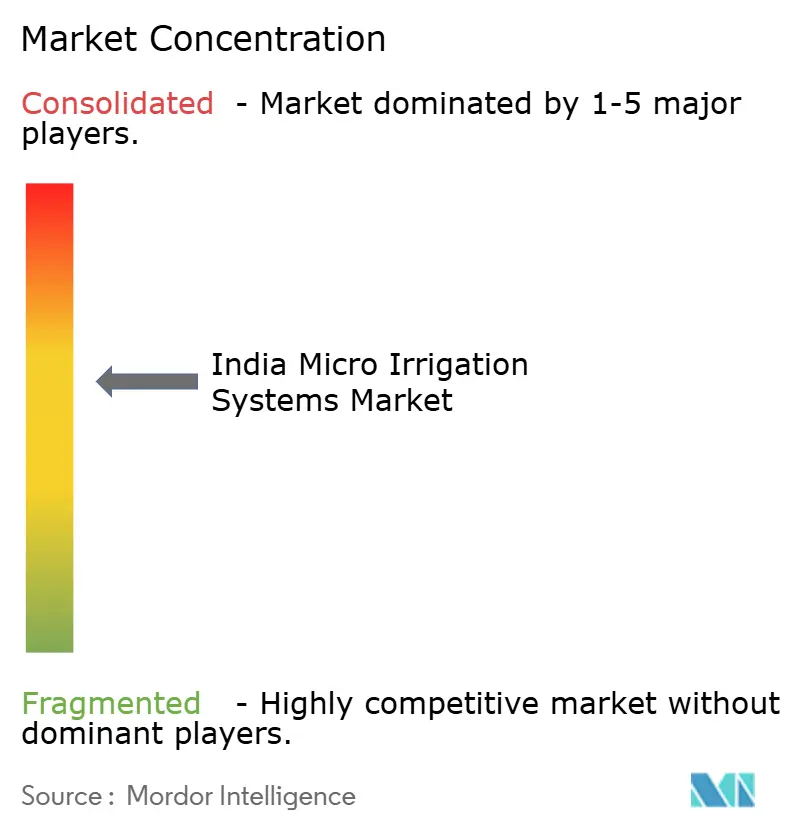
| Market Concentration | Medium |
Major Players *Disclaimer: Major Players sorted in no particular order Image © Mordor Intelligence. Reuse requires attribution under CC BY 4.0. | |
India Micro Irrigation Systems Market Analysis by Mordor Intelligence
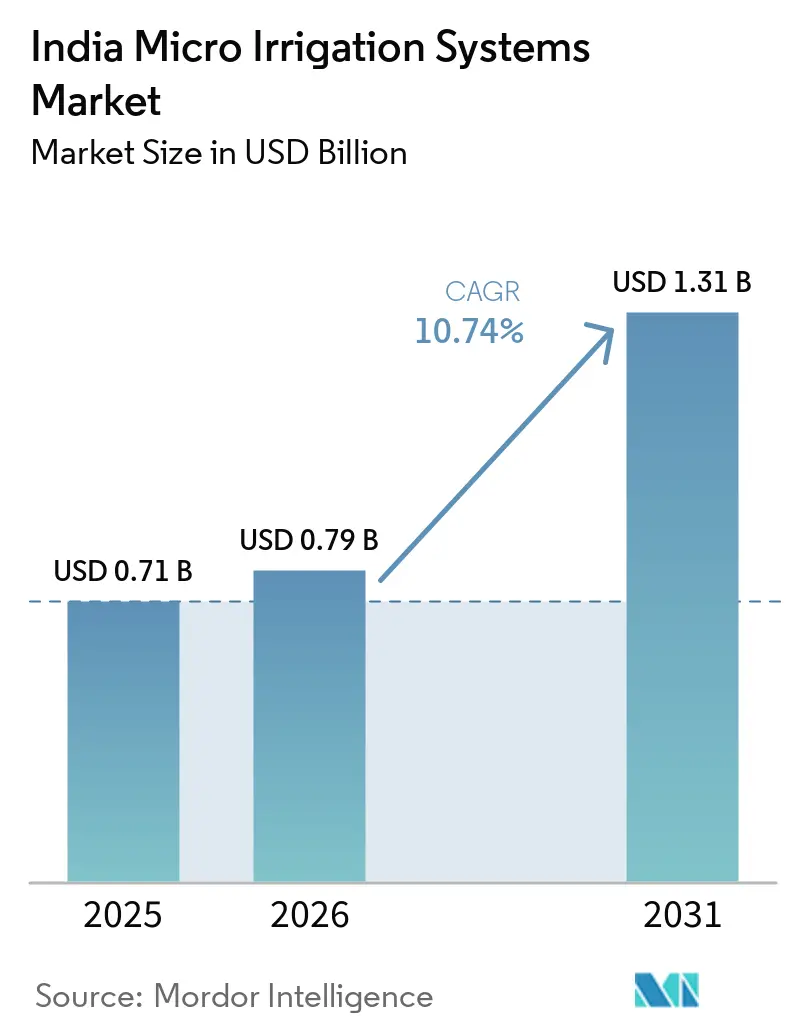
India's micro irrigation systems market size is anticipated to expand from USD 0.71 billion in 2025 to USD 0.79 billion in 2026, and it is forecast to reach USD 1.31 billion by 2031, growing at a 10.74% CAGR over 2026-2031. Mounting groundwater stress, larger budgetary allocations for the Pradhan Mantri Krishi Sinchayee Yojana (PMKSY), and rapid digitization of farm practices are accelerating adoption. Subsidies covering up to 95% of equipment cost in priority districts are shortening payback periods, while the PM-KUSUM solar-pump program is lowering operating outlays. The bundling of Internet of Things (IoT)-enabled fertigation is driving the penetration of premium products. The competitive landscape remains moderately fragmented, with established players competing alongside emerging technology providers. Nevertheless, high capital intensity, emitter-clogging risks, and patchy after-sales support keep penetration below its potential among smallholders.
Key Report Takeaways
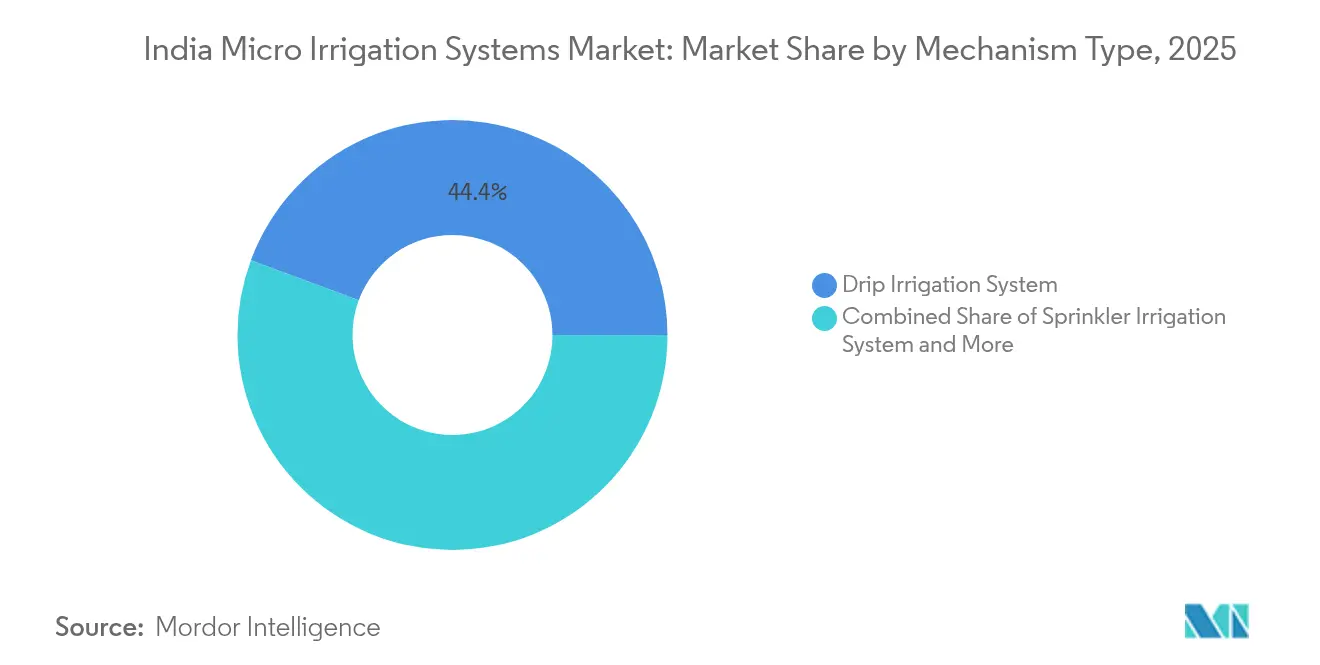
- By mechanism type, drip irrigation retained a 44.35% share in the Indian micro irrigation systems market in 2025, while fogging systems are projected to post the fastest 16.98% CAGR through 2031.
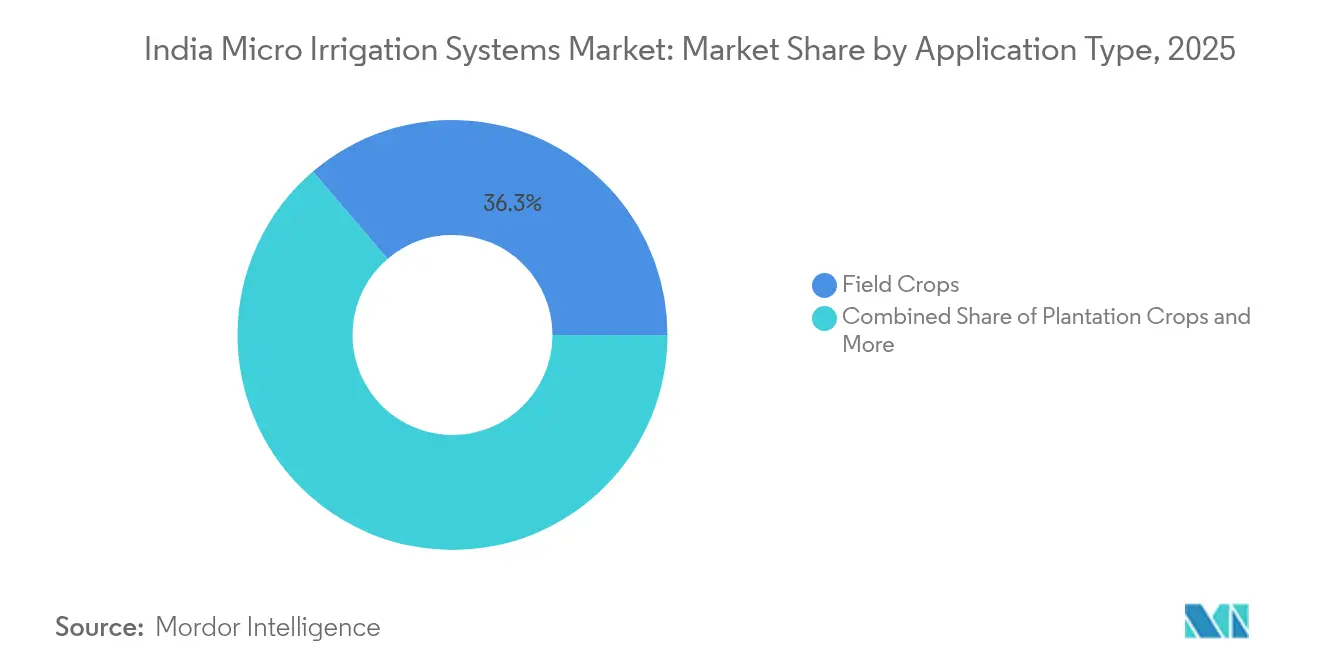
- By application, field crops accounted for 36.25% of the India micro irrigation systems market size in 2025, whereas turfs and ornamentals are advancing at a 17.66% CAGR to 2031.
- By end user, open field farms held 60.20% of revenue in 2025, while vertical farms are set to expand at a 19.05% CAGR during 2026-2031.
- By state, Maharashtra commanded 19.60% of the India micro irrigation systems market share in 2025, while Tamil Nadu is forecast to grow at a 12.64% CAGR through 2031.
Note: Market size and forecast figures in this report are generated using Mordor Intelligence’s proprietary estimation framework, updated with the latest available data and insights as of 2026.
India Micro Irrigation Systems Market Trends and Insights
Drivers Impact Analysis*
| Driver | (~) % Impact on CAGR Forecast | Geographic Relevance | Impact Timeline |
|---|---|---|---|
| Government Subsidies Are Scaling Micro Irrigation Adoption | +3.2% | Nationwide, stronger in Maharashtra, Karnataka and Gujarat | Medium term (2-4 years) |
| Accelerating Groundwater Stress in West-Central India | +2.8% | Maharashtra, Gujarat, and Madhya Pradesh | Long term (≥ 4 years) |
| Rapid Shift to Fertigation in Fruit Belts | +2.1% | Karnataka, Maharashtra, Tamil Nadu, and Andhra Pradesh | Medium term (2-4 years) |
| Solar-Powered Pump Bundling Cuts Operating Expenditure | +1.9% | Rajasthan, Gujarat, and Maharashtra | Short term (≤ 2 years) |
| Peri-Urban Export-Oriented Horticulture Clusters | +1.5% | Tamil Nadu, Karnataka, Maharashtra, and Andhra Pradesh | Medium term (2-4 years) |
| Ag-Fintech Buy-Now-Pay-Later (BNPL) Models Easing Capital Expense | +0.8% | Smallholder farming districts nationwide | Short term (≤ 2 years) |
| Source: Mordor Intelligence | |||
Government Subsidies Are Scaling Micro Irrigation Adoption
The Union Budget 2025-26 lifted the agriculture allocation to USD 21.1 billion (INR 1.75 trillion).[1]Source: Press Information Bureau, “Agriculture Budget 2025-26,” pib.gov.in The Micro Irrigation Fund has approved USD 569 million ( INR 4,724.74 crore) in low-interest loans that states leverage for 50%–95% equipment subsidies. The Cabinet-cleared Modernisation of Command Area Development and Water Management scheme added USD 192 million (INR 1,600 crore) for pressurized pipe networks, cutting conveyance losses by 25%. Demonstration plots under the Per Drop More Crop initiative show 50%–90% water savings, encouraging peer adoption. Together, these fiscal tools compress payback to fewer than three seasons for high-value crops and enlarge the India micro irrigation systems market.
Accelerating Groundwater Stress in West-Central India
Annual withdrawals near 230 billion cubic meters have lowered aquifers by 1.5 centimeters per year, curbing streamflow into the Bay of Bengal by 1,200 cubic meters per second. Maharashtra irrigates just 18% of its farmland despite having India’s highest dam density, exposing a stark demand-supply gap. Policy responses such as Punjab’s ban on water-intensive hybrid paddy underscore a nationwide pivot toward efficient irrigation. Farmers in depletion hotspots now view precision watering as insurance against pumping-ban risk, boosting the India micro irrigation systems market.
Solar-Powered Pump Bundling Cuts Operating Expenditure
Diesel pumps account for one-third of an irrigator’s variable cost. PM-KUSUM covers 60% of solar pump capital cost and offers another 30% as institutional credit, leaving farmers to pay only 10% upfront. Solar-driven drip layouts slash daytime pumping expenditure to zero and extend irrigated command beyond erratic grid supply. Studies in Rajasthan show solar-drip packages cutting greenhouse gas emissions by 80% and water use by 40%.[2]Source: Food and Agriculture Organization, “Solar-Powered Irrigation Systems,” fao.org Cheaper running cost makes precision watering viable even for water-hungry sugarcane, widening the adoption base.
Peri-Urban Export-Oriented Horticulture Clusters
Cooperatives such as Mahagrapes enable smallholders to meet stringent residue limits and traceability norms for Europe through collective post-harvest infrastructure. Cluster programs in Tamil Nadu subsidize 50% of greenhouse and drip costs, targeting grape, pomegranate, and cut-flower export lanes. Hydroponic units around Bengaluru supply premium retailers, fueling an India micro irrigation systems market upswing in turfs and ornamentals. Consistent grade standards achievable only with precision watering secure price premiums that offset higher capital outlays.
Restraints Impact Analysis*
| Restraint | (~) % Impact on CAGR Forecast | Geographic Relevance | Impact Timeline |
|---|---|---|---|
| High Upfront Installation Cost | -2.1% | Nationwide, sharper for smallholders | Short term (≤ 2 years) |
| Frequent Clogging and Maintenance Issues | -1.8% | Districts with poor water quality | Medium term (2-4 years) |
| Fragmented After-Sales Service Network | -1.3% | Eastern and central India | Medium term (2-4 years) |
| Emerging Groundwater Extraction Caps in Dark-Zone Blocks | -1.0% | Rain-fed regions with low banking density | Short term (≤ 2 years) |
| Source: Mordor Intelligence | |||
High Upfront Installation Cost
Complete drip packages cost between USD 361-361,000 (INR 30,000-30 lakh) depending on acreage and automation, a heavy lift for the 86% of farmers who own under two hectares.[3]Source: IDBI Bank, “Financing Minor Irrigation Schemes,” idbibank.in Even after a 50% subsidy, the payback for cereals can exceed five years, deterring adoption. Declining hardware costs and volume discounts are narrowing the gap, but demand elasticity remains sensitive to credit availability, slowing India micro irrigation systems market growth.
Frequent Clogging and Maintenance Issues
Emitter blockage from suspended solids and dissolved salts reduces uniformity below the 85% threshold, hurting yields. Regular acid flushing and filter replacement add 8%–10% to annual operating cost. Tube-settler retrofits shorten sedimentation time from two hours to 20 minutes, cutting blockage by 70%. Lumpy service coverage means many farmers cannot access timely repairs, capping system life at six years against the rated 10-year span.
*Our forecasts treat driver/restraint impacts as directional, not additive. The impact forecasts reflect baseline growth, mix effects, and variable interactions.
Segment Analysis
By Mechanism Type: Drip Systems Underpin Growth Momentum
Drip irrigation retained a 44.35% India micro irrigation systems market share in 2025, delivering 12%–84% water savings and 20%–50% yield gains across cereals, cotton, and horticulture. Smart automation players such as Jain Irrigation Systems Ltd’s JAIN LOGIC integrate soil-moisture telemetry and weather data, lifting water-productivity ratios by 30%. Sprinkler sets continue serving broadacre staples where uniform canopy wetting is critical, but growth trails fogging, which is rising 16.98% CAGR to 2031 on greenhouse demand. Fogging enables sub-4°C canopy cooling, vital for lettuce and exotic herbs grown inside vertical farms. IoT-ready controllers across all mechanisms add predictive maintenance capabilities, further expanding the India micro irrigation systems market size for premium kits.
Commercial greenhouse operators report significant output increases and substantial extra water savings after upgrading to sensor-controlled solenoid valves. Continuous research and development in anti-clog labyrinth design, pressure-compensating emitters, and UV-resistant polymers is extending field life, bolstering total cost-of-ownership economics. Consequently, the India micro irrigation systems market is shifting from simple gravity-fed lateral lines toward data-centric, low-maintenance architectures.



By Application Type: Field Crops Anchor Demand While Specialty Niches Surge
Field crops seized a 36.25% share of the India micro irrigation systems market in 2025, buoyed by state incentives for sugarcane and pulses. Demonstrations in capsicum show 29.8%–46.5% yield lifts under drip fertigation, creating spillover uptake into maize and oilseeds. Turfs and ornamental plants, while beginning from a smaller foundation, are projected to experience a 17.66% CAGR until 2031 as stadiums, golf courses, and lawns in gated communities contend with water usage regulations. Mixed vegetable hydroponic units in peri-urban areas adopt micro sprinklers to fine-tune root-zone humidity, improving shelf life for retailers.
Plantation crops, including coffee and cardamom, rely on low-pressure micro-sprinklers that halve leaf-wilting during dry spells. Orchards and vineyards represent a premium segment where micro irrigation delivers measurable quality improvements and export compliance, with fertigation enabling yield increases of 25-30% in fruit crops. The application diversity creates market resilience, as different segments respond to varying drivers from food security policies to urban development and export market demands.
By End User: Open Field Dominates but Vertical Farms Scale Fast
Open-field holdings accounted for 60.20% of revenue in 2025 owing to PMKSY’s 94 lakh-hectare coverage of cereals and pulses. Water stress and subsidy visibility spur farmers to retrofit lateral lines alongside existing tube wells, keeping the India micro irrigation systems market resilient. Greenhouses capitalize on assured off-take contracts with modern retail and input-cost amortization over high margins, while vertical farms record a 19.05% CAGR on rising demand for pesticide-free produce. The hydroponics subsegment reached scale in 2022 and is projected to grow fivefold by 2031, catalyzing uptake of fogging and nutrient film techniques.
Greenhouses use micron filters and UV-stabilized piping to extend equipment life, a must for export-compliant tomatoes and bell peppers. Vertical-farm operators adopt closed-loop drip fed by smart nutrient dosing to maintain parts-per-million precision. Urban land scarcity and rising cold-chain costs position multilayer farms within city limits as a viable model, further expanding the India micro irrigation systems market.
Geography Analysis
Maharashtra accounted for 19.60% of the India micro irrigation systems market in 2025, driven by state top-ups that supplement central subsidies by 15%. Yet, with only 18% of its cultivated area under irrigation, significant growth potential remains. Initiatives such as desilting reservoirs and channeling canal water under the Ramthal Integrated Drip Irrigation Project underscore strong policy commitment. Sugarcane belt conversions to subsurface drip are saving 45% water and 30% energy, freeing quota for horticulture expansion.
Tamil Nadu’s 12.64% CAGR through 2031 reflects its export-oriented banana and grape clusters adopting fertigation and high-density planting. The state disburses an extra 25% subsidy for precision irrigation inside greenhouses, making capex comparable with flood systems over five years. Karnataka and Gujarat, both facing falling water tables, promote solar pump-drip bundles that remove diesel-price volatility, widening coverage among millet growers.
Andhra Pradesh and Telangana are accelerating under horticulture corridor projects, while Rajasthan installs off-grid solar pumps to irrigate cumin and seed-spice crops. Madhya Pradesh’s medium-term growth hinges on revamping its fragmented dealer networks. Collectively, diverging water stress profiles and subsidy regimes create a fragmented adoption landscape, but coordinated national programs keep the total India micro irrigation systems market growth on track.
Regulatory Landscape
India's micro irrigation adoption is shaped primarily by the Department of Agriculture and Farmers Welfare (DA&FW) through the Per Drop More Crop (PDMC) scheme under PMKSY, which has been integrated under Rashtriya Krishi Vikas Yojana (RKVY) since 2022-23. PDMC operational guidelines govern eligibility, subsidy routing, and implementation workflows across states, so scheme compliance is a practical requirement for suppliers participating in subsidized deployments.
Product quality and component compliance are anchored by Bureau of Indian Standards (BIS) specifications for micro irrigation parts that are commonly referenced in procurement and subsidy-backed supply. This includes IS 14483-1:2024 for Venturi injectors and filtration standards such as IS 14743 for hydrocyclone filters. BIS standardization activity, including FAD 17 for farm irrigation and drainage systems, increases emphasis on certified emitters, filters, and fertigation components, which affects vendor qualification, tender participation, and acceptance by state implementing agencies.
Competitive Landscape
The competitive arena remains moderately fragmented, the top five firms together control a significant share of revenue in 2024. Jain Irrigation Systems Ltd merged its international arm with Rivulis in March 2023, forging a USD 750 million global giant with strong downstream polymer integration. Netafim Irrigation India Pvt Ltd added digital farming to its suite in August 2024, offering remote sensor monitoring and agronomic advisory. Mahindra EPC Irrigation Ltd rebounded to USD 31.6 million (INR 262.33 crore) revenue in FY 2024 on cross-selling through Mahindra & Mahindra Ltd’s tractor dealer network.
Startups such as Fasal integrate micro-climate analytics with drip controllers and have raised funding across several rounds. Domestic polymer pipe majors like Supreme Industries Ltd and Captain Polyplast Ltd leverage backward integration to mitigate polyvinyl-chloride price swings. Service innovation rather than hardware alone is emerging as a differentiator: Netafim’s turnkey model bundles land survey, design, installation, and life-cycle support, raising switching barriers.
Pricing discipline is likely to tighten as players seek volume, but subsidy disbursement delays keep working-capital cycles long. Intellectual property filings in pressure-compensated micro-sprinklers and anti-biofouling emitters indicate rising Research and Development intensity. Overall, technological convergence and financing partnerships are reshaping the India micro irrigation systems market in favor of full-stack solution vendors.
India Micro Irrigation Systems Industry Leaders
Jain Irrigation Systems Ltd
Netafim (Orbia Advance Corporation)
Mahindra & Mahindra Ltd
Rivulis (Temasek)
Kothari Group
- *Disclaimer: Major Players sorted in no particular order

Market Opportunities and Future Outlook
Program-led scale-up creates room for vendors that can deliver compliant kits, installation, and service with subsidy-aligned documentation. Government targets for 2025-2030 include covering an additional 100 lakh hectares under micro irrigation. PMKSY has reported cumulative creation or restoration of irrigation potential across 24.61 million hectares since 2016-17, which keeps district and command-area project pipelines active.
Opportunities are widening beyond basic drip and sprinkler hardware toward integrated offerings that link sustainability outcomes and digital advisory. Orbia Netafim's February 2026 collaboration with Amazon India to convert 120 hectares to drip irrigation in Bengaluru and Hyderabad, with a stated goal of 325 million liters of annual water savings, points to demand pull from corporate water stewardship programs that require measured outcomes and monitoring. On the supply side, Jain Irrigation Systems Ltd's June 2026 commissioning of a 20,000 tonne per annum biochar facility in Jalgaon, Maharashtra indicates adjacent investment in climate-smart agriculture inputs that can be bundled with precision irrigation and fertigation packages, particularly in high-value horticulture clusters and controlled-environment farms where performance guarantees and traceability are prioritized.
Recent Industry Developments
- June 2026: Jain Irrigation Systems Ltd commissioned an industrial-scale biochar facility in Jalgaon, Maharashtra with capacity of around 20,000 tonnes per annum, processing agricultural residues for sustainable agriculture and carbon removal. The initiative extends the company’s climate-smart portfolio alongside micro irrigation, supporting integrated soil-water productivity propositions for growers and institutional programs.
- March 2026: Mahindra EPC Irrigation Limited secured multiple government-linked contracts for supply of micro pressurised irrigation systems, including an order set covering about 680 hectares valued around Rs 17.15 crore with an 11-month execution period. These wins reinforce the role of tender-driven community and departmental projects in translating subsidy and irrigation-modernization budgets into equipment demand.
- August 2024: Netafim Irrigation India Pvt Ltd expanded its offering with digital farming capabilities that include remote sensor monitoring and agronomic advisory. This strengthens its turnkey positioning in premium installations where uptime, uniformity, and measurable water savings are key purchase criteria.


Research Methodology Framework and Report Scope
Market Definition and Coverage
This market covers the value of micro irrigation systems used in India to deliver water in low volumes and frequent intervals to the crop root zone, using drip, sprinkler, and similar micro application setups (surface or subsurface).
Scope exclusions: Large scale flood irrigation, canal networks, and high pressure pivot irrigation equipment are excluded from this market sizing.
Segmentation Overview
- By Mechanism Type
- Drip Irrigation System
- Sprinkler Irrigation System
- Fogging
- By Application Type
- Field Crops
- Plantation Crops
- Vegetable Crops
- Orchards and Vineyards
- Turfs and Ornamentals
- By End User
- Open Field Farms
- Greenhouses
- Vertical Farms
- By State
- Rajasthan
- Maharashtra
- Andhra Pradesh
- Karnataka
- Gujarat
- Tamil Nadu
- Madhya Pradesh
- Uttar Pradesh
- Telangana
- Rest of India
Data Sources, Market Sizing, and Validation
Desk Research
Desk research was used to set the market boundary, build the initial demand pool, and create practical checks before speaking with industry experts. We relied on public data that can indicate irrigation adoption and water stress, such as Ministry of Agriculture and Farmers Welfare updates, PMKSY micro irrigation releases, NABARD reports, and state agriculture department dashboards.
To link demand to spending, we also reviewed sources such as agricultural census and land use tables, ICAR publications, and FAO datasets that help validate crop area, cropping patterns, and water productivity signals. Company annual reports, investor presentations, and trusted press coverage were then used to understand product mix shifts and channel intensity across states. Where available, paid company financials and news databases and a patent database were used to speed up screening, track announcements, and avoid missing smaller firms. These examples are illustrative only, and other sources were also referenced for data collection, validation, and research clarification.
Primary Interviews and Surveys
Primary work focused on validating adoption drivers and pricing logic that are not cleanly visible in public datasets. We spoke with a mix of manufacturers, distributors, installers, agronomy advisors, and large farm operators across key micro irrigation states, and the respondent input was used to adjust penetration, replacement timing, and discounting assumptions before finalizing the model.
Distribution of primary research fieldwork respondents
| Company type | Respondent position |
|---|---|
| Top tier: 26% | CXOs: 12% |
| Mid tier: 59% | Functional/Unit leaders: 30% |
| Smaller Players: 15% | Managers: 58% |
Market-Sizing & Forecasting
Market sizing starts with a top-down demand pool build that reconstructs likely system spending by linking cultivated and irrigated area to micro irrigation penetration, then filtering it through crop mix and state program intensity. The model is shaped around inputs such as irrigated area by crop groups, the share of farms shifting to drip or sprinkler, subsidy coverage and disbursement cadence, typical system life and replacement cycles, and installed cost per hectare by mechanism.
Once this view is built, we corroborate totals with selective bottom-up approximations, mainly sampled ASP times area covered, distributor channel checks on annual installations, and a limited supplier revenue roll-up where disclosures allow it. Where gaps show up, for example when informal installation activity is higher than expected, assumptions are anchored to interview ranges and then narrowed using statewise acreage and subsidy signals. For forecasting, we run scenario analysis around monsoon variability, subsidy continuity, and crop price sentiment, followed by an exponential smoothing pass to avoid sharp swings that do not match observed installation seasonality.
Data Validation & Update Cycle
Outputs are cross-checked against independent signals so the final totals stay within what the sector can realistically absorb. We compare implied hectares brought under micro irrigation, implied average system pricing, and statewise concentration patterns against desk indicators and interview feedback, and then review outliers before sign-off.
If a number moves too sharply, the drivers are reopened and experts are re-contacted to confirm whether a policy change, a price move, or a channel shift is the actual trigger. Reports are refreshed annually, and interim updates are made when material events occur, such as major scheme revisions or large price changes in key components. Before delivery, a final analyst pass is completed so clients receive the latest updated view.
Mordor Intelligence's India Micro Irrigation Systems Market Size Versus Other Published Estimates
Published market values for India micro irrigation systems can look different because each publisher draws the line around products and end uses in its own way, and then uses different price and adoption assumptions. Variations also come from the year used for currency conversion and whether forecasts assume normal monsoon years or build in more aggressive subsidy acceleration.
High pressure pivot irrigation equipment sits outside Mordor Intelligence's scope, and some published totals rise when they mix mechanized irrigation with micro systems and count broader irrigation machinery spend. In addition, figures can diverge when a single national average price per hectare is applied without adjusting for statewise subsidy mix, crop pattern differences, and replacement timing, which can push the value up or down depending on the state focus.
Benchmark comparison
| Source | Market Size | Gaps in Research Methodology |
|---|---|---|
| Mordor Intelligence | USD 0.79 B (2026) | |
| Industry Association A | USD 0.93 B (2026) | Uses a broader definition that includes additional on-farm irrigation hardware and installation services, and applies higher average pricing without consistent statewise subsidy adjustments. |
| Trade Journal B | USD 0.69 B (2026) | Relies heavily on subsidy-linked installations, which can miss unsubsidized adoption and undercount replacement demand in mature drip and sprinkler pockets. |
The spread across figures is largely explained by what gets counted as a micro irrigation system sale, and how prices are normalized across states and crops. By tying value to hectares addressed, subsidy intensity, and realistic replacement cycles, the estimate remains traceable to clear drivers and can be repeated when fresh program and acreage data are released.


Key Questions Answered in the Report
What is the current value of the India micro irrigation systems market?
The market is valued at USD 0.79 billion in 2026 and is projected to reach USD 1.31 billion by 2031.
How fast is adoption growing in Tamil Nadu?
Tamil Nadu leads growth with a 12.64% CAGR through 2031, fueled by export-oriented horticulture clusters and extra state subsidies.
Which mechanism type commands the largest share?
Drip irrigation systems hold 44.35% of revenue in 2025 due to superior water-use efficiency and adaptable designs.
Why are solar pumps important for precision irrigation?
Solar-powered pumps cut operating costs by eliminating diesel use, making micro irrigation more affordable and reducing greenhouse emissions.
Page last updated on:


 Your data is secure and never sold or shared.


