Energy & Power
30th JulyUnlocking Market Potential for Solid-State Transformers
3 Min Read
The India Electric Vehicle (EV) Charging Station Market Report is Segmented by Power Output (Rapid Chargers, Fast Chargers, and Slow Chargers), Phase (Single-Phase and Three-Phase), Connector Standard (CCS-2, Type-2 AC, GB/T, and CHAdeMO), Installation Type (Public and Commercial Charging, Residential/Home Charging, and Fleet/Depot Charging), and Vehicle Type (Two-Wheeler, Three-Wheeler, Passenger Car, and Commercial Vehicle).
Market Overview
| Study Period | 2020 - 2030 |
|---|---|
| Base Year For Estimation | 2024 |
| Forecast Data Period | 2025 - 2030 |
| Market Size (2025) | USD 0.71 Billion |
| Market Size (2030) | USD 2.48 Billion |
| Growth Rate (2025 - 2030) | 28.50 % CAGR |
| Market Concentration | Medium |
Major Players *Disclaimer: Major Players sorted in no particular order. Image © Mordor Intelligence. Reuse requires attribution under CC BY 4.0. |
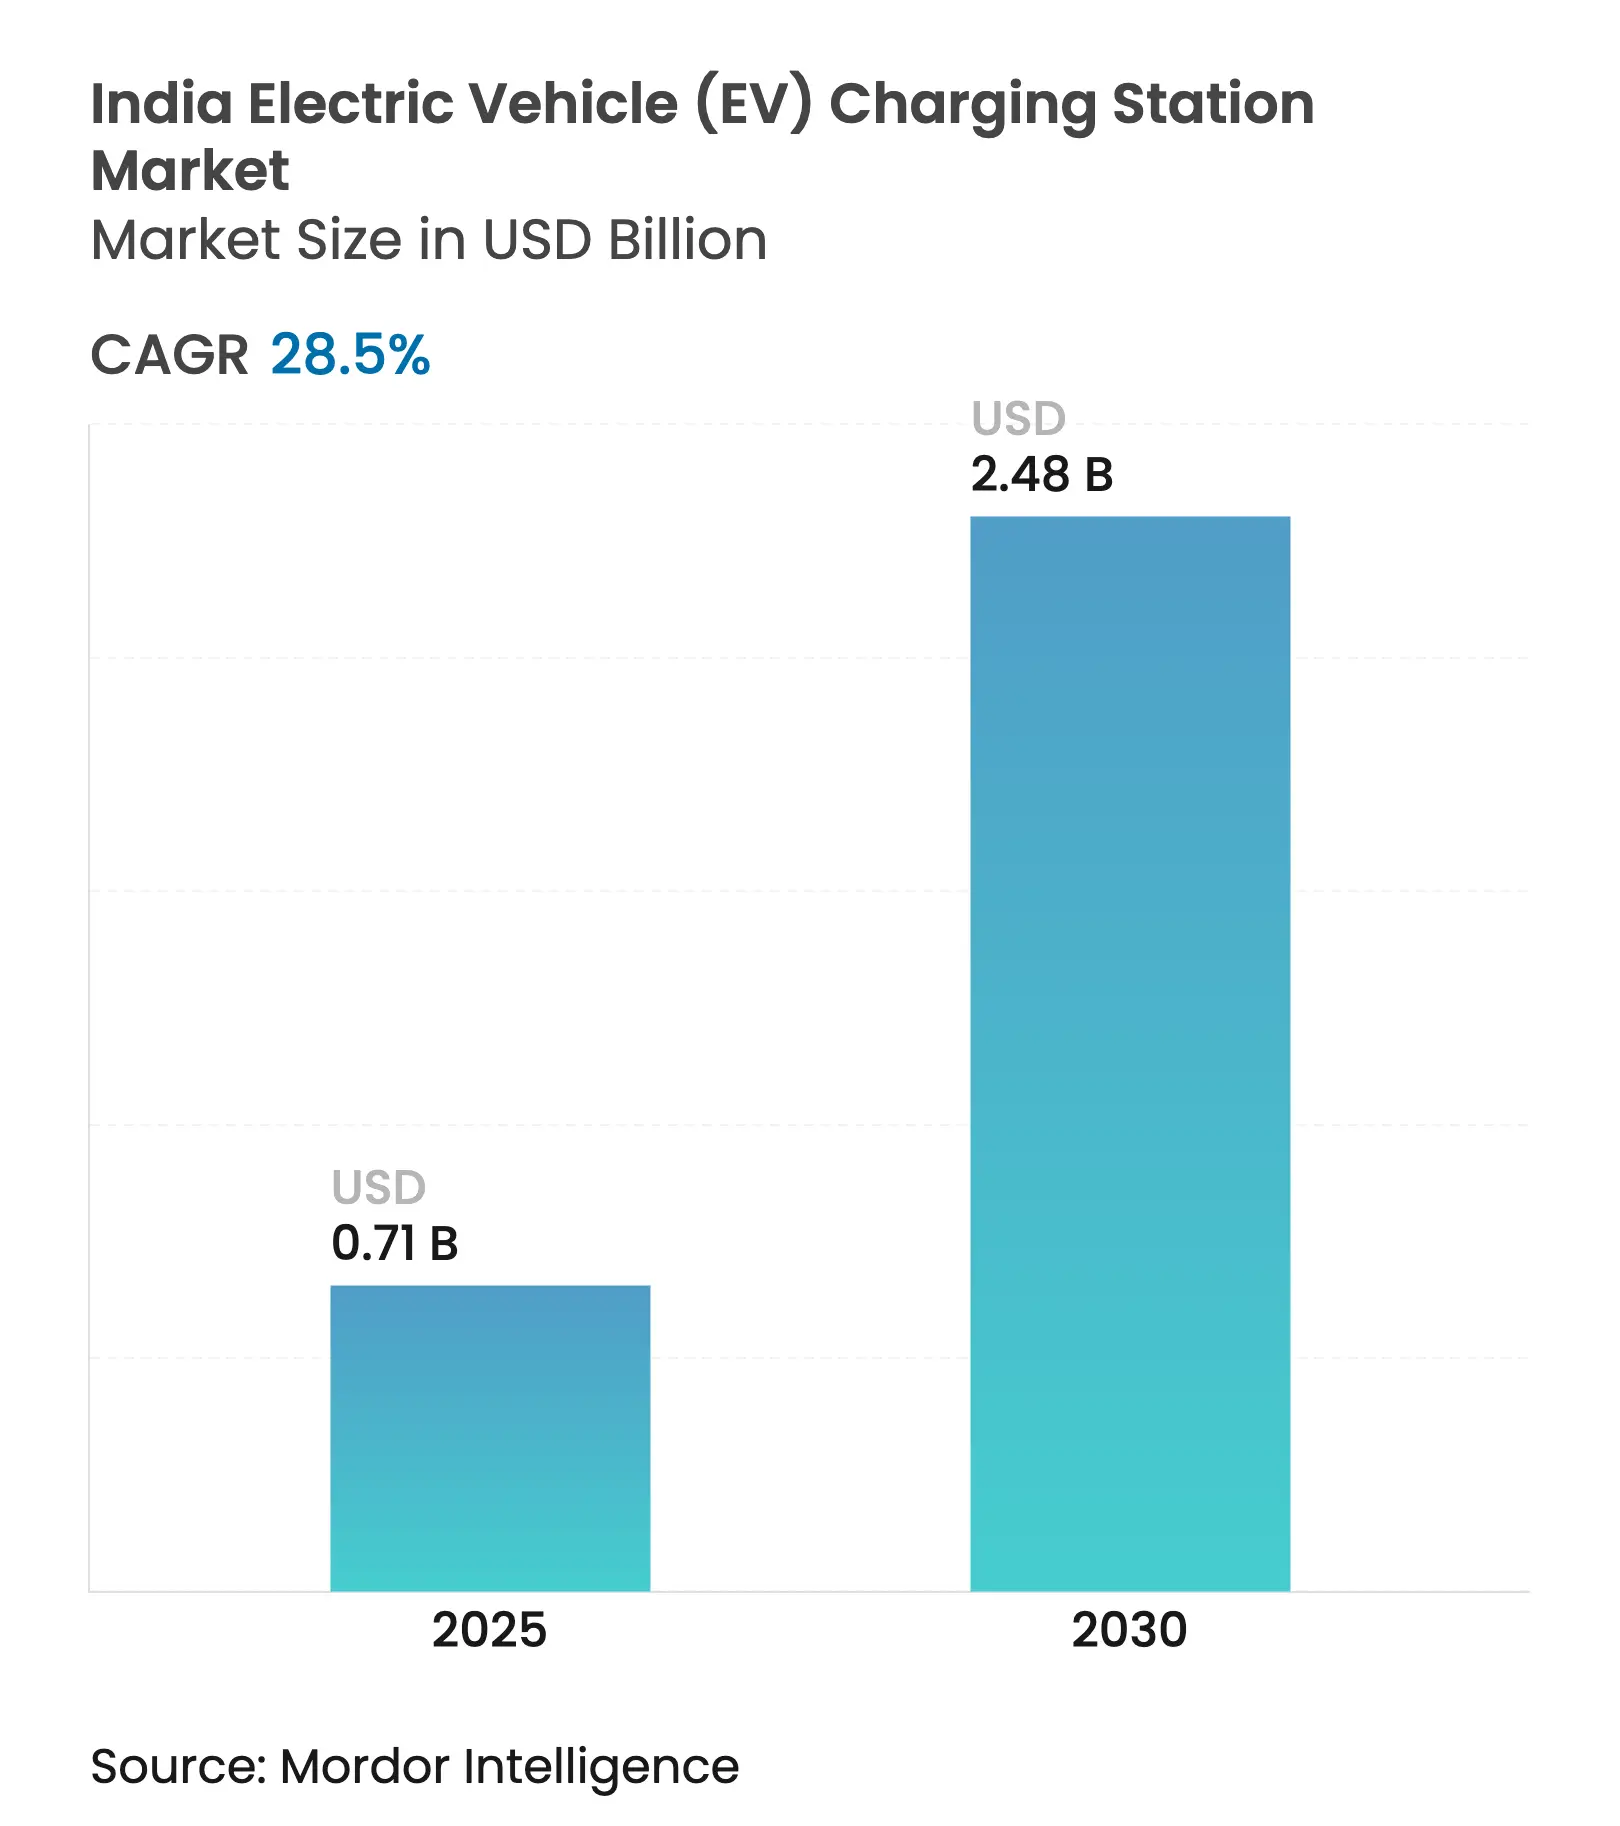
The India Electric Vehicle (EV) Charging Station Market size is estimated at USD 0.71 billion in 2025, and is expected to reach USD 2.48 billion by 2030, at a CAGR of 28.5% during the forecast period (2025-2030).
The trajectory reflects the realignment of federal subsidies toward infrastructure under PM E-DRIVE, binding density mandates from the Ministry of Power, and fast-growing last-mile electric delivery fleets that need predictable uptime. Charge-point operators (CPOs) are rushing to secure metro-core parcels despite land costs that can exceed INR 5 million (USD 60,000) per site, because early occupancy guarantees first-mover network benefits. Rapid electrification of state-run bus fleets is also pulling demand for high-capacity depots, while rooftop-solar co-location trims grid-energy costs by up to 40% in high-irradiation states. Finally, the steady decline in lithium-ion cell prices is compressing vehicle total-cost-of-ownership (TCO) and lifting charger utilization in premium corridors, catalyzing institutional capital inflows.
Key Report Takeaways
Note: Market size and forecast figures in this report are generated using Mordor Intelligence's proprietary estimation framework, updated with the latest available data and insights as of 2026.
Drivers Impact Analysis
| Driver | (~) % Impact on CAGR Forecast | Geographic Relevance | Impact Timeline | |||
|---|---|---|---|---|---|---|
Government incentives under PM E-DRIVE Government incentives under PM E-DRIVE | 6.20% | Delhi-NCR, Maharashtra, Karnataka, Tamil Nadu | Medium term (2-4 years) | (~) % Impact on CAGR Forecast:6.20% | Geographic Relevance:Delhi-NCR, Maharashtra, Karnataka, Tamil Nadu | Impact Timeline:Medium term (2-4 years) |
OEM & CPO network-expansion commitments OEM & CPO network-expansion commitments | 5.80% | Major metros expanding into tier-2 cities | Medium term (2-4 years) | |||
Declining battery prices lowering TCO Declining battery prices lowering TCO | 4.10% | Nationwide, strongest for commercial fleets | Short term (≤ 2 years) | |||
EV-ready building-code mandates EV-ready building-code mandates | 3.30% | Delhi-NCR, Mumbai, Bangalore, Pune, Hyderabad | Long term (≥ 4 years) | |||
Rooftop-solar co-located charging economics Rooftop-solar co-located charging economics | 2.70% | Rajasthan, Gujarat, Karnataka, Maharashtra | Medium term (2-4 years) | |||
E-commerce last-mile fleet electrification E-commerce last-mile fleet electrification | 4.40% | Metro and tier-1 cities with dense online-retail activity | Short term (≤ 2 years) | |||
| Source: Mordor Intelligence | ||||||
Government Incentives Under PM E-DRIVE
The 2024 shift from FAME-II to PM E-DRIVE redirected INR 2 billion (USD 240 million) toward charging rather than vehicle purchase, signaling that range anxiety remains a bigger hurdle than sticker price. The program subsidizes up to 50% of fast-charger capex and 25% of residential units, contingent on 95% uptime and OCPP 1.6 compliance. States have layered sweeteners: Maharashtra waives electricity duty on EV charging until 2027, Karnataka adds a 15% capex grant, and Tamil Nadu requires 20% of parking in new commercial projects to be EV-ready. These stacks cut typical CPO payback from seven to under four years on high-traffic corridors. The Bureau of Energy Efficiency now obliges every subsidized charger to publish real-time availability via open APIs, reducing search friction and boosting utilization.[1]Bureau of Energy Efficiency, “Guidelines on Public EV Charging Infrastructure,” beeindia.gov.in
OEM & CPO Network-Expansion Commitments
Large balance-sheet players are translating policy tailwinds into hard targets. Tata Power plans 400,000 points by 2027, Jio-bp targets 30,000 by 2030, and Statiq seeks 20,000 by 2025, collectively earmarking more than USD 500 million in capex.[2]Ministry of Power, “Density Mandate for EV Chargers,” powermin.gov.in Ather Energy’s two-wheeler-focused Grid already spans 1,450 sites, illustrating how niche networks can scale under clear consumer value propositions. Execution, however, hinges on land procurement: parcels in Mumbai’s business districts command INR 200 per sq ft monthly leases, eating up 40% of project budgets and lengthening breakeven timelines.
Declining Battery Prices Lowering TCO
Lithium-ion cell prices slid from USD 150 kWh in 2020 to near USD 110 kWh in 2024, a 28% fall credited to domestic cell-manufacturing scale-up and duty rationalization. Total-cost-of-ownership parity has moved forward by almost two years in the commercial three-wheeler segment, driving a surge in fleet electrification. Higher vehicle throughput lifts average charger utilization in metro corridors, which rose from 12% in 2023 to 22% in 2024. Yet tier-2 cities still linger in single-digit utilization, stressing the need for demand-aggregation hubs.
EV-Ready Building-Code Mandates in Metro Cities
Municipal bylaws in Delhi, Mumbai, Bangalore, and Pune require 20% of parking spaces in new projects to be pre-wired for EV supply. Early data from Bangalore show 68% compliance in H1 2025, but only 12% included three-phase wiring, capping rapid-charger potential. The rules transfer first-cost risk from CPOs to developers, smoothing adoption for homeowners blocked by resident-association pushback in older buildings.
Restraints Impact Analysis
| Restraint | (~) % Impact on CAGR Forecast | Geographic Relevance | Impact Timeline | |||
|---|---|---|---|---|---|---|
High capex and land cost for DC fast hubs High capex and land cost for DC fast hubs | –3.8% | Mumbai, Delhi-NCR, Bangalore | Medium term (2-4 years) | (~) % Impact on CAGR Forecast:–3.8% | Geographic Relevance:Mumbai, Delhi-NCR, Bangalore | Impact Timeline:Medium term (2-4 years) |
Distribution-grid capacity limits in tier-2/3 Distribution-grid capacity limits in tier-2/3 | –4.2% | Uttar Pradesh, Madhya Pradesh, Bihar, Rajasthan | Long term (≥ 4 years) | |||
Interoperability gaps in payment/protocols Interoperability gaps in payment/protocols | –2.1% | Nationwide, acute in multi-CPO metros | Short term (≤ 2 years) | |||
Home/workplace charging cannibalizing utilization Home/workplace charging cannibalizing utilization | –3.4% | Metro cities with high residential EV penetration | Medium term (2-4 years) | |||
| Source: Mordor Intelligence | ||||||
High Capex and Land Cost for DC Fast Hubs
A 60-kW DC unit costs INR 1.5-2.5 million (USD 18,000-30,000) before civil works, grid fees, and land. In Mumbai’s core, monthly leases top INR 200 per sq ft, while outright parcels near Delhi expressways trade at INR 5 million (USD 60,000). Such economics break even only above 30% utilization, yet 2024 national averages hover near 18%. State land-bank schemes relieve pressure but involve 12-18-month approvals that stall rollouts.
Distribution-Grid Capacity Limits in Tier-2/3 Cities
A Central Electricity Authority audit shows 62% of transformers in Uttar Pradesh and Madhya Pradesh already run above 80% capacity during evening peaks.[3]Central Electricity Authority, “Transformer Load Survey,” cea.nic.in With utilities burdened by INR 6.1 trillion (USD 73 billion) in dues, transformer upgrades lag demand, stretching CPO connection timelines to 6-9 months compared with 2-3 months in metros.
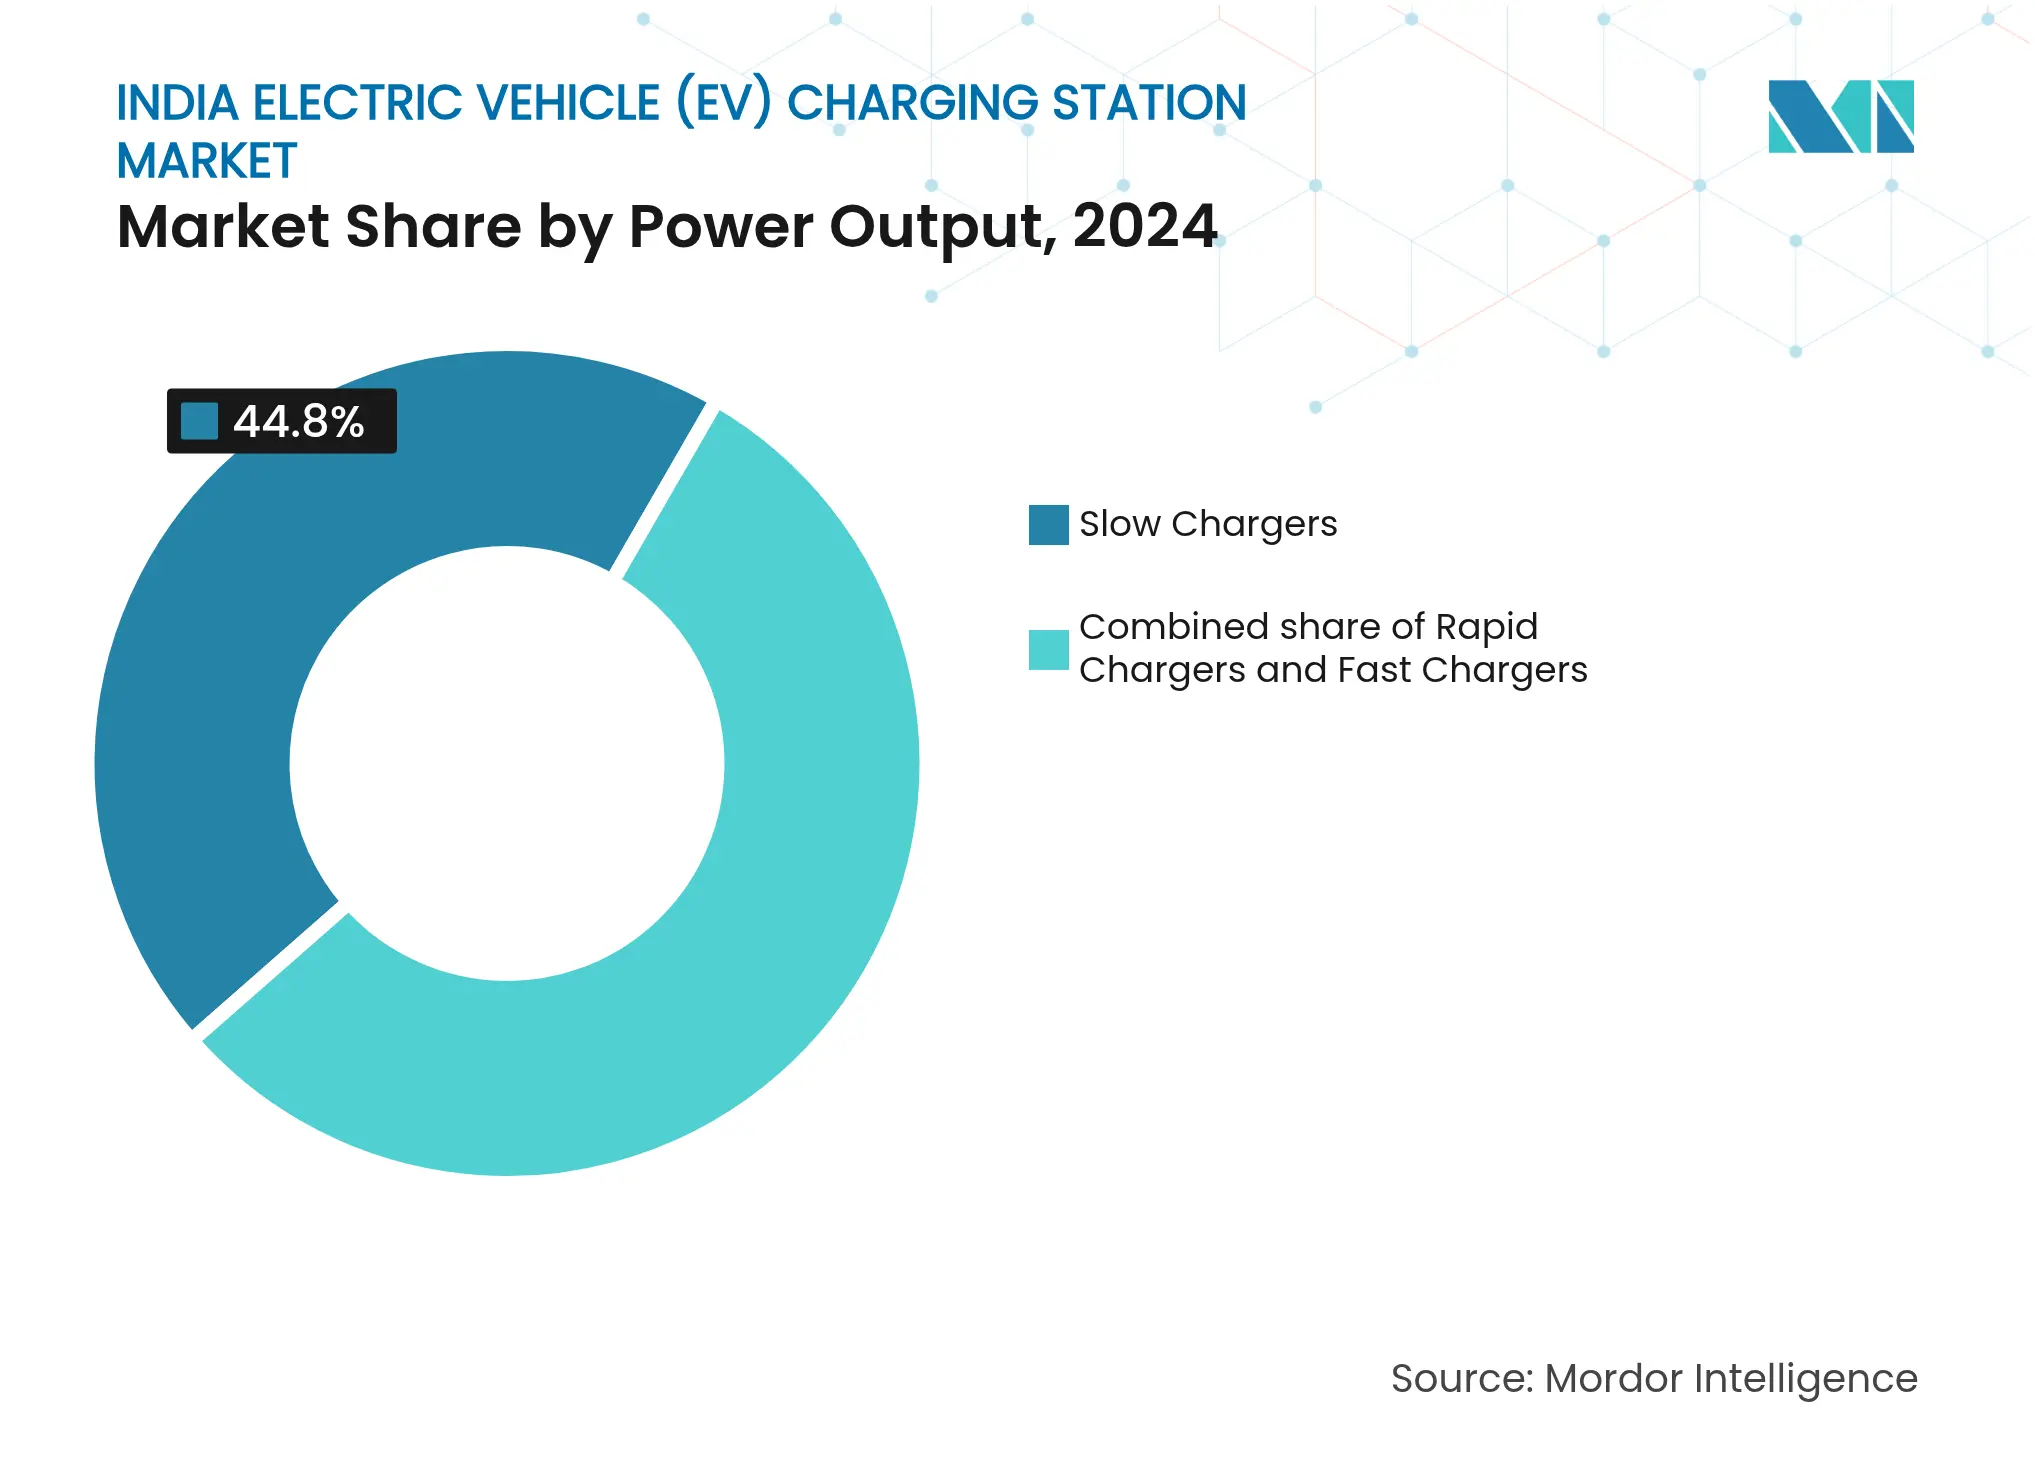
By Power Output: Rapid Chargers Gain Despite Slow-Charger Dominance
Slow chargers retained 44.8% of the 2024 India electric vehicle charging station market share due to early low-cost rollouts. Fast and rapid infrastructure will outgrow this base as fleet operators chase 30-minute turnarounds that unlock an extra delivery cycle worth INR 800-1,200 daily. The India electric vehicle charging station market size for rapid units will expand at a 35.9% CAGR through 2030, helped by subsidies that cover half the upfront cost of 120-kW machines.
Competition now centers on high-capacity liquid-cooled systems such as Exicom’s 240-kW Harmony Direct 2.0, which balances four ports from a 100-kW grid feed, cutting demand charges by 40%. Indigenous 120-kW chargers from BHEL target public tenders, yet uptake waits on BIS certification for units above 100 kW. Slow chargers will persist in gated communities and depot yards where overnight dwell aligns with 3.3- to 7.4-kW supply and avoids demand charges.
Note: Segment shares of all individual segments available upon report purchase
By Phase: Three-Phase Infrastructure Scales for Commercial Demand
Single-phase systems comprised 68.2% of 2024 installations because most Indian residences run on a 230-V supply. Commercial depots and bus yards, however, need 22-kW AC or 50-kW DC service that demands three-phase 415-V feed. Three-phase capacity, therefore, will grow at a 33.3% CAGR to 2030, even as utilities issue time-of-use tariffs that discount off-peak three-phase power by 30%-40%.
Substation upgrades can exceed INR 5 million (USD 60,000) per depot, so state transport corporations bundle electrical works into bus‐procurement tenders. Developers of high-rise apartments remain reluctant to fund three-phase retrofits, leaving many urban households on single-phase overnight charging for the medium term.
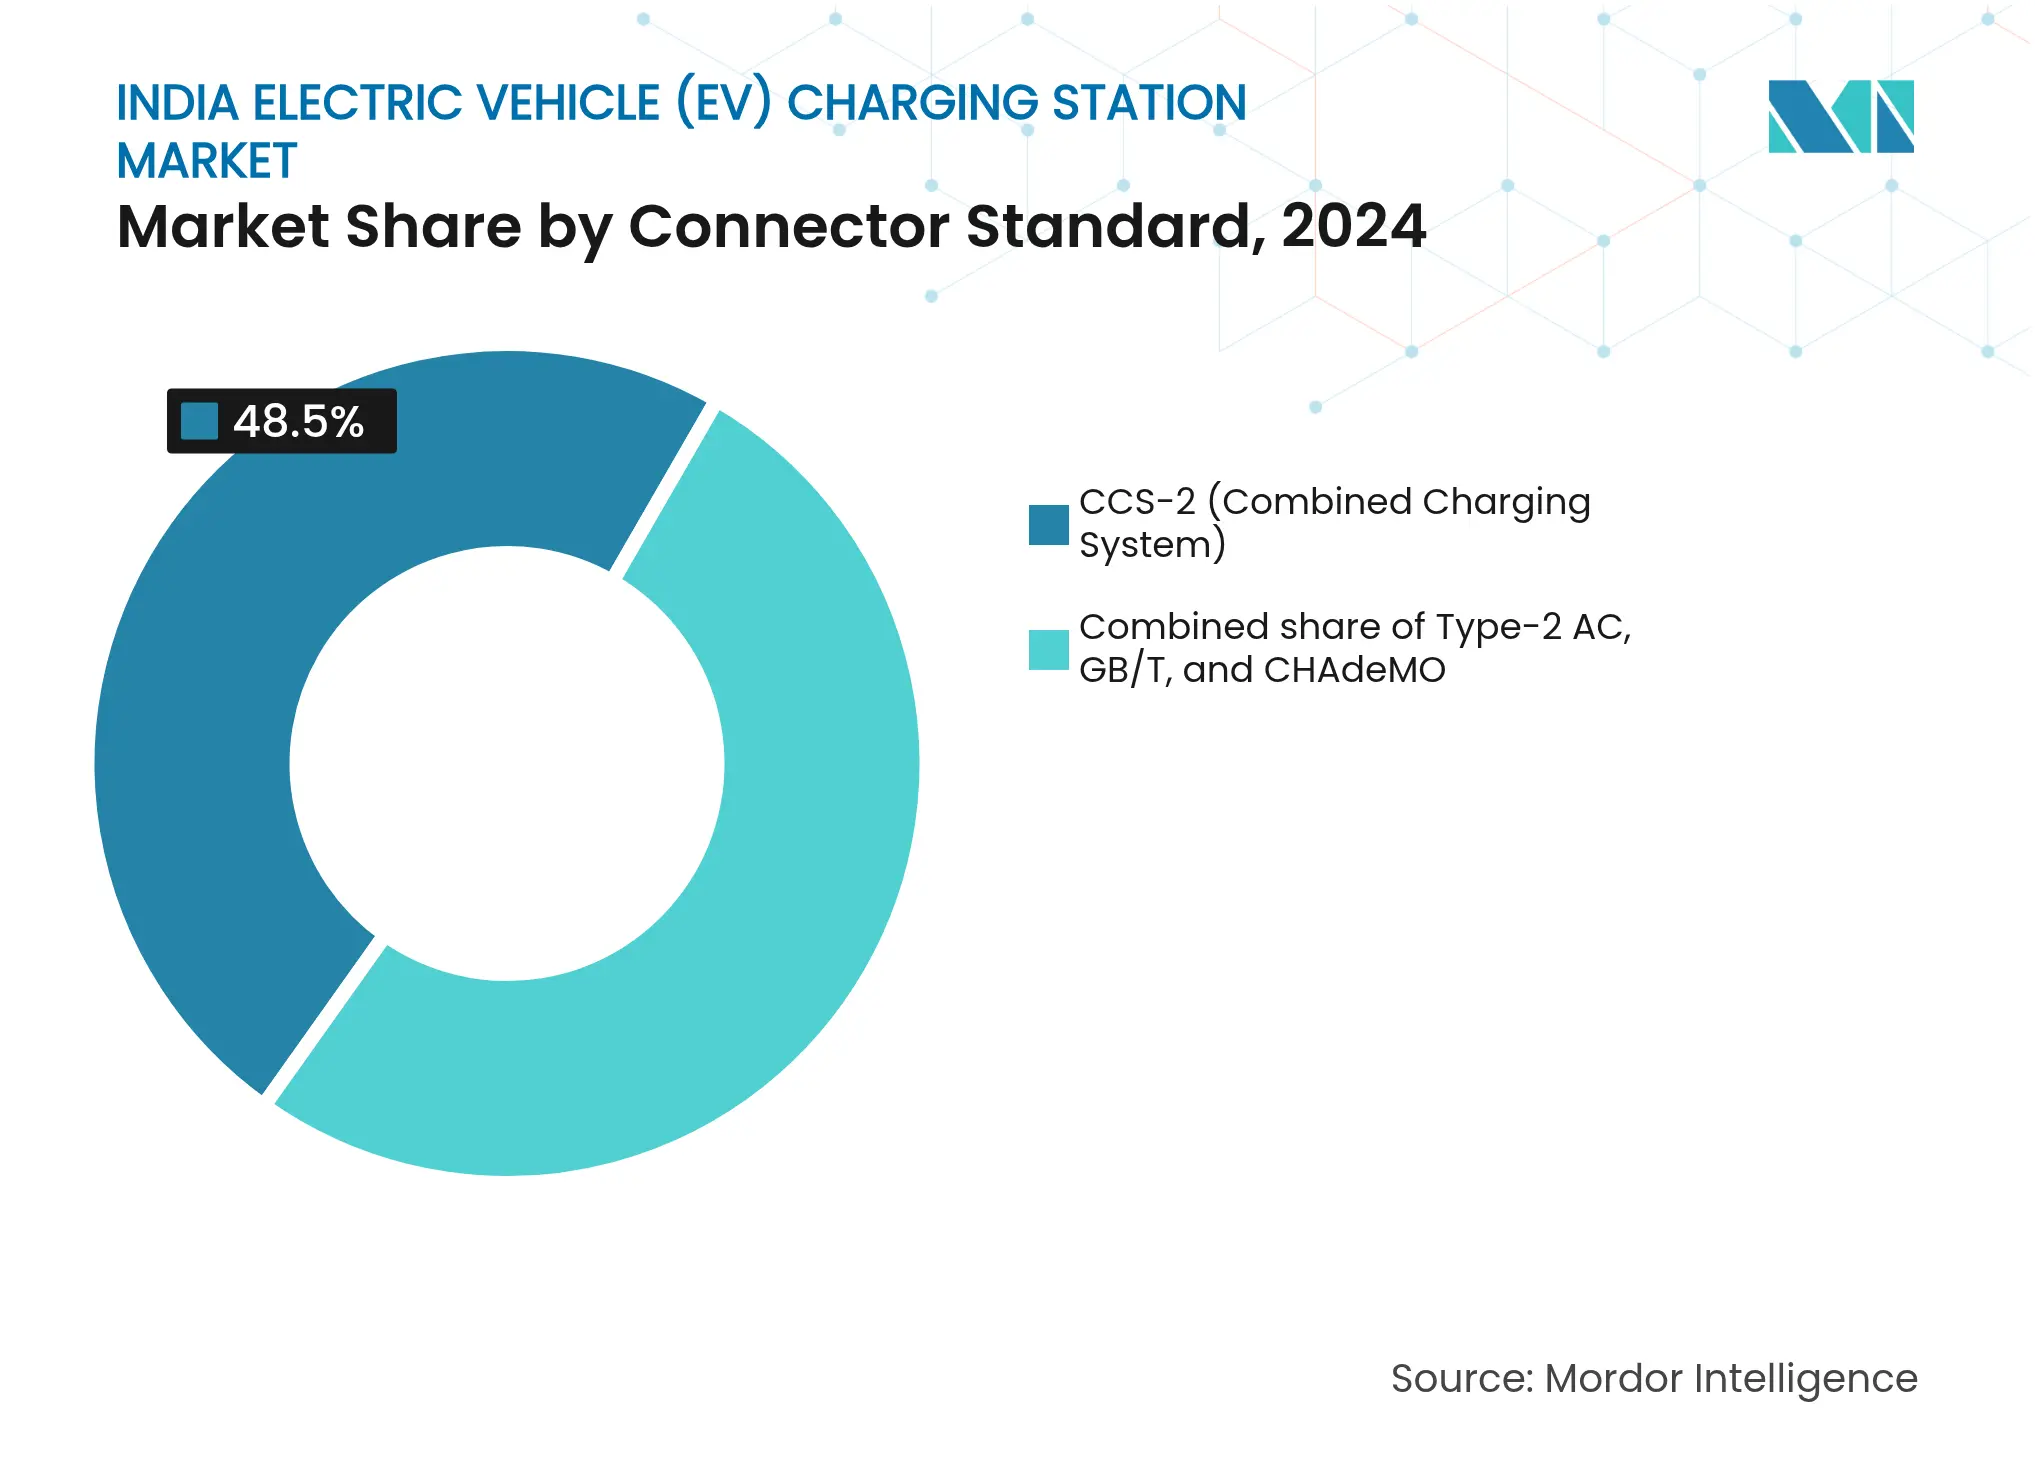
By Connector Standard: CCS-2 Consolidates as GB/T Fades
CCS-2 captured a 48.5% share in 2024 and will keep a 29.8% CAGR, supported by IS 17017-1 rules that tie PM E-DRIVE subsidies to CCS-2 compliance.[4]Bureau of Indian Standards, “IS 17017-1: 2024 EV Charging Standard,” bis.gov.in Tata Motors, Mahindra, and MG Motor have standardized on CCS-2 since 2024, and retrofit kits are available for legacy models.
GB/T’s 18% slice is shrinking as Chinese OEMs localize to CCS-2 for subsidy eligibility. CHAdeMO is now below 5% and no longer installed in new public sites. Multi-standard chargers add INR 500,000-800,000 (USD 6,000-9,600) versus CCS-only models, a premium most CPOs will not absorb. Proprietary light-EV connectors used by Ather or Ola create a parallel two-wheeler ecosystem that remains disconnected from passenger-car networks, limiting cross-user synergies.
Note: Segment shares of all individual segments available upon report purchase
By Installation Type: Residential Charging Surges as Public Networks Consolidate
Public and commercial locations held 58.3% of revenue in 2024, but residential units will post a 34.6% CAGR to 2030 as homeowner subsidies, EV-ready building codes, and simpler permitting shift the center of gravity indoors. The India electric vehicle charging station market size for public hubs is under pressure: fewer than 30% of installed units meet the 25% utilization needed for cash-flow breakeven.
Fleet depots represent the fastest-growing niche. Amazon, Flipkart, and state bus operators prefer captive sites where bulk tariffs are 20%-25% below retail. Public CPOs must therefore pivot toward highway corridors and shared real-estate models with malls and fuel retailers. Reliability, not mere count, is emerging as the decisive metric after field audits in 2024 found downtime above 70% in certain state-owned networks.
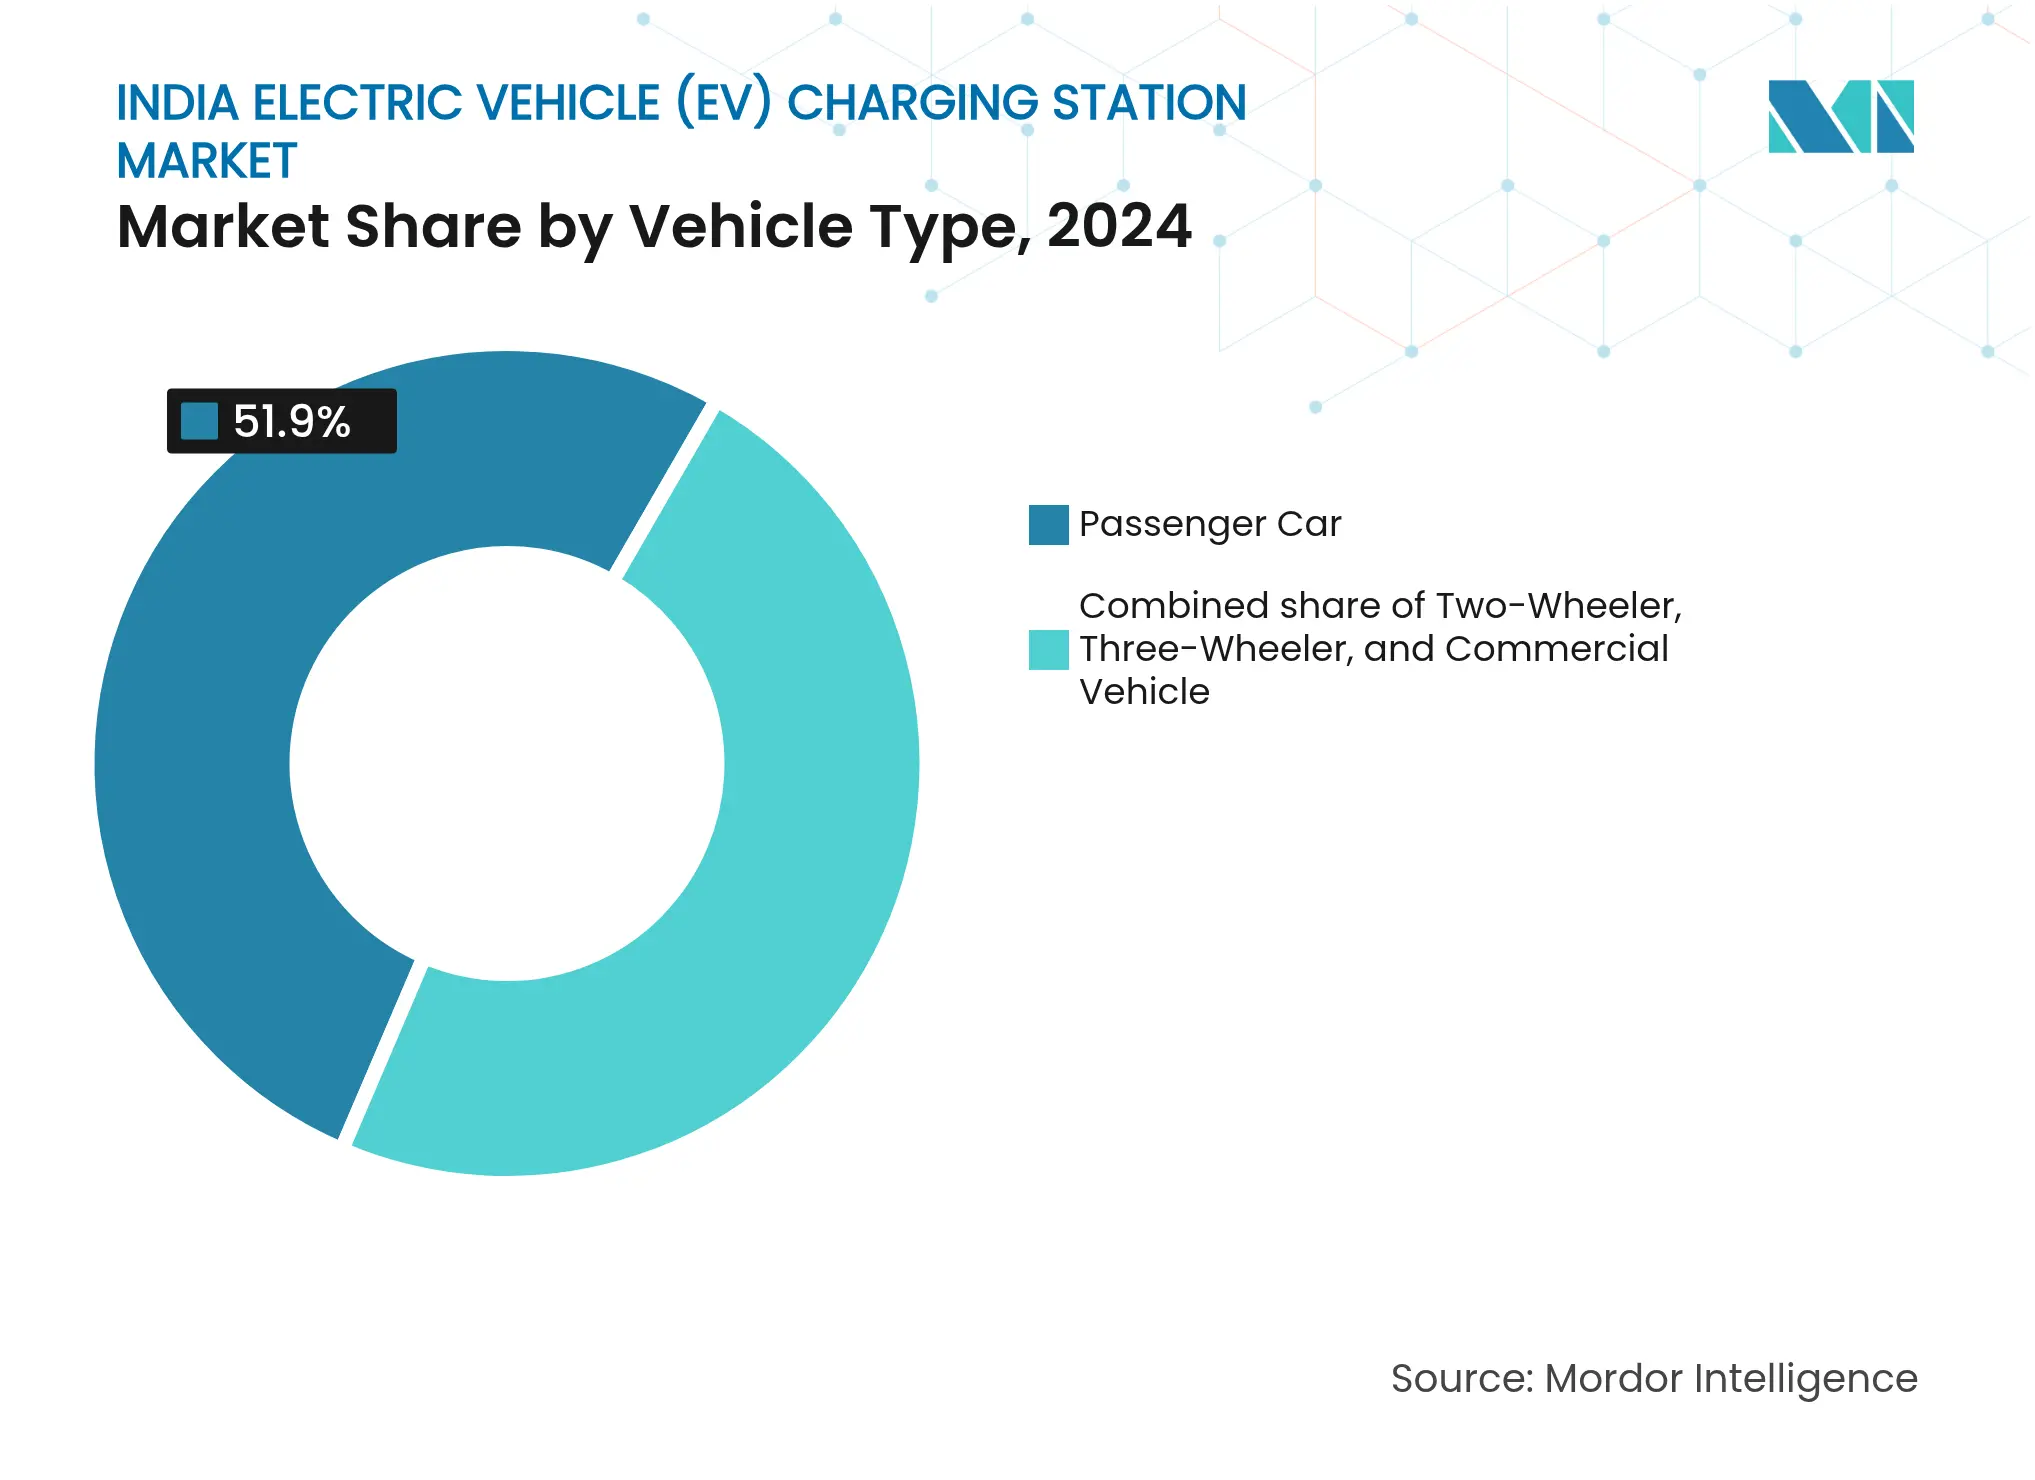
By Vehicle Type: Commercial Vehicles Accelerate Fastest
Passenger cars drove 51.9% of 2024 charger demand, yet commercial vehicles will expand at a 36.5% CAGR as state transport corporations and logistics firms electrify fleets. Each electric bus needs 150-240 kW overnight chargers; a CESL tender for 5,450 buses alone implies a USD 180 million infrastructure pulse. Two-wheelers and three-wheelers dominate EV registrations but draw modest energy per session and increasingly rely on battery swapping, a model that skirts fixed chargers.
Passenger-car networks cluster in Delhi-NCR, Mumbai, Bangalore, and Hyderabad, where EV penetration has crossed 3% of new-car sales. Tier-2 cities still run below one public charger per 100 EVs, underscoring how geography and vehicle mix co-determine infrastructure rollouts.
Note: Segment shares of all individual segments available upon report purchase
Delhi-NCR leads with more than 4,200 public chargers as of August 2025, thanks to a 2024 bylaw mandating that 20% of parking in new projects be EV-ready. Bangalore follows with about 3,800, buoyed by Karnataka’s 15% capex grant and an electricity-duty waiver through 2027. Mumbai’s 2,900-station network clusters along high-rent corridors where CPOs typically sign revenue-share deals with mall or fuel-retail landlords to offset land costs. Hyderabad exceeds 2,100 chargers, leveraging Telangana’s rule that allows CPOs to sell power at market rates without a distribution license, improving margins.
Tier-2 cities such as Lucknow, Indore, and Coimbatore face ratios below one charger per 100 EVs. Grid headroom is the chief hurdle: 62% of transformers in Uttar Pradesh and Madhya Pradesh already run near capacity, and state utilities owe INR 6.1 trillion in payables that crimp capex. Connection approvals, therefore, extend to 6-9 months outside metros.
Highway corridors linking metros, Delhi-Jaipur, Mumbai-Pune, Bangalore-Chennai, are strategic targets under a Ministry of Power rule that requires one charger every 100 km. NHAI awarded contracts for 1,200 points in 2024, though rural land acquisition and weak feeder lines may slow execution until mid-2026. State policies also skew outcomes: Tamil Nadu’s 20% capex grant has spurred public-sector installs, while Gujarat’s open-access tariff lets CPOs buy renewable power directly, cutting costs by 15%-20%. Maharashtra’s INR 10,000 home-charger subsidy enjoys strong demand, yet only 40% of applicants had been reimbursed within the promised 30-day window by mid-2025.
The regional imbalance will persist until 2028, when tier-2 EV penetration is expected to breach 2%, the threshold at which public-charger economics consistently clear cash-flow breakeven.

Reports are available across multiple geographies.
Gain in-depth market insights across regions to support informed decisions.
Market Concentration
With more than 50 active CPOs, the India electric vehicle charging station market is fragmented, but consolidation has begun. Indian Oil Corporation (IOCL) leveraged its 33,000 fuel outlets to surpass Tata Power in station count by mid-2025. However, field audits revealed more than 95% downtime for IOCL units in late 2024, compared with less than 10% for Tata Power, emphasizing that uptime rather than asset count drives recurring traffic.
Tata Power is building vertical synergies through tie-ups with Tata Motors and Shell to secure captive demand and highway real estate. Exicom’s 2024 acquisition of Tritium’s manufacturing IP positions it as both equipment supplier and CPO, enabling margin capture across the chain. Asset-light disruptors such as Statiq aggregate multiple small CPOs into a single roaming app, spreading fixed-cost recovery and boosting utilization. ChargeZone pilots tariff algorithms linked to grid-renewable availability, reflecting a shift toward software-led differentiation.
Regulatory compliance is emerging as a moat. Only BIS-certified chargers qualify for PM E-DRIVE subsidies or state-transport contracts. Operators without certification face exclusion, accelerating shake-out pressure. The structure will likely coalesce around 5-7 national players by 2028, each exceeding 10,000 live chargers, while niche specialists serve two-wheeler swapping or solar-integrated rural corridors.

*Disclaimer: Major Players sorted in no particular order
1. Introduction
2. Research Methodology
3. Executive Summary
4. Market Landscape
5. Market Size & Growth Forecasts
6. Competitive Landscape
7. Market Opportunities & Future Outlook
The India electric vehicle charging station market report includes:
Unlocking Market Potential for Solid-State Transformers
3 Min Read
When decisions matter, industry leaders turn to our analysts. Let’s talk.