Electric Vehicle Charging Equipment Market Size and Share
Market Overview
| Study Period | 2021 - 2031 |
|---|---|
| Market Size (2026) | USD 43.4 Billion |
| Market Size (2031) | USD 81.07 Billion |
| Growth Rate (2026 - 2031) | 13.31% CAGR |
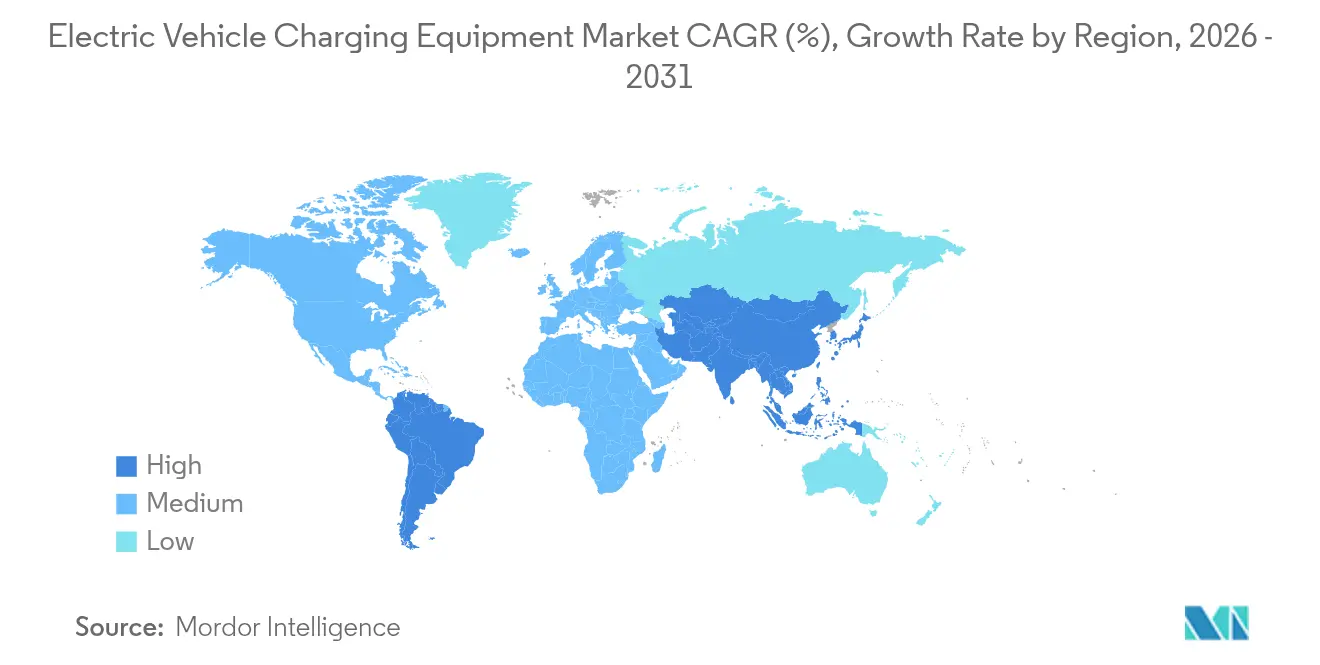
| Fastest Growing Market | Asia Pacific |
| Largest Market | Asia Pacific |
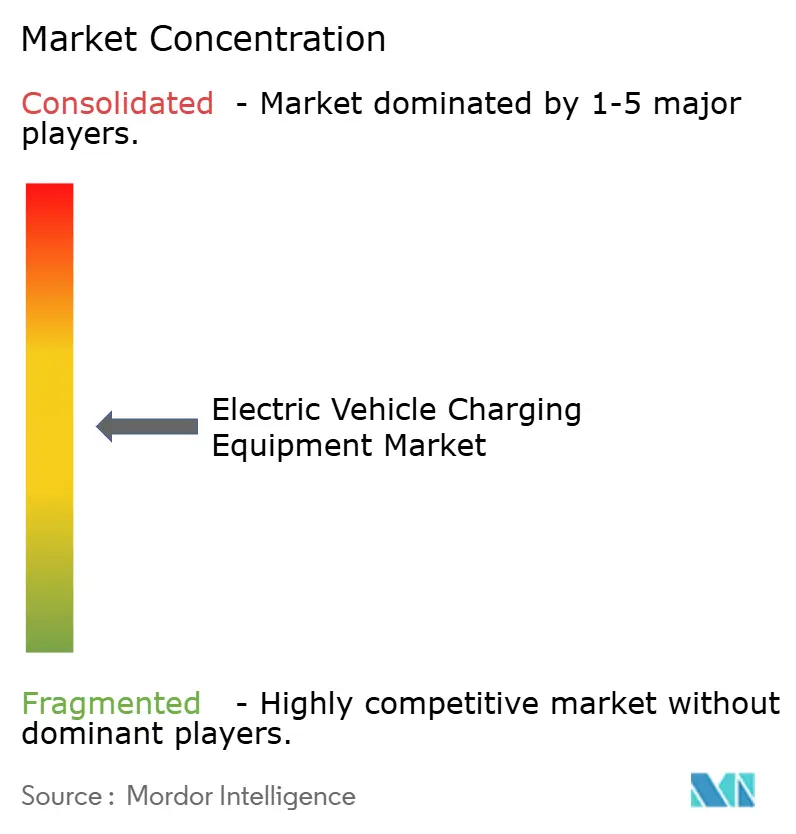
| Market Concentration | Medium |
Major Players *Disclaimer: Major Players sorted in no particular order Image © Mordor Intelligence. Reuse requires attribution under CC BY 4.0. | |
Electric Vehicle Charging Equipment Market Analysis by Mordor Intelligence
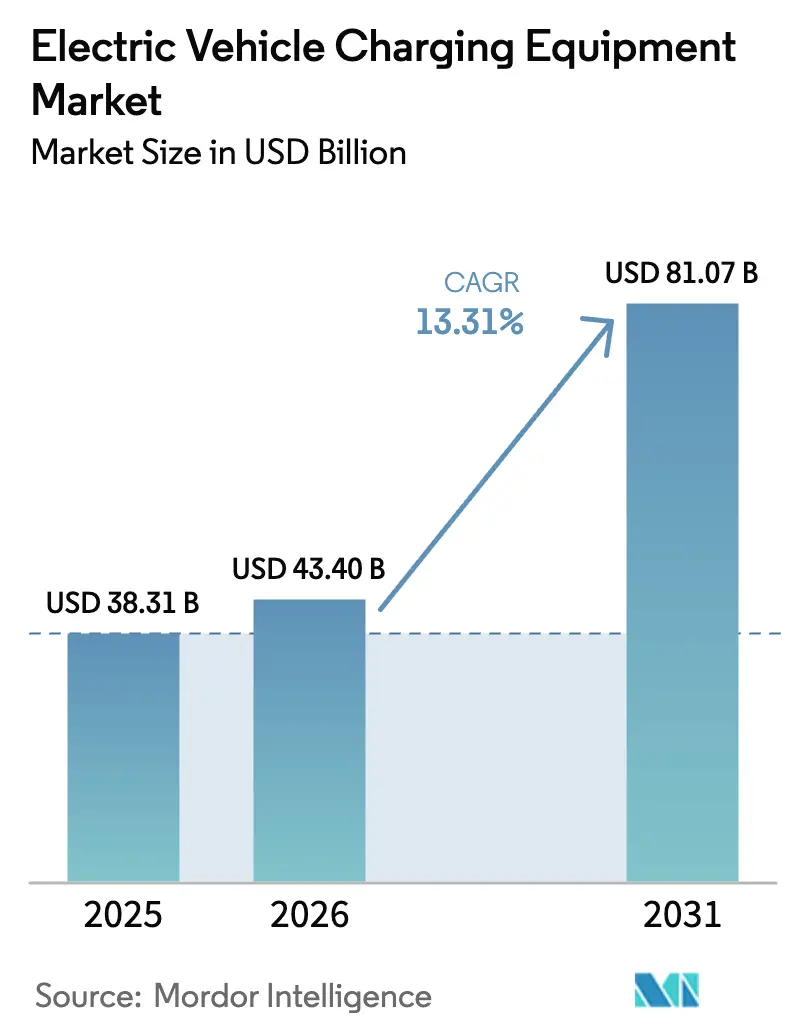
The Electric Vehicle Charging Equipment Market size is expected to grow from USD 38.31 billion in 2025 to USD 43.4 billion in 2026 and is forecast to reach USD 81.07 billion by 2031 at 13.31% CAGR over 2026-2031.
The market size trajectory reflects rising zero-emission mandates, expanding megawatt-class heavy-duty charging, and silicon-carbide cost deflation, which together accelerate fleet economics and stimulate large-scale infrastructure roll-outs. Grid operators are grappling with distribution-transformer limits in dense cities, yet deferral is not an option because public-access coverage targets carry regulatory deadlines.[1]“Global EV Outlook 2024,” International Energy Agency, iea.org Asia-Pacific retains a commanding lead, residential demand anchors baseline volume, and megawatt systems are redefining depot economics for trucks. Competitive fragmentation persists because connector divergence requires parallel product lines, but modular designs and service-centric business models are proving effective paths to share gain. Increasingly, the electric vehicle charging equipment market is shifting from opportunistic installs to high-utilization sites that embed chargers within broader energy ecosystems such as storage, solar, and vehicle-to-grid services.
Key Report Takeaways
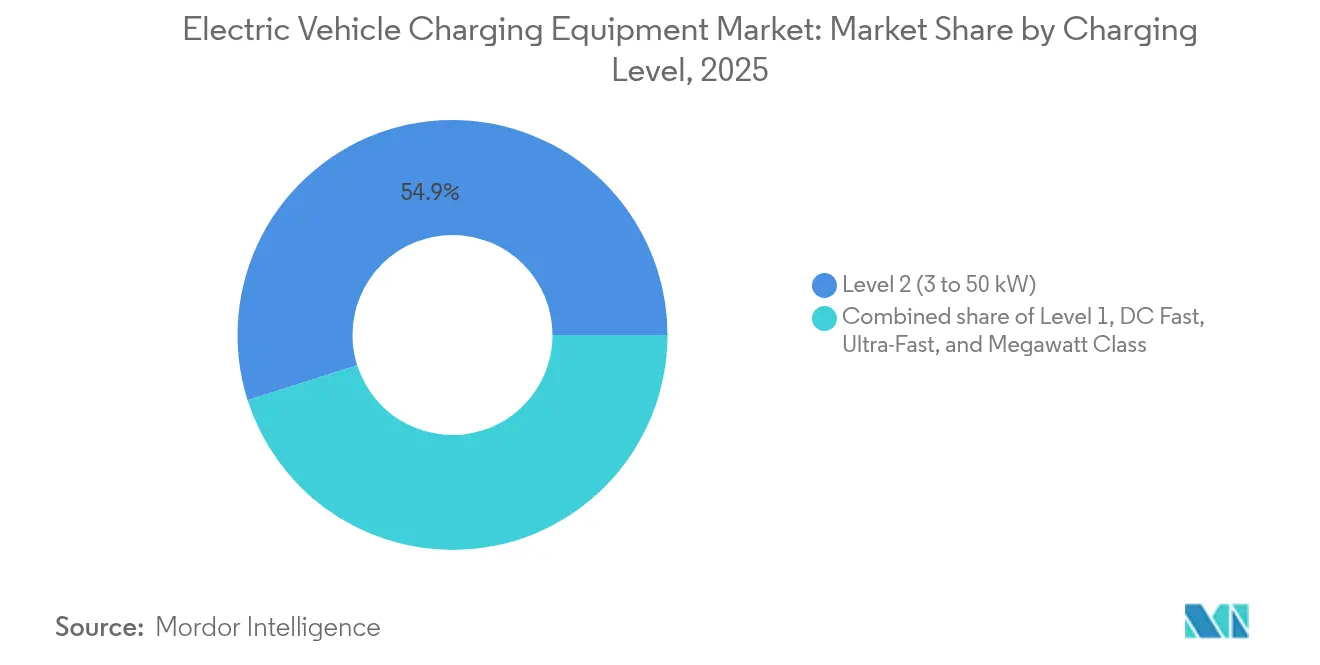
- By charging level, Level 2 units led with 54.90% revenue share in 2025; megawatt-class systems are projected to advance at a 24.51% CAGR to 2031.
- By installation site, residential locations commanded 44.60% of the electric vehicle charging equipment market share in 2025; transportation hubs are expected to grow at a 21.63% CAGR through 2031.
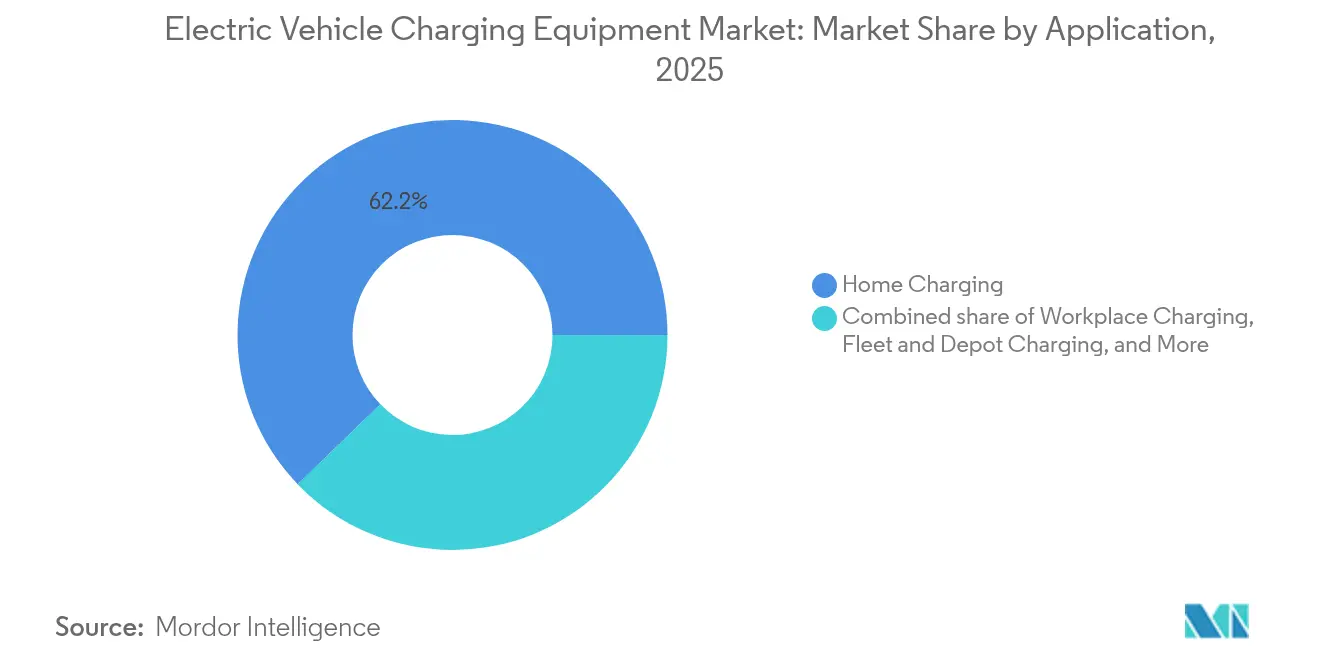
- By application, home charging accounted for a 62.20% share of the electric vehicle charging equipment market size in 2025, while fleet depot installations are set to expand at a 30.12% CAGR between 2026-2031.
- By geography, Asia-Pacific captured 59.60% revenue share in 2025 and is forecast to register a 16.52% CAGR up to 2031.
Note: Market size and forecast figures in this report are generated using Mordor Intelligence’s proprietary estimation framework, updated with the latest available data and insights as of 2026.
Global Electric Vehicle Charging Equipment Market Trends and Insights
Drivers Impact Analysis*
| Driver | (~) % Impact on CAGR Forecast | Geographic Relevance | Impact Timeline |
|---|---|---|---|
| Soaring EV parc and mandated zero-emission targets | +3.5% | Global, strongest in EU, California, China | Medium term (2-4 years) |
| Record public and private capex on roll-outs | +2.8% | North America, Europe, Chinese urban clusters | Short term (≤ 2 years) |
| Falling hardware CAPEX per kW | +2.2% | Global, APAC manufacturing hubs | Long term (≥ 4 years) |
| Smart-charging and vehicle-to-grid incentives | +1.8% | Europe, California, Australia | Medium term (2-4 years) |
| Megawatt-class HDV chargers (UNECE MCS) | +1.5% | Europe, North America, Japan, South Korea | Long term (≥ 4 years) |
| Accessibility regulations (PAS 1899) | +0.9% | United Kingdom, spillover to EU, North America | Short term (≤ 2 years) |
| Source: Mordor Intelligence | |||
Soaring EV Parc and Mandated Zero-Emission Sales Targets
National and regional regulations requiring 100% zero-emission light-duty sales by 2035 in the European Union and similar mandates in California tighten charging-infrastructure timelines.[2]“CO2 Standards for Cars and Vans,” European Commission, europa.eu China’s New Energy Vehicle mandate already pushed EV share of new-car sales to 40% in 2024, with new incentives expanding to light commercial classes. The global electric vehicle charging equipment market, therefore, faces a structural supply-demand mismatch because public charge-point growth lagged EV stock growth in 2024. Automakers are co-investing, with Ford and General Motors committing USD 1 billion to North American networks to mitigate range anxiety. For equipment vendors, the implication is clear: high-utilization corridors and fleet depots that guarantee throughput will dominate capital allocation during the forecast horizon.
Record Public and Private Capex on Charging Roll-Outs
The United States is disbursing USD 5 billion via the NEVI program to 2026, while the EU’s Alternative Fuels Infrastructure Regulation mandates one public charger every 60 kilometers on core routes by 2026. Private actors echo this intensity; Shell Recharge Solutions targets 50,000 European charge points by 2025, and BP Pulse earmarked GBP 1 billion for U.K. sites through 2030. Dual capital streams accelerate site acquisition yet compress operator margins because public tenders enforce open-access conditions that limit tariff flexibility. Suppliers now favor turnkey contracts bundling hardware, installation, and maintenance, which transfer operational risk in exchange for recurring revenue streams.
Falling Hardware CAPEX per kW
Silicon-carbide power modules cut converter losses by 30% versus legacy silicon, shrinking cooling and cabinet dimensions and reducing a 150 kW fast charger’s cost from USD 45,000 in 2022 to USD 35,000 in 2024.[3]“2024 EV Charging Cost Benchmark,” IEEE Power Electronics Society, ieee.org Learning-curve effects mirror historic solar PV declines, and depot operators can now deploy higher-power units without proportional spending. Supply risk persists because three wafer makers control 70% of capacity, prompting equipment builders to design modular stages that accept both silicon and silicon-carbide devices, insulating production schedules from shocks.
Smart-Charging and Vehicle-to-Grid Incentives
Utilities offer time-of-use tariffs as low as USD 0.12 per kilowatt-hour during off-peak windows in California, compared with USD 0.45 at evening peaks. Denmark’s V2G pilot demonstrated EUR 400 annual revenue per fleet vehicle by selling frequency-regulation capacity.[4]“Frederiksberg Forsyning V2G Pilot Results,” Frederiksberg Forsyning, forsyning.dk Hardware that embeds ISO 15118 compliance and advanced load management is displacing legacy models that treat chargers as passive endpoints. Software differentiation is therefore pivotal as the electric vehicle charging equipment market evolves into a distributed grid-services platform.
Restraints Impact Analysis*
| Restraint | (~) % Impact on CAGR Forecast | Geographic Relevance | Impact Timeline |
|---|---|---|---|
| Up-front installation and grid-upgrade costs | -1.2% | Global, acute in dense cities and rural links | Short term (≤ 2 years) |
| Uneven global standards and connector split | -0.8% | Global, China-EU-North America divergence | Medium term (2-4 years) |
| Distribution-grid congestion in cities | -0.6% | North America, Europe, select APAC metros | Medium term (2-4 years) |
| Accessibility retrofits lift total cost | -0.4% | United Kingdom, EU, North America | Short term (≤ 2 years) |
| Source: Mordor Intelligence | |||
Up-Front Installation and Grid-Upgrade Costs
Total installed cost for a 150 kW fast charger spans USD 100,000-150,000 before potential USD 50,000-200,000 transformer upgrades. Independent hosts face multi-year paybacks, and utilization often sits below 30% in secondary markets, extending breakeven beyond seven years. Subsidies help but are oversubscribed and slow to disburse, reinforcing a two-tier landscape where large networks secure premium sites while smaller operators cluster in high-traffic nodes.
Uneven Global Standards and Connector Fragmentation
Four dominant fast-charging standards oblige automakers to regionalize vehicle ports and compel equipment vendors to certify parallel product lines, inflating the total cost of ownership by up to 12%. Tesla’s NACS licensing accelerates North American convergence, but Europe remains committed to CCS and China to GB/T, so suppliers juggle inventory and R&D across divergent protocols.
*Our forecasts treat driver/restraint impacts as directional, not additive. The impact forecasts reflect baseline growth, mix effects, and variable interactions.
Segment Analysis
By Charging Level: Megawatt Systems Reshape Heavy-Duty Economics
Level 2 technology accounted for 54.90% of 2025 revenue, underpinning residential, workplace, and retail dwell patterns that tolerate 3-50 kW overnight or multihour sessions. Within this category, smart-connected models supporting load balancing are becoming the default specification. DC fast chargers spanning 50-150 kW remain the public-network workhorse, balancing acceptable session times against moderate grid requirements. Ultra-fast 150-350 kW units proliferate at premium retail and highway locations where motorists pay for convenience. The electric vehicle charging equipment market size for megawatt-class systems will grow fastest because logistics operators need 30-minute truck turnarounds to preserve asset utilization. Truck OEMs target 2026 commercial launches with packs engineered for 2 MW charge acceptance, and depot builders are pre-wiring sites to avoid ripping and replacing conduit later. Early mover advantage centers on access to high-voltage interconnections and real estate adjacent to freight corridors, setting high barriers for late entrants.
Growing megawatt adoption reshapes supplier value propositions. Cabinets must integrate advanced thermal management, liquid-cooled cabling, and cybersecurity-hardened communication under ISO 15118-20. Vendors that modularize power stages can upsell capacity upgrades without forklift replacements, lowering lifetime cost for fleet owners. Conversely, Level 1 units are relegated to legacy garages and as emergency back-ups because 8-12 hour charge windows no longer align with urban mobility patterns. Across tiers, software capability now differentiates offerings even more than rated power, as site hosts demand dashboards that optimize schedules against time-of-use tariffs and grid-service revenue streams. As these dynamics unfold, the electric vehicle charging equipment market will pivot from hardware-centric competition toward integrated hardware-software-service stacks.


By Installation Site: Transportation Hubs Emerge as Growth Pole
Residential sites retained 44.60% of 2025 revenue because 70% of charging occurs at homes where single-family garages offer low-cost installation and cheap off-peak tariffs. Multi-unit dwellings are emerging battlegrounds given growing urban EV adoption, and landlords increasingly deploy networked Level 2 clusters managed under subscription models that pass through electricity cost. Transportation hubs such as airports, seaports, and intermodal terminals will outpace all other venue types at a 21.63% CAGR through 2031. These locations combine captive fleet demand, industrial-scale grid connections, and contractual clarity over cost recovery. Airports already treat charging as ancillary revenue, with concession models guaranteeing minimum payments from operators. Seaports deploy megawatt systems to eliminate diesel gensets for cargo equipment, leveraging existing medium-voltage feeders.
Commercial retail hosts capture mid-dwell customer visits, but utilization volatility and competitive density can compress margins unless augmented with loyalty programs or bundled energy-storage participation. Municipal curbside programs fill critical gaps for apartment dwellers yet face protracted permitting and right-of-way constraints. The electric vehicle charging equipment market share will therefore coalesce around site classes that combine predictable demand, grid headroom, and straightforward permitting, relegating ad-hoc public curbside projects to supplemental roles.
By Application: Fleet Depots Drive the Sharpest Expansion
Home charging dominated 62.20% of 2025 application revenue, reflecting low tariff rates and overnight dwell times that align perfectly with personal-vehicle cycles. Yet fleet depots will register a blistering 30.12% CAGR to 2031, transforming the demand landscape for high-power hardware. Logistics firms, municipal transit agencies, and parcel couriers prioritize uptime and can orchestrate charging schedules to minimize demand charges, often installing on-site batteries to shave peaks. Depot projects are shifting from single-digit charger counts to triple-digit deployments as total-cost-of-ownership parity versus diesel arrives within three years on urban routes. Consequently, suppliers now bundle predictive maintenance and telematics integration into multi-year service agreements.
Workplace charging growth moderates because hybrid work schedules reduce daily commuter volume. Public urban fast charging remains vital for ride-hail drivers and apartment residents but faces utilization risk outside peak hours. Highway corridor networks still struggle to cross 25% utilization except during holiday peaks, which challenges the standalone economics unless subsidized. Altogether, the electric vehicle charging equipment market continues to diversify, yet the epicenter of hardware demand is shifting decisively toward professionally managed depots that require high reliability and deep software integration.
Geography Analysis
Asia-Pacific held 59.60% of 2025 revenue and is set to grow at 16.52% CAGR to 2031, buoyed by China’s mandate of one public charger per 15 EVs by 2025 and its practice of embedding chargers into wider urban-renewal budgets rather than treating them as stand-alone capex. India’s building codes now require commercial premises larger than 500 m² to dedicate 20% of parking bays to chargers, adding an expected 50,000 new points annually. Japan funds 50 megawatt depot hubs for buses and trucks, while South Korea supports battery-swap pilots that nonetheless require megawatt-class site infrastructure. ASEAN states attract Chinese vendors offering low-cost units tailored to price-sensitive buyers.
Europe enforces the most prescriptive rules globally, demanding one public charger every 60 kilometers on core corridors by 2026. Norway leads with one public charger per 15 residents as early as 2024 due to state utility co-investment, and Germany’s Deutschlandnetz contract awards in 2024 will erect another 8,000 fast chargers along Autobahns. The U.K. focuses on on-street lamp-post chargers to serve urban renters, adding 5,000 units in London alone during 2024. These developments collectively fortify Europe as the most standardized region for connector and payment interoperability, which in turn reduces project friction for suppliers.
North America splits into a federally funded interstate corridor build-out in the United States and provincial utility-led deployments in Canada. NEVI funds guarantee coverage along designated alternative fuel corridors, while Canadian utilities partner with provincial governments to extend reach into remote regions. Mexico remains nascent but benefits from cross-border automaker investments near the United States–Mexico–Canada Agreement corridor. South America’s charging build-out concentrates in Brazil and Chile, each leveraging industrial decarbonization agendas. Middle East and Africa remain early stage, although large sovereign funds in the Gulf Cooperation Council have earmarked sizeable budgets for charging infrastructure aligned with net-zero visions.
Mordor Intelligence provides coverage of the electric vehicle charging equipment market across other key regional markets, including North America, South America, Asia, South East Asia, Europe, and Europe, each with their regulatory frameworks and demand patterns. Detailed country-level analysis extends to Australia, Spain, Sweden, and South Korea incorporating local coverage and market participation, as required.

Competitive Landscape
The top five suppliers, ABB, Tesla, Siemens, ChargePoint, and Schneider Electric, collected 35% of 2024 revenue, evidencing moderate concentration in the electric vehicle charging equipment market. Conglomerates leverage vertically integrated portfolios and global service footprints. Tesla operates 50,000 proprietary stalls and now monetizes network usage by third-party vehicles after opening its North American Charging Standard. ChargePoint and Blink differentiate through cloud platforms aggregating utilization, tariff management, and fleet telematics. Chinese price challengers BYD, StarCharge, and NaaS target Southeast Asia and Latin America with hardware priced 20% below Western incumbents, forcing incumbents to stress software and service value.
White-space opportunity remains in rural highways where utilization rarely tops 20% and in mixed-use commercial sites lacking clear cost-recovery mechanisms. Asset-light models thrive; Electrify America’s partnership with Walmart reduces site acquisition friction while preserving operational revenue. Technology leadership increasingly hinges on grid-service participation. ABB’s Terra 360, certified for bidirectional flow in 2024, can earn ancillary grid revenue that boosts project returns by up to 20% in markets with mature service auctions. Predictive maintenance powered by embedded sensors and remote diagnostics cuts truck-roll rates, saving 30%-40% in service costs over contract life. Consequently, competitive dynamics hinge less on nominal power rating and more on the ability to deliver uptime, grid services, and lifecycle cost reduction.
Electric Vehicle Charging Equipment Industry Leaders
ABB Ltd
Tesla Inc.
Siemens AG
ChargePoint Holdings
Shell Recharge (incl. NewMotion)
- *Disclaimer: Major Players sorted in no particular order

Recent Industry Developments
- December 2025: Kerala State Electricity Board (KSEB) pinpointed 340 sites statewide to establish EV charging stations, bolstering the state's electric vehicle initiative under the PM E-DRIVE project.
- December 2025: Nayax Ltd., a global leader in commerce and payment solutions, acquired Lynkwell, an AI-driven platform for electric vehicle charging. The deal, worth USD 25.9 million in cash at closing, includes a potential earnout based on profitability metrics in the year following the acquisition.
- December 2025: In a bid to bolster Bulgaria's electric vehicle charging infrastructure, Electrocharge, a prominent charging station chain, has teamed up with a leading petrol gas station chain. Over the next three years, the duo aims to establish more than 200 charging points strategically located on major roads, highways, and central city areas.
- December 2025: Enphase Energy has kicked off the initial shipments of its cutting-edge IQ EV Charger 2 to U.S. customers. This latest charger boasts features like solar-aware charging controls, enhanced power configurations, and tailored communication protocols, making it ideal for both residential and small commercial use.


Global Electric Vehicle Charging Equipment Market Report Scope
Electric vehicle (EV) charging equipment refers to the infrastructure and devices required to charge electric vehicles, which include battery electric vehicles (BEVs) and plug-in hybrid electric vehicles (PHEVs). These charging systems enable EVs to replenish their electrical energy, allowing them to continue driving. The charging equipment can be categorized into different levels based on the power output and charging time.
The global electric vehicle charging equipment market is segmented by charging level, installation site, application, and geography. By charging level, the market is segmented into level 1, level 2, DC fast, ultra-fast, and megawatt-class. By installation site, the market is segmented into residential, commercial and retail, public municipal, and transportation hubs. By application, the market is segmented into home, workplace, public urban, highway corridor, and fleet and depot. The report also covers the market size and forecasts across several major regions. For each segment, the market size and forecasts are provided in terms of revenue (USD).
| Level 1 (Up to 3 kW) |
| Level 2 (3 to 50 kW) |
| DC Fast (50 to 150 kW) |
| Ultra-Fast (150 to 350 kW) |
| Megawatt Class (Above 350 kW) |
| Residential |
| Commercial and Retail |
| Public Municipal |
| Transportation Hubs (Airports, Ports) |
| Home Charging |
| Workplace Charging |
| Public Urban Charging |
| Highway Corridor/En-Route Fast Charging |
| Fleet and Depot Charging |
| North America | United States |
| Canada | |
| Mexico | |
| Europe | Germany |
| United Kingdom | |
| France | |
| Italy | |
| Spain | |
| Netherlands | |
| Norway | |
| Russia | |
| Rest of Europe | |
| Asia-Pacific | China |
| India | |
| Japan | |
| South Korea | |
| ASEAN Countries | |
| Australia and New Zealand | |
| Rest of Asia Pacific | |
| South America | Brazil |
| Argentina | |
| Colombia | |
| Rest of South America | |
| Middle East and Africa | Saudi Arabia |
| United Arab Emirates | |
| South Africa | |
| Egypt | |
| Rest of Middle East and Africa |
| By Charging Level | Level 1 (Up to 3 kW) | |
| Level 2 (3 to 50 kW) | ||
| DC Fast (50 to 150 kW) | ||
| Ultra-Fast (150 to 350 kW) | ||
| Megawatt Class (Above 350 kW) | ||
| By Installation Site | Residential | |
| Commercial and Retail | ||
| Public Municipal | ||
| Transportation Hubs (Airports, Ports) | ||
| By Application | Home Charging | |
| Workplace Charging | ||
| Public Urban Charging | ||
| Highway Corridor/En-Route Fast Charging | ||
| Fleet and Depot Charging | ||
| By Geography | North America | United States |
| Canada | ||
| Mexico | ||
| Europe | Germany | |
| United Kingdom | ||
| France | ||
| Italy | ||
| Spain | ||
| Netherlands | ||
| Norway | ||
| Russia | ||
| Rest of Europe | ||
| Asia-Pacific | China | |
| India | ||
| Japan | ||
| South Korea | ||
| ASEAN Countries | ||
| Australia and New Zealand | ||
| Rest of Asia Pacific | ||
| South America | Brazil | |
| Argentina | ||
| Colombia | ||
| Rest of South America | ||
| Middle East and Africa | Saudi Arabia | |
| United Arab Emirates | ||
| South Africa | ||
| Egypt | ||
| Rest of Middle East and Africa | ||


Key Questions Answered in the Report
How large is the electric vehicle charging equipment market in 2026?
The market stands at USD 43.4 billion in 2026 and is on track for USD 81.07 billion by 2031, implying a 13.31% CAGR over 2026-2031.
Which charging level is most common today?
Level 2 units dominate with 54.90% of 2025 revenue because they match residential and workplace dwell times.
What drives the surge in megawatt-class chargers?
Logistics fleets need 30-minute stops for heavy-duty trucks, and the UNECE MCS standard now supports up to 3.75 MW per connector.
Which region leads in public charging deployment?
Asia-Pacific commands 59.60% revenue share thanks to China's aggressive integration of charging into smart-city programs.
How are operators managing grid constraints?
Many co-locate battery storage and use smart-charging software to shift loads to off-peak periods, avoiding demand charges.
What is the expected CAGR for fleet depot installations?
Fleet depots are forecast to grow at 30.12% CAGR between 2026-2031 as commercial operators electrify vans, trucks, and buses.
Page last updated on:


