Market Overview
| Study Period | 2020 - 2031 |
|---|---|
| Forecast Data Period | 2026 - 2031 |
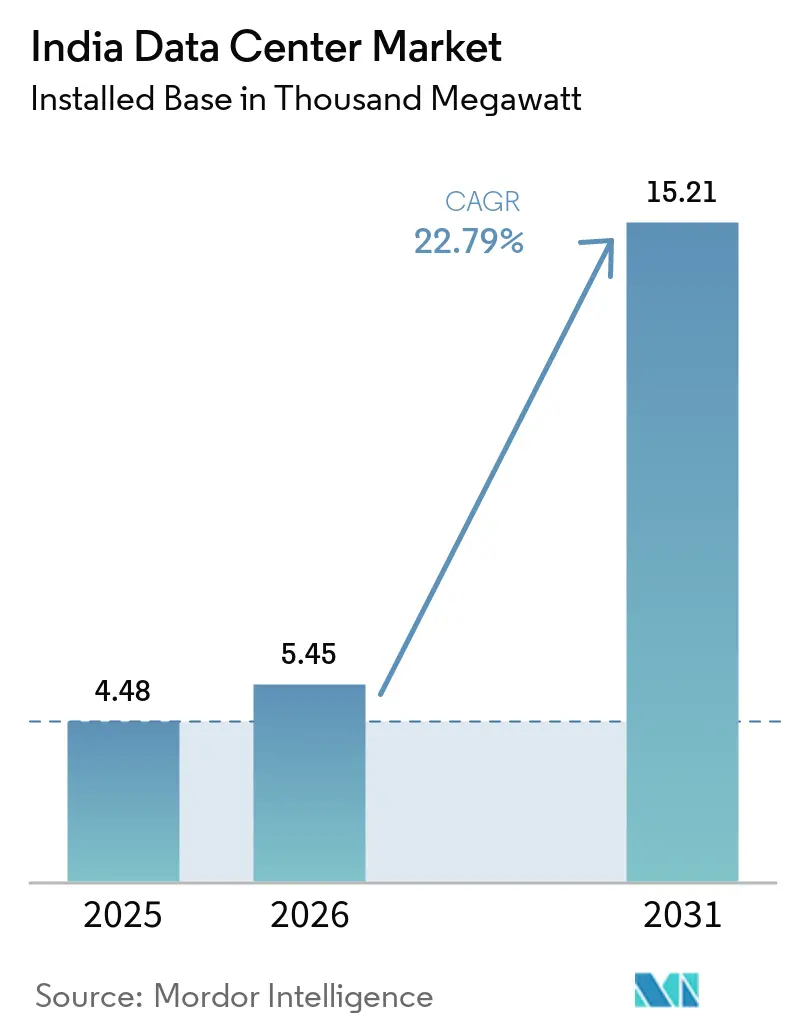
| Base Year Market Size (2025) | 4.48 Thousand megawatt |
| Market Volume (2026) | 5.45 Thousand megawatt |
| Market Volume (2031) | 15.21 Thousand megawatt |
| Growth Rate (2026 - 2031) | 22.79% CAGR |
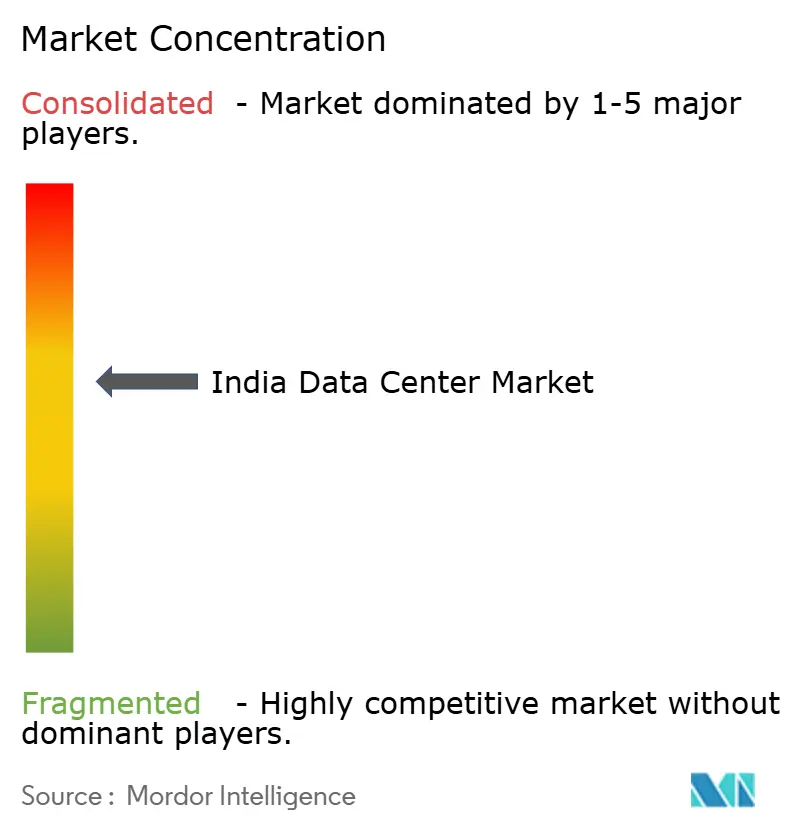
| Market Concentration | Medium |
Major Players*Disclaimer: Major Players sorted in no particular order Image © Mordor Intelligence. Reuse requires attribution under CC BY 4.0. | |
India Data Center Market Analysis by Mordor Intelligence
The India Data Center Market size in terms of installed base was valued at 4.48 thousand megawatt in 2025 and is estimated to grow from 5.45 thousand megawatt in 2026 to reach 15.21 thousand megawatt by 2031, at a CAGR of 22.79% during the forecast period (2026-2031). This surge reflects sovereign data-localization mandates under the Digital Personal Data Protection Act 2023, hyperscale commitments topping USD 30 billion from Microsoft and Google, and the arrival of 220 Tbps of new subsea capacity in Chennai and Mumbai. Colocation still dominates installed capacity, yet hyperscale self-builds are accelerating as enterprises seek dedicated GPU clusters for large-scale language model training. Power economics are emerging as a decisive differentiator because renewable-linked round-the-clock power-purchase agreements (PPAs) can cut operating expenses by up to 30% relative to grid tariffs. At the same time, the spread of 5G fixed-wireless access is nudging compute closer to end users, lifting demand for 10-20 MW edge nodes in Tier-II metros.
Key Report Takeaways
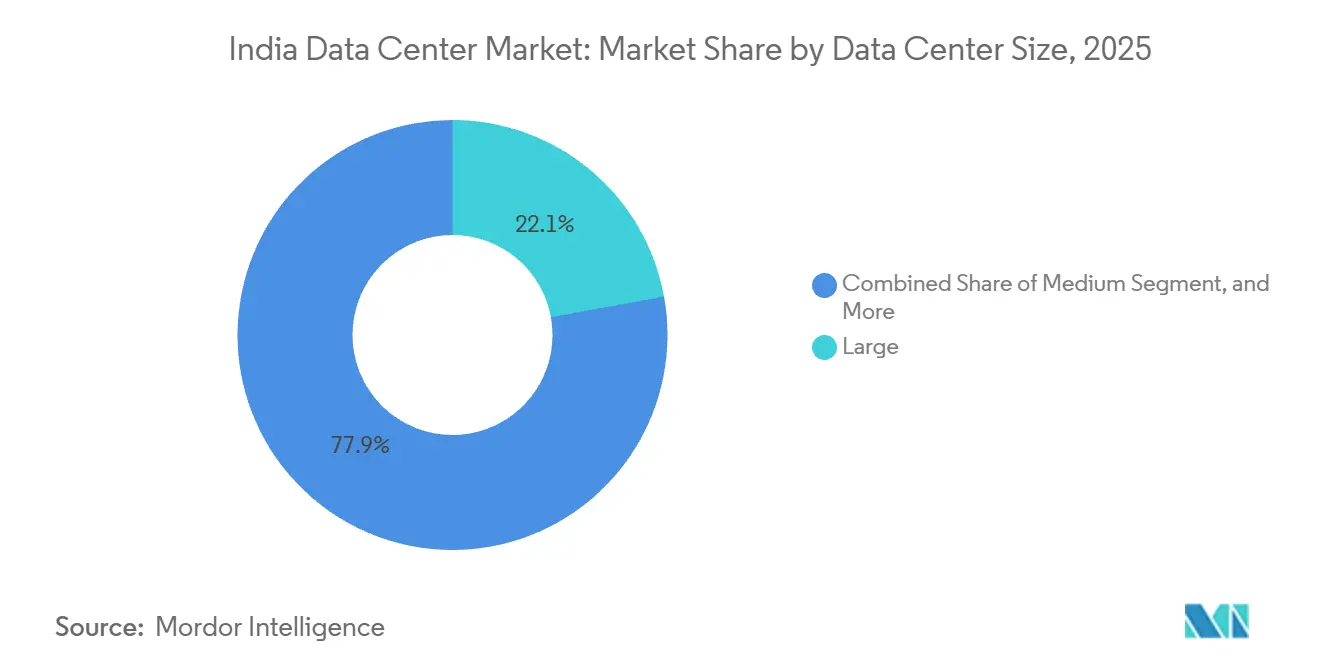
- By data center size, large facilities led with 22.14% share in 2025, while medium facilities are projected to advance at a 23.11% CAGR through 2031.
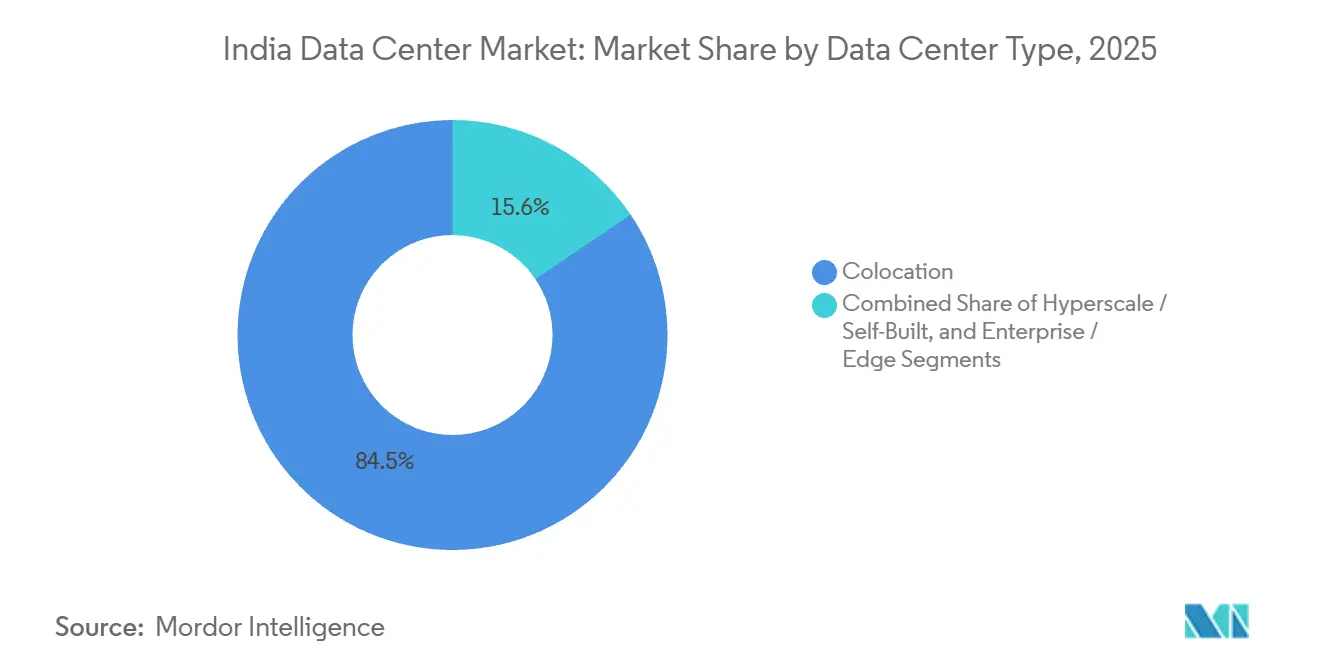
- By data center type, colocation captured 84.45% share in 2025, whereas hyperscale self-builds are forecast to expand at a 23.63% CAGR to 2031.
- By end user, IT and ITES accounted for 45.96% of the India data center market size in 2025, while BFSI workloads are growing at a 24.59% CAGR through 2031.
- By tier, Tier 3 secured 49.15% of the India data center market share in 2025, and Tier 4 sites are rising at a 23.42% CAGR through 2031.
- By hotspot, Chennai held 14.29% share in 2025, whereas Bengaluru is projected to expand at a 23.78% CAGR over 2026-2031.
Note: Market size and forecast figures in this report are generated using Mordor Intelligence’s proprietary estimation framework, updated with the latest available data and insights as of 2026.
India Data Center Market Trends and Insights
Drivers Impact Analysis*
| Driver | (~) % Impact on CAGR Forecast | Geographic Relevance | Impact Timeline |
|---|---|---|---|
| Explosive Growth in Hyperscale Cloud Deployments | +6.2% | National, with concentration in Mumbai, Hyderabad, Chennai | Medium term (2-4 years) |
| Mandated Data Localization Under DPDP Act | +5.8% | National, affecting all sectors handling personal data | Short term (≤ 2 years) |
| Submarine Cable Landing Expansions | +3.4% | Coastal hubs—Chennai, Mumbai, with spillover to Bengaluru, Hyderabad | Medium term (2-4 years) |
| Rising AI-ML Workload Intensity Requiring GPU-Dense Racks | +4.1% | National, early adoption in Bengaluru, Hyderabad, Pune | Long term (≥ 4 years) |
| Renewable-Linked Round-the-Clock Private PPAs Lowering OPEX | +2.7% | Karnataka, Tamil Nadu, Telangana with renewable mandates | Medium term (2-4 years) |
| Emergence of Tier-II Edge Clusters Driven by 5G FWA | +1.9% | Tier-II cities—Pune, Ahmedabad, Kolkata, Jaipur, Kochi | Long term (≥ 4 years) |
| Source: Mordor Intelligence | |||
Explosive Growth in Hyperscale Cloud Deployments
Microsoft’s USD 17.5 billion commitment and Google’s USD 15 billion partnership with Adani are shifting the India data center market from lease-heavy to ownership-heavy models, reflecting broader growth across the data center market in India.[1]Microsoft, “Microsoft Announces USD 17.5 Billion Investment in India,” news.microsoft.com Hyperscalers are pre-committing 50-100 MW blocks and signing 15-year renewable PPAs to lock tariffs below INR 4 per kWh. AWS expanded its Mumbai region by 40% in January 2025, underscoring how new availability zones quickly absorb capacity and highlighting continued data center growth in India.[2]AWS, “AWS Announces Third Availability Zone in Mumbai Region,” aws.amazon.com Oracle’s dual-region plan in Hyderabad demonstrates the pull of inland power advantages over the proximity of coastal fiber. Finally, the IndiaAI Mission’s allocation of 34,000 GPUs obliges clouds to interoperate with sovereign compute pools, fragmenting demand across commercial and public clouds.[3]Ministry of Electronics and IT, “IndiaAI Mission Document,” meity.gov.in
Mandated Data Localization Under DPDP Act
The Digital Personal Data Protection Act 2023 compels global enterprises to host production databases inside India, eliminating previous routes through Singapore or Ireland. Reserve Bank of India circulars require payment-system data to reside in Tier 3 or better facilities, creating a compliance-driven demand pool estimated at 1,200 MW by 2027. Healthcare and pharmaceutical operators anticipate similar mandates under the proposed Digital Health Authority framework. Although the Act permits offshore transfers for anonymized research datasets, divergent legal opinions add uncertainty for multinationals.
Submarine Cable Landing Expansions
SEA-ME-WE-6’s 220 Tbps landing trims India-Europe latency to 85 ms and India-Singapore latency to 22 ms, enabling real-time workloads from domestic shores and strengthening data center infrastructure in India. Chennai now anchors five active cable systems, drawing CDN caches and gaming servers that require sub-25 ms round-trip times. The India-Asia-Xpress cable will inject another 200 Tbps in 2026, reinforcing a two-tier geography in which coastal sites win latency-sensitive traffic while inland campuses pursue power-cost arbitrage. Bengaluru must backhaul traffic 350 km from Chennai, adding 4-6 ms, which rules it out for ultra-low-latency trading.
Rising AI-ML Workload Intensity Requiring GPU-Dense Racks
IndiaAI Mission and private-sector demand are pushing rack densities from 8 kW to 25-40 kW, exceeding air-cooling limits. Operators are adopting liquid systems that add up to USD 800,000 per MW in capex but unlock GPU cluster viability, supporting expansion of the India data center cooling market. CtrlS deployed direct-to-chip cooling in Hyderabad to support 40 kW racks. With NVIDIA H100 units priced at USD 25,000-40,000, enterprises prefer to amortize hardware within self-builds or wholesale suites. Demand is most acute in Bengaluru, where GPU demand exceeds supply by 150 MW and rack lead times are 9-12 months.
Restraints Impact Analysis*
| Driver | (~) % Impact on CAGR Forecast | Geographic Relevance | Impact Timeline |
|---|---|---|---|
| Inter-State Power Tariff Differentials | -2.1% | National, most acute in Maharashtra, Delhi-NCR versus Karnataka, Tamil Nadu | Short term (≤ 2 years) |
| Land Acquisition Delays in Coastal Hubs | -1.8% | Mumbai, Chennai, with spillover to Navi Mumbai, Kanchipuram | Medium term (2-4 years) |
| Shortage of Specialized Data Center Construction Labour | -1.3% | National, concentrated in Tier-I metros | Short term (≤ 2 years) |
| Grid Interconnection Queue Bottlenecks for >100 MVA Loads | -2.0% | Maharashtra, Karnataka, Tamil Nadu | Medium term (2-4 years) |
| Source: Mordor Intelligence | |||
Inter-State Power Tariff Differentials
Industrial tariffs range from INR 4.50 to 7.20 per kWh, creating an annual USD 15 million delta for a 50 MW plant.[4]Maharashtra State Electricity Distribution, “Industrial Power Tariffs,” mahadiscom.in Karnataka’s renewable policy waives cross-subsidy surcharges for 100% hybrid PPA users, pushing effective rates to INR 3.80 per kWh. Maharashtra adds a 15% wheeling levy on captive renewables, funneling new builds south despite Mumbai’s fiber edge. Operators must balance latency and opex; Yotta’s 250 MW Greater Noida project accepts 8-10 ms extra latency for cheaper power.
Grid Interconnection Queue Bottlenecks for More Than 100 MVA Loads
Transmission upgrades trail demand by up to two years in Maharashtra, Karnataka, and Tamil Nadu. New sites above 50 MW must fund dedicated 220 kV substations, adding USD 8-12 million and 15 months to schedules. Navi Mumbai faces a 36-month backlog as utilities prioritize residential loads, so AdaniConneX paired its Chennai campus with a 50 MW battery to bridge interconnection delays. Karnataka clears 100 MVA connects in nine months, accentuating the South’s advantage.
*Our forecasts treat driver/restraint impacts as directional, not additive. The impact forecasts reflect baseline growth, mix effects, and variable interactions.
Segment Analysis
By Data Center Size: Edge-Oriented Medium Facilities Gain Momentum
Large facilities led with a 22.14% share in 2025, while medium facilities are projected to advance at a 23.11% CAGR through 2031, reflecting strong growth of data centers in India. Medium facilities are forecast to grow as 5G architectures place compute within 30 km of cell sites. Jio’s rollout across 150 cities fuels autonomous telemetry, cloud gaming, and industrial IoT that cannot tolerate backhaul to Tier-I metros. Small sites under 5 MW are still expanding at 20.8%, serving disaster recovery and dev-test needs.
Hyperscale campuses above 50 MW, led by Microsoft’s 100 MW Hyderabad region, anchor batch analytics and archival storage. Large sites between 20 and 50 MW act as staging grounds for future hyperscale expansion, but grow more slowly than the medium tier. The dual-track pattern mirrors global trends where real-time inference shifts to the edge while colder workloads stay centralized. CtrlS’s replicable 15 MW designs, deployable in nine months, illustrate the agility of medium facilities.


By Tier Type: Regulatory Pressure Lifts Tier 4 Adoption
Tier 3 controlled 49.15% of the India data center market share in 2025, yet Tier 4 installations are on course for a 23.42% CAGR through 2031 as BFSI and government workloads demand six-nines uptime. Reserve Bank of India rules require payment system data to reside in Tier 4 data centers, prompting HDFC Bank and ICICI Bank to commission dedicated campuses. Upgrading legacy Tier 3 halls requires moving from N+1 to 2N+1 redundancy, adding dual feeds and diesel rotary UPS arrays. Operators with pre-certified modular designs beat the nine-month certification backlog.
Operators increasingly run cost-benefit analyses that favor Tier 4 builds when workloads exceed 5 MW and downtime tolerance falls below five minutes a year. Although capex premiums hover around 40%, the higher revenue yield from mission-critical tenants shortens payback periods to five or six years. Certification bottlenecks remain a swing factor, so providers with pre-approved modular blueprints can capture demand surges faster than greenfield rivals. As more banks, insurers, and public agencies refresh their three-year IT roadmaps, a steady shift from retrofit upgrades to ground-up Tier 4 campuses is expected to continue through 2031.
By Data Center Type: Self-Builds Narrow the Gap with Colocation
Colocation owned 84.45% of the India data center market share in 2025, highlighting the dominance of the data center colocation market, while hyperscale self-builds are growing at 23.63% CAGR as enterprises bypass retail mark-ups. Microsoft’s Hyderabad campus shows how buyers achieve sub-USD 0.08 per kWh by bundling renewable PPAs with captive cooling. Retail colo for SMEs still grows at 21.2%, yet wholesale suites leasing 1-5 MW blocks climb faster at 22.8% as banks and insurers want dedicated zones. AdaniConneX blends models by offering 50-100 MW of pre-commits within a multi-tenant framework.
The wholesale-to-retail mix inside colocation is tilting toward 70:30 because cloud providers and large enterprises now reserve contiguous multi-megawatt blocks years in advance. Edge-oriented demand from 5G and AI inference still supports a vibrant retail rack market, yet its growth rate trails wholesale suites by two to three percentage points. Looking ahead, blended models such as powered-shell campuses allow operators to hedge both directions, offering shell space for hyperscalers while retaining separate halls for smaller tenants. Competitive advantage will hinge on securing low-cost renewable power and demonstrating proficiency in liquid cooling rather than solely on square-footage inventory.
By End User: BFSI Surges Ahead of IT-ITES
BFSI compute is set to outgrow the baseline market by logging a 24.59% CAGR as Unified Payments Interface volumes soar and AI fraud analytics proliferate, further supporting the future of data centers in India. HDFC Bank’s GPU-based fraud engines illustrate the pivot from CPU to GPU infrastructure. IT-ITES remains the largest bucket at 45.96% in 2025, thanks to India’s 5 million tech workforce. E-commerce workloads grow 23.1% as flash sales push concurrent users beyond 10 million. Government demand, manufacturing, and media each advance above 21%, reflecting smart-city analytics, industrial IoT, and OTT streaming expansion.
Outside financial services, government ministries scaling the IndiaAI Mission, together with state-level smart-city projects, represent the next big pocket of GPU-driven demand. Manufacturing, logistics, and automotive firms are pushing predictive-maintenance and digital-twin workloads into private clouds, driving consistent 20%-plus annual growth in captive on-premise builds under 10 MW. Meanwhile, OTT streaming and e-commerce operators continue to experience capacity constraints during peak events, prompting long-term reservations of 5-MW chunks in coastal metros for latency-sensitive caching. Across all verticals, sustainability scorecards tied to Scope 2 emissions are beginning to influence site selection as strongly as tariff levels or network proximity.
Geography Analysis
Bengaluru is projected to grow at a 23.78% CAGR, driven by renewable-energy exemptions that cut tariffs to INR 3.80 per kWh. Microsoft’s 80 MW build validates the city’s draw despite back-haul latency. Chennai, anchored by five cable landings, captured a 14.29% share in 2025 and remains the latency hub for gaming and trading. Hyderabad and Mumbai each hold about 13% on the back of state subsidies and BFSI demand. Delhi-NCR hovers near 12% because high tariffs erode margins. Tier-II metros collectively grow at 22.4% as 5G fixed wireless pushes compute to the edge, with Yotta’s 15 MW Pune node serving as a template.
India’s coastal corridor dominates latency-sensitive workloads because five cable landings converge in Chennai and two in Mumbai. These hubs house almost one-third of the current IT load yet face 18-24-month land-acquisition delays, nudging some projects inland. Southern states leverage cheaper power and renewable mandates; Karnataka alone hosts 600 MW of announced builds drawing on solar-wind hybrids. Northern and western metros weigh user proximity against higher opex: Delhi-NCR and Mumbai hold 25% of installed megawatts but pay INR 2-3 more per kWh than Bengaluru.
Pune, Ahmedabad, Kolkata, and Jaipur combine affordable land, relaxed zoning, and state incentives for 10-20 MW nodes.Grid bottlenecks remain decisive. Maharashtra’s transmission utility has an 18-month queue for 100 MVA connects, delaying hyperscale projects in Navi Mumbai. Karnataka fast-tracks comparable approvals in nine months, cementing its edge despite costlier land. Operators deploy onsite batteries or gas peakers to bridge these gaps, as seen at AdaniConneX’s Chennai site.
Competitive Landscape
The market is of moderate concentration. NTT pre-funded 500 MW in Mumbai, while STT GDC added 100 MW in Chennai through a build-to-suit deal. CtrlS leverages state incentives by staging builds across Karnataka, Tamil Nadu, and Uttar Pradesh. Nxtra taps Bharti Airtel’s captive demand and targets an 800 MW footprint by 2028.
AdaniConneX couples renewable power with colocation, offering integrated contracts that beat grid tariffs by up to 25%. Yotta secured USD 350 million to pursue a 500 MW roadmap emphasizing rear-door heat exchangers for AI racks. Retrofit programs are widespread; Sify and Netmagic spend nearly USD 800,000 per MW bringing legacy halls to 30 kW rack readiness.
Competition peaks in Mumbai and Bengaluru, where land costs exceed USD 200 per m², and power PPAs must stay under INR 4 per kWh to meet investor hurdle rates. Operators differentiate through cooling technology, renewable sourcing, and speed of delivery. The wholesale-colocation mix now favors multi-MW blocks, shrinking white space for smaller tenants.
India Data Center Industry Leaders
Equinix Inc.
NTT Ltd
Nxtra Data Limited
STT Telemedia Global Data Centres India Private Limited
Sify Technologies Limited
- *Disclaimer: Major Players sorted in no particular order

Recent Industry Developments
- January 2026: Microsoft expanded its Hyderabad region by 50 MW, lifting regional IT load to 150 MW and adding GPU clusters for Azure OpenAI services.
- December 2025: AdaniConneX commissioned a 400 MW Chennai campus with 200 MW of integrated renewables and Tier 4 certification.
- November 2025: Yotta raised USD 200 million debt to fund a 250 MW Greater Noida project including 100 MW solar and 50 MW battery storage.
- October 2025: Google and Adani finalized a USD 15 billion alliance for cloud regions in Bengaluru, Delhi-NCR, and Mumbai, with the first 80 MW site due mid-2026.


India Data Center Market Report Scope
The data center market encompasses the infrastructure, services, and technologies that support the storage, management, and processing of data. This market includes various data center sizes, tier classifications, types, end-user industries, and hotspots, reflecting the diverse needs of businesses and organizations operating in the country.
The India Data Center Market Report is Segmented by Data Center Size (Small, Medium, Large, and Hyperscale), Tier Type (Tier 1 and 2, Tier 3, and Tier 4), Data Center Type (Hyperscale/Self-Built, Enterprise/Edge, and Colocation), End User (BFSI, IT and ITES, E-Commerce, Government, Manufacturing, Media and Entertainment, Telecom, and Other End Users), and Hotspot (Bengaluru, Chennai, Hyderabad, Mumbai, Delhi-NCR, and Rest of India). The Market Forecasts are Provided in Terms of IT Load Capacity (Megawatt).
By Data Center Size
| Small |
| Medium |
| Large |
| Hyperscale |
By Tier Type
| Tier 1 and 2 |
| Tier 3 |
| Tier 4 |
By Data Center Type
| Hyperscale / Self-Built | ||
| Enterprise / Edge | ||
| Colocation | Non-Utilized | |
| Utilized | Retail Colocation | |
| Wholesale Colocation | ||
By End User
| BFSI |
| IT and ITES |
| E-Commerce |
| Government |
| Manufacturing |
| Media and Entertainment |
| Telecom |
| Other End Users |
By Hotspot
| Bengaluru |
| Chennai |
| Hyderabad |
| Mumbai |
| Delhi-NCR |
| Rest of India |
| By Data Center Size | Small | ||
| Medium | |||
| Large | |||
| Hyperscale | |||
| By Tier Type | Tier 1 and 2 | ||
| Tier 3 | |||
| Tier 4 | |||
| By Data Center Type | Hyperscale / Self-Built | ||
| Enterprise / Edge | |||
| Colocation | Non-Utilized | ||
| Utilized | Retail Colocation | ||
| Wholesale Colocation | |||
| By End User | BFSI | ||
| IT and ITES | |||
| E-Commerce | |||
| Government | |||
| Manufacturing | |||
| Media and Entertainment | |||
| Telecom | |||
| Other End Users | |||
| By Hotspot | Bengaluru | ||
| Chennai | |||
| Hyderabad | |||
| Mumbai | |||
| Delhi-NCR | |||
| Rest of India | |||


Market Definition
- IT LOAD CAPACITY - The IT load capacity or installed capacity, refers to the amount of energy consumed by servers and network equipments placed in a rack installed. It is measured in megawatt (MW).
- ABSORPTION RATE - It denotes the extend to which the data center capacity has been leased out. For instance, a 100 MW DC has leased out 75 MW, then absorption rate would be 75%. It is also referred as utilization rate and leased-out capacity.
- RAISED FLOOR SPACE - It is an elevated space build over the floor. This gap between the original floor and the elevated floor is used to accommodate wiring, cooling, and other data center equipment. This arrangement assist in having proper wiring and cooling infrastructure. It is measured in square feet (ft^2).
- DATA CENTER SIZE - Data Center Size is segmented based on the raised floor space allocated to the data center facilities. Mega DC - # of Racks must be more than 9000 or RFS (raised floor space) must be more than 225001 Sq. ft; Massive DC - # of Racks must be in between 9000 and 3001 or RFS must be in between 225000 Sq. ft and 75001 Sq. ft; Large DC - # of Racks must be in between 3000 and 801 or RFS must be in between 75000 Sq. ft and 20001 Sq. ft; Medium DC # of Racks must be in between 800 and 201 or RFS must be in between 20000 Sq. ft and 5001 Sq. ft; Small DC - # of Racks must be less than 200 or RFS must be less than 5000 Sq. ft.
- TIER TYPE - According to Uptime Institute the data centers are classified into four tiers based on the proficiencies of redundant equipment of the data center infrastructure. In this segment the data center are segmented as Tier 1,Tier 2, Tier 3 and Tier 4.
- COLOCATION TYPE - The segment is segregated into 3 categories namely Retail, Wholesale and Hyperscale Colocation service. The categorization is done based on the amount of IT load leased out to potential customers. Retail colocation service has leased capacity less than 250 kW; Wholesale colocation services has leased capacity between 251 kW and 4 MW and Hyperscale colocation services has leased capacity more than 4 MW.
- END CONSUMERS - The Data Center Market operates on a B2B basis. BFSI, Government, Cloud Operators, Media and Entertainment, E-Commerce, Telecom and Manufacturing are the major end-consumers in the market studied. The scope only includes colocation service operators catering to the increasing digitalization of the end-user industries.
| Keyword | Definition |
|---|---|
| Rack Unit | Generally referred as U or RU, it is the unit of measurement for the server unit housed in the racks in the data center. 1U is equal to 1.75 inches. |
| Rack Density | It defines the amount of power consumed by the equipment and server housed in a rack. It is measured in kilowatt (kW). This factor plays a critical role in data center design and, cooling and power planning. |
| IT Load Capacity | The IT load capacity or installed capacity, refers to the amount of energy consumed by servers and network equipment placed in a rack installed. It is measured in megawatt (MW). |
| Absorption Rate | It denotes how much of the data center capacity has been leased out. For instance, if a 100 MW DC has leased out 75 MW, then the absorption rate would be 75%. It is also referred to as utilization rate and leased-out capacity. |
| Raised Floor Space | It is an elevated space built over the floor. This gap between the original floor and the elevated floor is used to accommodate wiring, cooling, and other data center equipment. This arrangement assists in having proper wiring and cooling infrastructure. It is measured in square feet/meter. |
| Computer Room Air Conditioner (CRAC) | It is a device used to monitor and maintain the temperature, air circulation, and humidity inside the server room in the data center. |
| Aisle | It is the open space between the rows of racks. This open space is critical for maintaining the optimal temperature (20-25 °C) in the server room. There are primarily two aisles inside the server room, a hot aisle and a cold aisle. |
| Cold Aisle | It is the aisle wherein the front of the rack faces the aisle. Here, chilled air is directed into the aisle so that it can enter the front of the racks and maintain the temperature. |
| Hot Aisle | It is the aisle where the back of the racks faces the aisle. Here, the heat dissipated from the equipment’s in the rack is directed to the outlet vent of the CRAC. |
| Critical Load | It includes the servers and other computer equipment whose uptime is critical for data center operation. |
| Power Usage Effectiveness (PUE) | It is a metric which defines the efficiency of a data center. It is calculated by: (𝑇𝑜𝑡𝑎𝑙 𝐷𝑎𝑡𝑎 𝐶𝑒𝑛𝑡𝑒𝑟 𝐸𝑛𝑒𝑟𝑔𝑦 𝐶𝑜𝑛𝑠𝑢𝑚𝑝𝑡𝑖𝑜𝑛)/(𝑇𝑜𝑡𝑎𝑙 𝐼𝑇 𝐸𝑞𝑢𝑖𝑝𝑚𝑒𝑛𝑡 𝐸𝑛𝑒𝑟𝑔𝑦 𝐶𝑜𝑛𝑠𝑢𝑚𝑝𝑡𝑖𝑜𝑛). Further, a data center with a PUE of 1.2-1.5 is considered highly efficient, whereas, a data center with a PUE >2 is considered highly inefficient. |
| Redundancy | It is defined as a system design wherein additional component (UPS, generators, CRAC) is added so that in case of power outage, equipment failure, the IT equipment should not be affected. |
| Uninterruptible Power Supply (UPS) | It is a device that is connected in series with the utility power supply, storing energy in batteries such that the supply from UPS is continuous to IT equipment even during utility power is snapped. The UPS primarily supports the IT equipment only. |
| Generators | Just like UPS, generators are placed in the data center to ensure an uninterrupted power supply, avoiding downtime. Data center facilities have diesel generators and commonly, 48-hour diesel is stored in the facility to prevent disruption. |
| N | It denotes the tools and equipment required for a data center to function at full load. Only "N" indicates that there is no backup to the equipment in the event of any failure. |
| N+1 | Referred to as 'Need plus one', it denotes the additional equipment setup available to avoid downtime in case of failure. A data center is considered N+1 when there is one additional unit for every 4 components. For instance, if a data center has 4 UPS systems, then for to achieve N+1, an additional UPS system would be required. |
| 2N | It refers to fully redundant design wherein two independent power distribution system is deployed. Therefore, in the event of a complete failure of one distribution system, the other system will still supply power to the data center. |
| In-Row Cooling | It is the cooling design system installed between racks in a row where it draws warm air from the hot aisle and supplies cool air to the cold aisle, thereby maintaining the temperature. |
| Tier 1 | Tier classification determines the preparedness of a data center facility to sustain data center operation. A data center is classified as Tier 1 data center when it has a non-redundant (N) power component (UPS, generators), cooling components, and power distribution system (from utility power grids). The Tier 1 data center has an uptime of 99.67% and an annual downtime of <28.8 hours. |
| Tier 2 | A data center is classified as Tier 2 data center when it has a redundant power and cooling components (N+1) and a single non-redundant distribution system. Redundant components include extra generators, UPS, chillers, heat rejection equipment, and fuel tanks. The Tier 2 data center has an uptime of 99.74% and an annual downtime of <22 hours. |
| Tier 3 | A data center having redundant power and cooling components and multiple power distribution systems is referred to as a Tier 3 data center. The facility is resistant to planned (facility maintenance) and unplanned (power outage, cooling failure) disruption. The Tier 3 data center has an uptime of 99.98% and an annual downtime of <1.6 hours. |
| Tier 4 | It is the most tolerant type of data center. A Tier 4 data center has multiple, independent redundant power and cooling components and multiple power distribution paths. All IT equipment are dual powered, making them fault tolerant in case of any disruption, thereby ensuring interrupted operation. The Tier 4 data center has an uptime of 99.74% and an annual downtime of <26.3 minutes. |
| Small Data Center | Data center that has floor space area of ≤ 5,000 Sq. ft or the number of racks that can be installed is ≤ 200 is classified as a small data center. |
| Medium Data Center | Data center which has floor space area between 5,001-20,000 Sq. ft, or the number of racks that can be installed is between 201-800, is classified as a medium data center. |
| Large Data Center | Data center which has floor space area between 20,001-75,000 Sq. ft, or the number of racks that can be installed is between 801-3,000, is classified as a large data center. |
| Massive Data Center | Data center which has floor space area between 75,001-225,000 Sq. ft, or the number of racks that can be installed is between 3001-9,000, is classified as a massive data center. |
| Mega Data Center | Data center that has a floor space area of ≥ 225,001 Sq. ft or the number of racks that can be installed is ≥ 9001 is classified as a mega data center. |
| Retail Colocation | It refers to those customers who have a capacity requirement of 250 kW or less. These services are majorly opted by small and medium enterprises (SMEs). |
| Wholesale Colocation | It refers to those customers who have a capacity requirement between 250 kW to 4 MW. These services are majorly opted by medium to large enterprises. |
| Hyperscale Colocation | It refers to those customers who have a capacity requirement greater than 4 MW. The hyperscale demand primarily originates from large-scale cloud players, IT companies, BFSI, and OTT players (like Netflix, Hulu, and HBO+). |
| Mobile Data Speed | It is the mobile internet speed a user experiences via their smartphones. This speed is primarily dependent on the carrier technology being used in the smartphone. The carrier technologies available in the market are 2G, 3G, 4G, and 5G, where 2G provides the slowest speed while 5G is the fastest. |
| Fiber Connectivity Network | It is a network of optical fiber cables deployed across the country, connecting rural and urban regions with high-speed internet connection. It is measured in kilometer (km). |
| Data Traffic per Smartphone | It is a measure of average data consumption by a smartphone user in a month. It is measured in gigabyte (GB). |
| Broadband Data Speed | It is the internet speed that is supplied over the fixed cable connection. Commonly, copper cable and optic fiber cable are used in both residential and commercial use. Here, optic cable fiber provides faster internet speed than copper cable. |
| Submarine Cable | A submarine cable is a fiber optic cable laid down at two or more landing points. Through this cable, communication and internet connectivity between countries across the globe is established. These cables can transmit 100-200 terabits per second (Tbps) from one point to another. |
| Carbon Footprint | It is the measure of carbon dioxide generated during the regular operation of a data center. Since, coal, and oil & gas are the primary source of power generation, consumption of this power contributes to carbon emissions. Data center operators are incorporating renewable energy sources to curb the carbon footprint emerging in their facilities. |


Research Methodology
Mordor Intelligence follows a four-step methodology in all our reports.
- Step-1: Identify Key Variables: In order to build a robust forecasting methodology, the variables and factors identified in Step-1 are tested against available historical market numbers. Through an iterative process, the variables required for market forecast are set and the model is built on the basis of these variables.
- Step-2: Build a Market Model: Market-size estimations for the forecast years are in nominal terms. Inflation is not a part of the pricing, and the average selling price (ASP) is kept constant throughout the forecast period for each country.
- Step-3: Validate and Finalize: In this important step, all market numbers, variables and analyst calls are validated through an extensive network of primary research experts from the market studied. The respondents are selected across levels and functions to generate a holistic picture of the market studied.
- Step-4: Research Outputs: Syndicated Reports, Custom Consulting Assignments, Databases & Subscription Platforms


