
Hydrogen Hubs Market Size and Share
Market Overview
| Study Period | 2022 - 2032 |
|---|---|
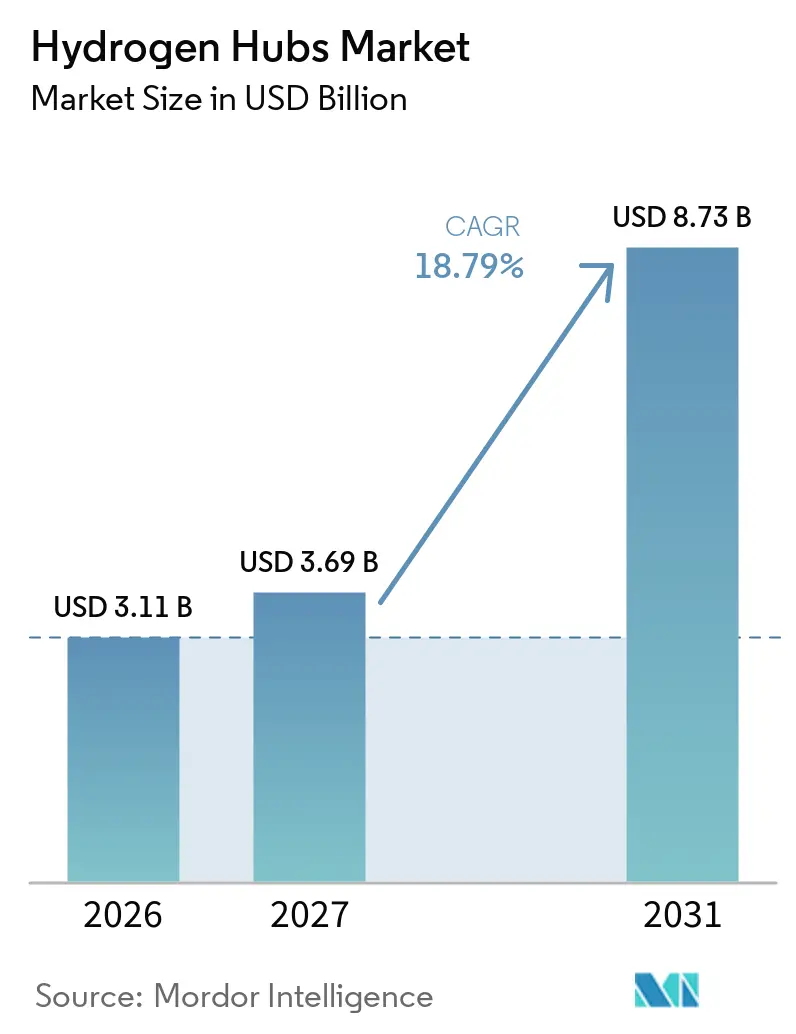
| Market Size (2027) | USD 3.69 Billion |
| Market Size (2031) | USD 8.73 Billion |
| Growth Rate (2027 - 2032) | 18.79 % |
| Fastest Growing Market | Asia-Pacific |
| Largest Market | Asia-Pacific |
| Market Concentration | Low |
Major Players *Disclaimer: Major Players sorted in no particular order Image © Mordor Intelligence. Reuse requires attribution under CC BY 4.0. | |
Hydrogen Hubs Market Analysis by Mordor Intelligence
The Hydrogen Hubs Market size is projected to be USD 3.11 billion in 2026, USD 3.69 billion in 2027, and reach USD 8.73 billion by 2031, growing at a CAGR of 18.79% from 2027 to 2031. The global hydrogen hubs market is moving from policy design to project delivery as public funding, tax incentives, and procurement programs supporting large facilities. Industrial users provide the most credible early demand because refineries, ammonia plants, and steel producers already use hydrogen in established processes. Project economics still depend on lower equipment costs, dependable renewable power, and contracts that allow developers to secure financing. Port locations are gaining importance because they can reuse connections, storage, and marine facilities that would take years to build elsewhere. Competition is separating into integrated energy companies with customer access and infrastructure assets, and equipment providers focused on electrolyzer performance and delivery capability.
Key Report Takeaways
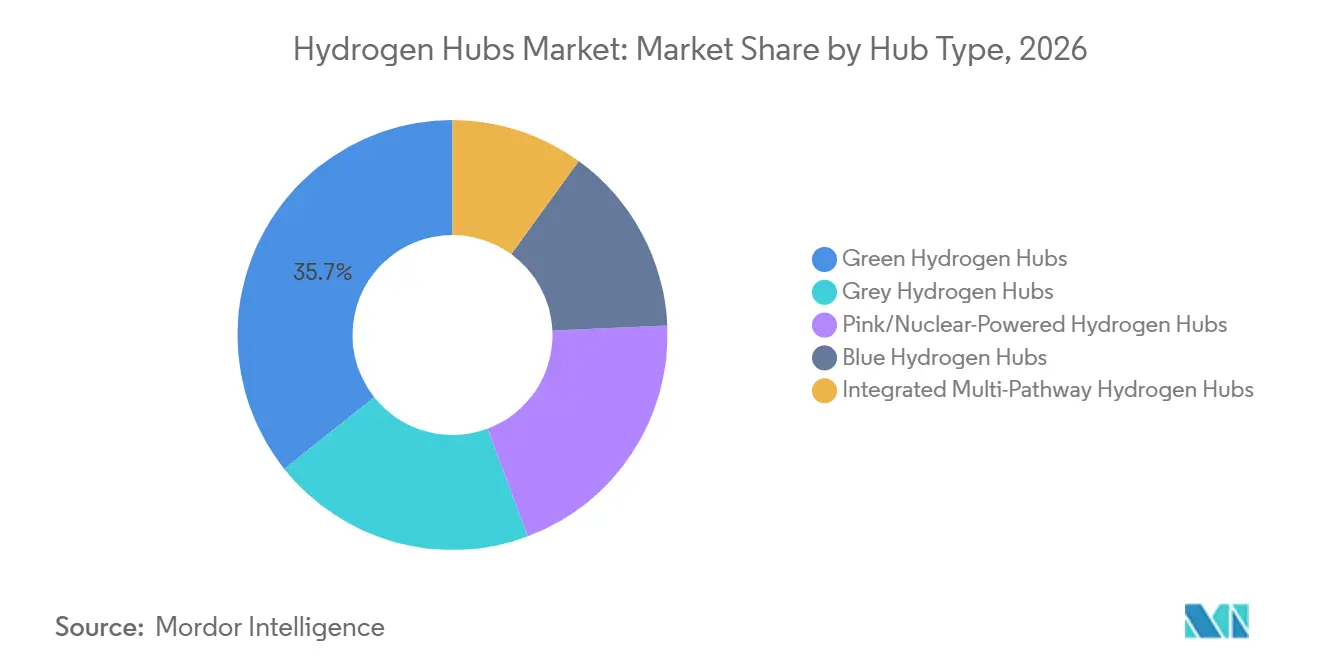
- By hub type, green hydrogen hubs held 35.7% of the global hydrogen hubs market share in 2026, and are forecast to grow at a 19.1% CAGR through 2032.
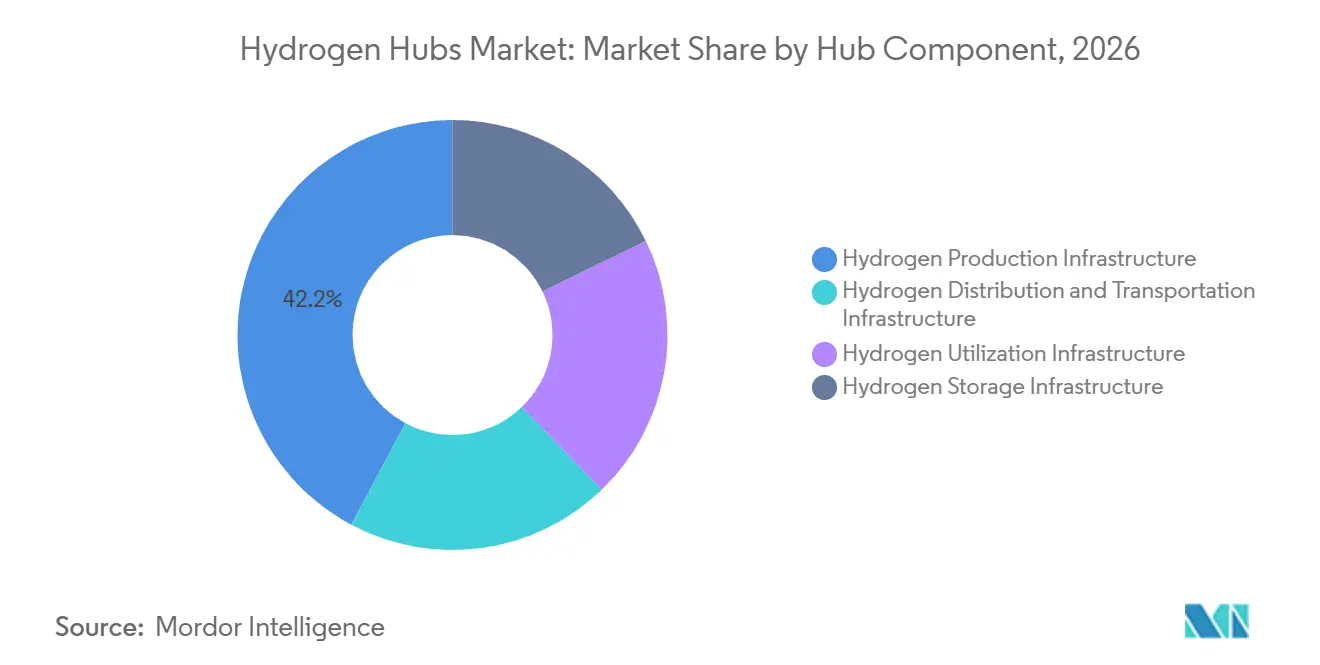
- By hub component, hydrogen production infrastructure held 42.2% of the global hydrogen hubs market share in 2026, while distribution and transportation infrastructure is forecast to grow at a 19.3% CAGR through 2032.
- By application and end-use industry, industrial and chemical applications accounted for 56.3% of the global hydrogen hubs market size in 2026, while transportation and mobility are forecast to expand at a 19.6% CAGR through 2032.
- By geography, Asia-Pacific held 32.4% of the global market value in 2026 and is forecast to grow at a 19.2% CAGR through 2032.
Note: Market numbers in this report are based on Mordor Intelligence's proprietary estimation framework, which combines nine months of actuals with Q4 projections for base year 2026.
Market Trends and Insights
Drivers Impact Analysis of Hydrogen Hubs Market*
| Driver | (~) % Impact on CAGR Forecast | Geographic Relevance | Impact Timeline |
|---|---|---|---|
| Government Funding and Demand-Creation Mechanisms | +3.5% | Global, concentrated in North America, EU, East Asia | Short term (≤ 2 years) |
| Industrial Decarbonization and Existing Hydrogen Demand Anchors | +4.2% | Global, led by China, Germany, Japan, South Korea | Medium term (2-4 years) |
| Falling Electrolyzer Costs and Modular Hub Design | +3.1% | Global, with highest near-term impact in China and EU | Medium term (2-4 years) |
| Export-Oriented Hydrogen and Hydrogen-Derivative Corridors | +2.8% | Middle East, Australia, South America to EU and East Asia | Long term (≥ 4 years) |
| Port-Cluster Repurposing for Hydrogen Logistics | +2.3% | North Sea, Gulf Coast US, Red Sea | Medium term (2-4 years) |
| Binding Offtake Aggregation Through Multi-Party Hub Contracts | +2.1% | EU, North America | Medium term (2-4 years) |
| Source: Mordor Intelligence | |||
Government Funding and Demand-Creation Mechanisms
Government support is giving the global hydrogen hubs market a clearer route from development to construction. Final US rules for the 45V Clean Hydrogen Production Tax Credit took effect on January 10, 2025, with qualifying producers eligible for up to USD 3 per kilogram.[1] The US Department of Energy completed its seven-hub network in January 2025 by awarding up to USD 925 million to Heartland and up to USD 750 million to MACH2.[2] China’s Energy Law took effect in January 2025 and classified hydrogen as an energy resource, reducing a regulatory barrier for larger projects.[3] The European Commission also continued auction support for renewable and low-carbon hydrogen through the European Hydrogen Bank.[4] These measures improve revenue visibility, although projects still need firm offtake commitments before investment decisions can proceed.
Industrial Decarbonization and Existing Hydrogen Demand Anchors
Existing industrial demand gives the global hydrogen hubs market an early customer base that does not depend on new end uses. Refineries, ammonia producers, and steel facilities already consume hydrogen, mostly produced from fossil fuels. RWE and TotalEnergies signed a 15-year agreement in March 2025 for TotalEnergies to buy 30,000 metric tons of green hydrogen each year from the 300 MW GET H2 Nukleus plant from 2030. The supply will serve TotalEnergies’ Leuna refinery, where it is expected to reduce annual CO2 emissions by 300,000 tons. Sites located near established industrial users face lower demand risk than remote production facilities. This advantage can direct capital toward hubs that combine production, storage, and local industrial consumption.
Falling Electrolyzer Costs and Modular Hub Design
Electrolyzer cost and delivery performance remain central to the global hydrogen hubs market because production equipment is a major capital expense. The International Energy Agency reported that electrolyzer manufacturing costs in China ranged from USD 600 to USD 1,200 per kilowatt, compared with USD 2,000 to USD 2,600 per kilowatt outside China. Installation, engineering, procurement, and construction costs can reduce this difference when projects are built outside China. Accelera by Cummins delivered a 35 MW Proton Exchange Membrane (PEM) electrolyzer to Linde’s Niagara Falls facility in September 2025. Standardized modular systems can lower delivery risk and make capacity additions easier to stage as demand develops. ITM Power’s GBP 145.1 million order backlog in April 2025 also indicated that projects were moving from design work into equipment orders.
Export-Oriented Hydrogen and Hydrogen-Derivative Corridors
Export corridors extend the global hydrogen hubs market beyond locations with large local demand. Many long-distance projects plan to convert hydrogen into ammonia for transport and then process it at the destination. ACWA Power and EnBW signed a joint development agreement in August 2025 for the first phase of the Yanbu Green Hydrogen Hub in Saudi Arabia. The proposal includes 4 GW of electrolysis, 400,000 tons of annual green hydrogen output, and a dedicated export terminal. Japan’s 2025 hydrogen ministerial meeting focused on demand creation and international supply chain cooperation. Export projects therefore depend on aligned standards, shipping infrastructure, and buyers that can accept low-carbon molecules at a price above conventional fuel.
Restraints Impact Analysis of Hydrogen Hubs Market*
| Restraint | (~) % Impact on CAGR Forecast | Geographic Relevance | Impact Timeline |
|---|---|---|---|
| Limited Final Investment Decision Conversion | -2.8% | Global, most acute in EU and North America | Short term (≤ 2 years) |
| Certification and Carbon-Intensity Rule Divergence | -1.9% | Global, especially cross-border trade routes | Medium term (2-4 years) |
| Hydrogen Purity, Metering and Interoperability Gaps Across Shared Infrastructure | -1.2% | EU industrial corridors, North America hub clusters | Medium term (2-4 years) |
| Water Availability and Community Acceptance at Large Renewable Hydrogen Sites | -0.9% | APAC, Middle East, inland EU sites | Long term (≥ 4 years) |
| Source: Mordor Intelligence | |||
Limited Final Investment Decision Conversion
Limited conversion from project announcements to final investment decisions is holding back the global hydrogen hubs market. The IEA reported that production costs, delayed offtake agreements, and policy uncertainty have slowed project delivery. Air Products announced in February 2025 that it would exit three US projects as part of its portfolio review. BP’s February 2025 strategy reset narrowed its investment focus to five to seven hydrogen and carbon capture projects. These decisions make lenders and equity partners more cautious about projects without signed customers or clear policy support. Longer approval and financing cycles can favor developers with established industrial assets and stronger balance sheets.
Certification and Carbon-Intensity Rule Divergence
Different certification rules create an added cost for hydrogen trade between regions. The European Union adopted its low-carbon hydrogen greenhouse gas methodology on July 8, 2025, requiring 70% emissions saving compared with unabated fossil fuels. India issued its Green Hydrogen Certification Scheme in May 2025, including a threshold of 2 kgCO2-equivalent per kilogram for specified electrolysis and biomass pathways. Separate rules on lifecycle boundaries, electricity sourcing, and additionality can prevent direct recognition across trade routes. Exporters may need more than 1 certification or may design production for the strictest customer requirement. Hydrogen purity, metering, shared-infrastructure compatibility, water availability, and local acceptance add further operational requirements for large projects. The global hydrogen hubs market will need common technical practices to reduce these barriers as cross-border volumes rise.
*Our forecasts treat driver/restraint impacts as directional, not additive. The impact forecasts reflect baseline growth, mix effects, and variable interactions.
Hydrogen Hubs Market Segment Analysis
By Hub Type:
Green Hydrogen Hubs Define the Investment FrontierGreen hydrogen hubs are forecast to grow at a 19.1% CAGR through 2032, making them the fastest-growing hub type in the global hydrogen hubs market. Their expansion is linked to renewable electricity supply, wider electrolyzer deployment, and policies that favor low-emission production. ACWA Power and L&T’s (Larsen & Toubro’s) Yanbu proposal illustrates the scale of current project plans, with 4 GW of electrolysis and planned annual output of 400,000 tons. These projects are more viable where developers can secure renewable generation, port access, and long-term demand. Their commercial progress still depends on power costs and the availability of contracts that support financing.
Blue hydrogen hubs use natural gas reforming with carbon capture and can use existing gas-processing systems. Saudi Aramco completed its acquisition of a 50% interest in Blue Hydrogen Industrial Gases Company in Jubail in March 2025. This model can reach scale sooner in the global hydrogen hubs market where gas supply and carbon management infrastructure are available. Grey hydrogen hubs remain part of China’s industrial base but face increasing pressure from decarbonization policy. Pink or nuclear-powered hubs remain limited by reactor availability and licensing timelines, while integrated multi-pathway hubs can manage supply risk where renewable output is variable.

By Hub Component:
Production Infrastructure Dominates, but Logistics Is the Fastest-Scaling LayerHydrogen production infrastructure held 42.2% of the global hydrogen hubs market size in 2026, reflecting the capital required for electrolyzers and related systems. The International Energy Agency (IEA) identifies electrolyzer equipment as a major cost item in low-emission hydrogen projects. Production capacity needs reliable renewable electricity, water management, grid connections, and equipment service capability. Suppliers are therefore competing on efficiency, manufacturing scale, delivery reliability, and local support. Early hubs are concentrating capital in production because downstream equipment cannot operate without dependable supply.
Distribution and transportation infrastructure is forecast to expand at a 19.3% CAGR through 2032 as the global hydrogen hubs market requires pipelines, truck loading facilities, and marine terminals. Germany’s 9,000-kilometer hydrogen core network is planned to use pipeline conversion and new construction through 2032. RWE began marketing capacity at its Gronau-Epe hydrogen storage facility in June 2025, supporting the network’s balancing needs. Storage has a larger role where renewable generation varies by time of day and season. Utilization infrastructure includes fuel cells, turbines, and industrial process equipment that convert delivered hydrogen into end-use value. The hydrogen hubs industry is therefore moving toward designs that include more than production equipment alone.
By Application and End-Use Industry:
Industrial Chemistry Anchors Value, Mobility Accelerates VolumeIndustrial and chemical applications accounted for 56.3% of the global hydrogen hubs market size in 2026. Refineries, ammonia facilities, and methanol plants provide large and predictable demand that can be covered by long-term supply agreements. Sinopec reported more than 150 hydrogen refueling stations and 11 hydrogen production bases by October 2025 while continuing development of a 30,000-ton-per-year renewable hydrogen project in Inner Mongolia. This approach links production assets with industrial customers and distribution infrastructure. Industrial customers can help the global hydrogen hubs market establish demand before new mobility applications reach full scale.
Transportation and mobility are forecast to grow at a 19.6% CAGR through 2032. Heavy trucks, shipping, and other applications with high energy needs can support demand where battery systems face range or payload constraints. China’s policy direction includes fuel cell vehicles and refueling infrastructure within industrial corridors. Power generation and grid services can use hydrogen as a balancing resource in systems with high renewable capacity. Mitsubishi Heavy Industries demonstrated a 500 kW engine generator operating on 100% hydrogen in March 2025. Buildings, heating, defense, and aerospace account for a smaller current share but extend the demand base into sectors that are harder to electrify.
Geography Analysis
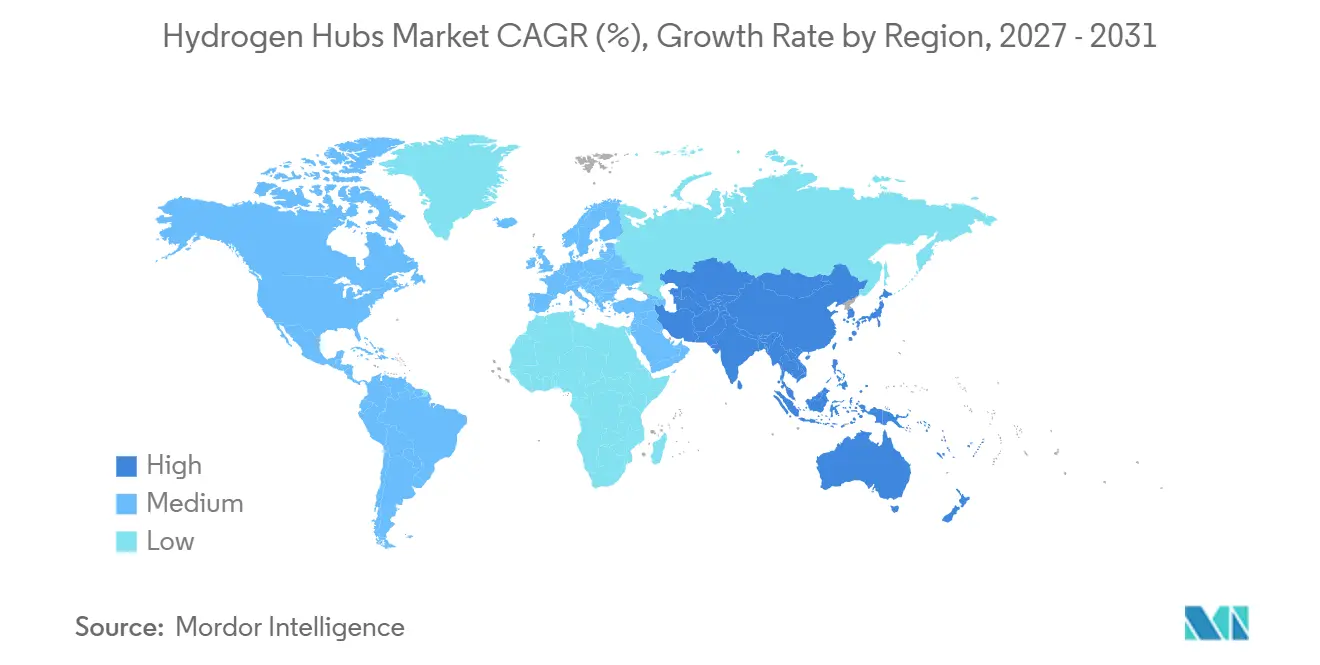
Asia-Pacific held 32.4% of the global hydrogen hubs market share in 2026 and is forecast to grow at a 19.2% CAGR through 2032. China’s National Energy Administration reported hydrogen production of more than 36.5 million metric tons in 2024 and stated that China accounted for more than 50% of global renewable hydrogen project capacity. China also gives the global hydrogen hubs market a large industrial base and significant electrolyzer manufacturing capacity. Japan’s 2025 energy plan identifies hydrogen as a pathway for industry and power.
Europe is using coordinated policy, certification rules, and pipeline investment to support the global hydrogen hubs market. The EU’s July 2025 methodology provides a basis for classifying low-carbon hydrogen across member states. Germany’s hydrogen core network and storage plans create a route from coastal import points and domestic producers to industrial customers. RWE’s Lingen facility is expected to connect to that network and has a long-term supply agreement with TotalEnergies. Spain is developing hub projects including Iberdrola’s 200 MW Huelva cluster and the BP-Iberdrola Castellón facility.
North America is progressing in the global hydrogen hubs market through the US regional hub program, tax incentives, and private development. Department of Energy (DOE) funding for Heartland and MACH2 completed the national seven-hub network in January 2025. The Middle East and Africa are emerging as export supply areas through Saudi projects and carbon management infrastructure at Jubail. South America remains at an earlier stage of project development, dependent on export terminals, certification alignment, and demand from overseas buyers.
Competitive Landscape
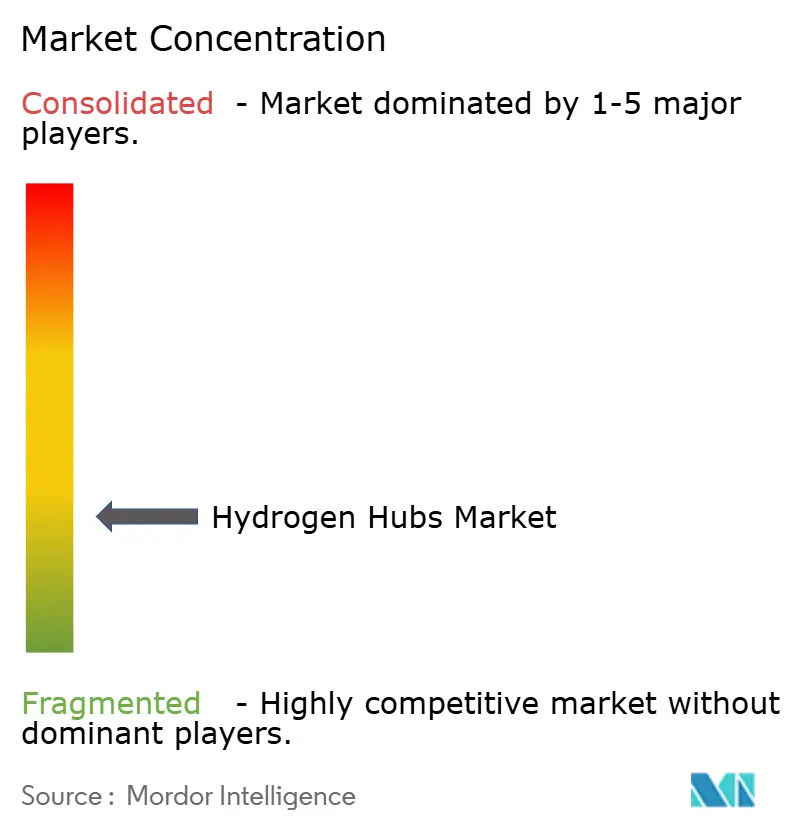
The global hydrogen hubs market is fragmented because companies compete at different points in the value chain. Shell, TotalEnergies, BP, ENGIE, RWE, ACWA Power, Chevron, and Saudi Aramco compete on project development, customer access, and existing energy infrastructure. Equipment suppliers including ITM Power, Nel, Siemens Energy, and Accelera by Cummins compete on performance, service coverage, manufacturing capability, and delivery reliability. Integrated companies can use refinery relationships, gas assets, and balance sheets to support long project timelines.
Strategic moves in the global hydrogen hubs market show a growing preference for shared development models and firm customer commitments. Air Liquide took the final investment decision in July 2025 for the 200 MW ELYgator electrolyzer in Rotterdam, with annual renewable hydrogen output planned at 23,000 tons from 2027. Siemens Energy delivered the first 9 of 12 PEM electrolyzers for Air Liquide’s 200 MW Normand’Hy project in September 2025. ITM Power established Hydropulse GmbH in June 2025 to build, own, and operate decentralized hydrogen plants for industrial customers.
The global hydrogen hubs market rewards companies that connect production with storage, transport, and end use. Multi-party offtake arrangements can reduce reliance on a single anchor customer. The RWE and TotalEnergies agreement shows how a long-term industrial contract can support a production project. Standards for purity, metering, and interoperability remain a source of differentiation for suppliers serving shared infrastructure. Chinese manufacturing scale shapes cost competition, while overseas projects assess compliance, service capability, and total installed cost.
Hydrogen Hubs Industry Leaders
-
Air Products and Chemicals, Inc.
-
Linde plc
-
Air Liquide S.A.
-
Plug Power Inc.
-
Nel ASA
- *Disclaimer: Major Players sorted in no particular order
Hydrogen Hubs Market Companies Covered in this Report
- ACWA Power Company
- Air Liquide S.A.
- Air Products and Chemicals, Inc.
- BP p.l.c.
- Chevron Corporation
- China Petroleum & Chemical Corporation (Sinopec)
- Cummins Inc.
- ENGIE SA
- Fortescue Ltd.
- Iberdrola, S.A.
- ITM Power plc
- Linde plc
- Mitsubishi Heavy Industries, Ltd.
- Nel ASA
- Plug Power Inc.
- RWE AG
- Saudi Arabian Oil Company (Saudi Aramco)
- Shell plc
- Siemens Energy AG
- TotalEnergies SE
Recent Industry Developments in Hydrogen Hubs Market
- September 2026: The Solar Energy Corporation of India (SECI) issued a request for proposals to select executing agencies for preparing detailed project reports for green hydrogen hubs under Component-B1 of India's National Green Hydrogen Mission.
- July 2026: Orica announced its final investment decision for the Hunter Valley Hydrogen Hub in New South Wales. The project will install a 50 MW electrolyzer to produce approximately 4,700 tonnes of renewable hydrogen annually, replacing around 7.5% of the natural gas feedstock used at its Kooragang Island ammonia facility. Construction expenditure is estimated at USD 172.7–199.5 million (AUD 245–283 million), net of government capital funding, with first production targeted for early 2029.
- April 2026: A public announcement from U.S. Senator Dave McCormick's office stated that the U.S. Department of Energy would preserve nearly USD 5 billion in funding for five hydrogen hubs, including the Mid-Atlantic Clean Hydrogen Hub (MACH2) and the Appalachian Regional Clean Hydrogen Hub (ARCH2).
- February 2026: India's Ministry of Ports, Shipping, and Waterways approved a dedicated jetty and associated facilities at Paradip Port for handling green hydrogen, ammonia, and other liquid cargo. The planned facility has a stated handling capacity of 4 million tonnes per annum and includes storage systems, pipelines, and cargo-handling equipment.
Global Hydrogen Hubs Market Report Scope
A hydrogen hub (also called a hydrogen valley, cluster, or ecosystem) is a localized or regional network that brings together clean hydrogen production, storage, distribution, and end-use demand in one location.
The hydrogen hubs market is segmented into hub type, hub component, application and end-use industry, and geography. By hub type, the market is segmented into green hydrogen hubs, blue hydrogen hubs, grey hydrogen hubs, pink/nuclear-powered hydrogen hubs, and integrated multi-pathway hydrogen hubs. By hub component, the market is segmented into hydrogen production infrastructure, hydrogen storage infrastructure, hydrogen distribution and transportation infrastructure, and hydrogen utilization infrastructure. By application and end-use industry, the market is divided into industrial and chemical applications, transportation and mobility, power generation and grid services, buildings and heating, and defense and aerospace. The report also covers the market size and forecasts for the global hydrogen hubs market across 26 countries in key regions. For each segment, the market sizing and forecasts have been provided on the basis of value (USD).
Segmentation Overview
| Green Hydrogen Hubs |
| Blue Hydrogen Hubs |
| Grey Hydrogen Hubs |
| Pink/Nuclear-Powered Hydrogen Hubs |
| Integrated Multi-Pathway Hydrogen Hubs |
| Hydrogen Production Infrastructure |
| Hydrogen Storage Infrastructure |
| Hydrogen Distribution and Transportation Infrastructure |
| Hydrogen Utilization Infrastructure |
| Industrial and Chemical Applications |
| Transportation and Mobility |
| Power Generation and Grid Services |
| Buildings and Heating |
| Defense and Aerospace |
| North America | United States |
| Canada | |
| Mexico | |
| Europe | Germany |
| France | |
| Italy | |
| Spain | |
| United Kingdom | |
| Poland | |
| Russia | |
| Rest of Europe | |
| Asia-Pacific | China |
| India | |
| Japan | |
| South Korea | |
| Australia | |
| Indonesia | |
| Vietnam | |
| Thailand | |
| Rest of Asia-Pacific | |
| South America | Brazil |
| Argentina | |
| Chile | |
| Rest of South America | |
| Middle East and Africa | Saudi Arabia |
| United Arab Emirates | |
| Egypt | |
| South Africa | |
| Morocco | |
| Rest of Middle East and Africa |
| By Hub Type | Green Hydrogen Hubs | |
| Blue Hydrogen Hubs | ||
| Grey Hydrogen Hubs | ||
| Pink/Nuclear-Powered Hydrogen Hubs | ||
| Integrated Multi-Pathway Hydrogen Hubs | ||
| By Hub Component | Hydrogen Production Infrastructure | |
| Hydrogen Storage Infrastructure | ||
| Hydrogen Distribution and Transportation Infrastructure | ||
| Hydrogen Utilization Infrastructure | ||
| By Application and End-Use Industry | Industrial and Chemical Applications | |
| Transportation and Mobility | ||
| Power Generation and Grid Services | ||
| Buildings and Heating | ||
| Defense and Aerospace | ||
| By Geography | North America | United States |
| Canada | ||
| Mexico | ||
| Europe | Germany | |
| France | ||
| Italy | ||
| Spain | ||
| United Kingdom | ||
| Poland | ||
| Russia | ||
| Rest of Europe | ||
| Asia-Pacific | China | |
| India | ||
| Japan | ||
| South Korea | ||
| Australia | ||
| Indonesia | ||
| Vietnam | ||
| Thailand | ||
| Rest of Asia-Pacific | ||
| South America | Brazil | |
| Argentina | ||
| Chile | ||
| Rest of South America | ||
| Middle East and Africa | Saudi Arabia | |
| United Arab Emirates | ||
| Egypt | ||
| South Africa | ||
| Morocco | ||
| Rest of Middle East and Africa | ||
Key Questions Answered in the Report
How large is the hydrogen hubs market in 2026?
The hydrogen hubs market size is USD 3.11 billion in 2026 and is forecast to reach USD 8.73 billion by 2032 at a 18.79% CAGR.
Which hub type is growing fastest?
Green hydrogen hubs are forecast to grow at a 19.1% CAGR through 2032.
Which application has the strongest growth outlook?
Transportation and mobility is forecast to expand at a 19.6% CAGR through 2032, supported by heavy-duty transport and maritime demand.
Why are industrial users important for hydrogen projects?
Refineries, ammonia producers, and steel facilities already use hydrogen, giving projects an established customer base for long-term contracts.
Which region leads hydrogen hub development?
Asia-Pacific held 32.4% of value in 2026 and is forecast to grow at a 19.2% CAGR through 2032.
What is the main barrier to new hydrogen hub projects?
Many announced projects have not reached final investment decision because costs, policy uncertainty, and offtake risks remain material.