Market Overview
| Study Period | 2019 - 2031 |
|---|---|
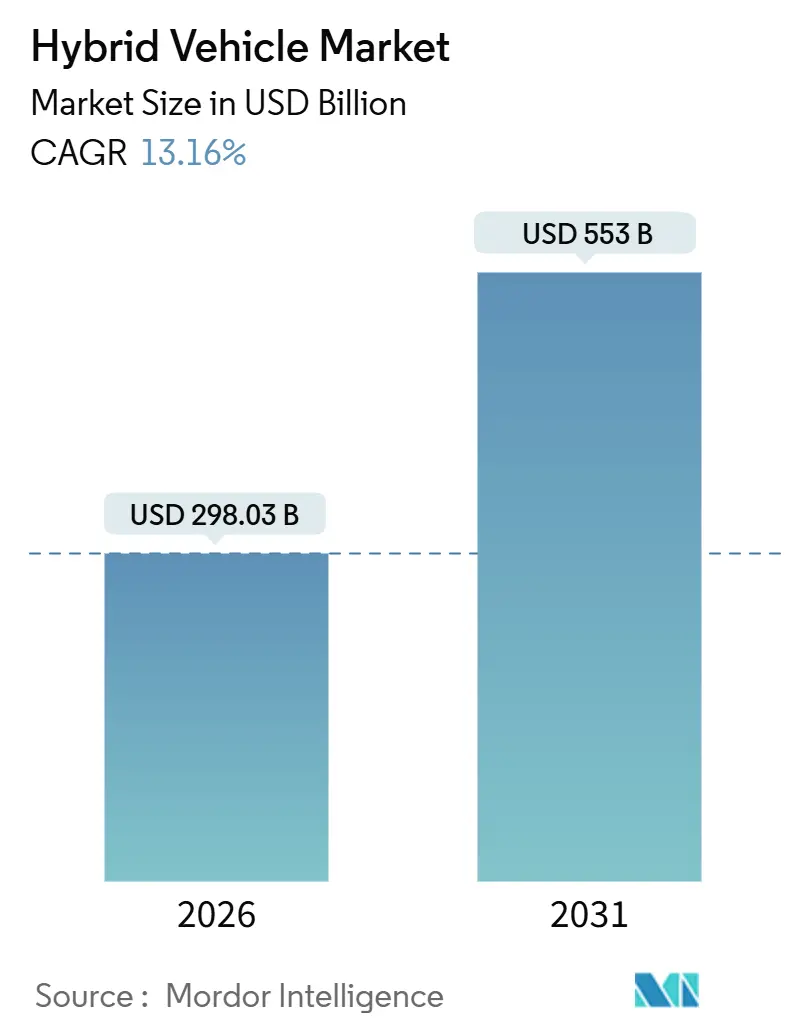
| Market Size (2026) | USD 298.03 Billion |
| Market Size (2031) | USD 553 Billion |
| Growth Rate (2026 - 2031) | 13.16% CAGR |
| Fastest Growing Market | Asia Pacific |
| Largest Market | Asia Pacific |
| Market Concentration | Medium |
Major Players*Disclaimer: Major Players sorted in no particular order Image © Mordor Intelligence. Reuse requires attribution under CC BY 4.0. | |
Hybrid Vehicle Market Analysis by Mordor Intelligence
The Hybrid Vehicle Market size is estimated at USD 298.03 billion in 2026, and is expected to reach USD 553 billion by 2031, at a CAGR of 13.16% during the forecast period (2026-2031). Tightening global greenhouse-gas rules, falling battery costs, and multipathway powertrain strategies are simultaneously expanding demand and protecting automakers against an uncertain pace of electrification. Plug-in hybrids are the fastest-growing configuration due to declines in battery pack costs and policy credits that reward electric-only range. In contrast, conventional hybrids maintain volume leadership because they impose the lightest burden on charging infrastructure. Permanent-magnet motors still dominate, but induction architectures are gaining as manufacturers reduce exposure to rare-earth supply risks. Lithium-iron-phosphate chemistry is now the battery of choice in most hybrids because it strikes a balance between cost, safety, and cycle life. Competition is intensifying as Japanese incumbents defend engineering leads against Chinese brands that leverage in-house battery production to undercut prices.
Key Report Takeaways
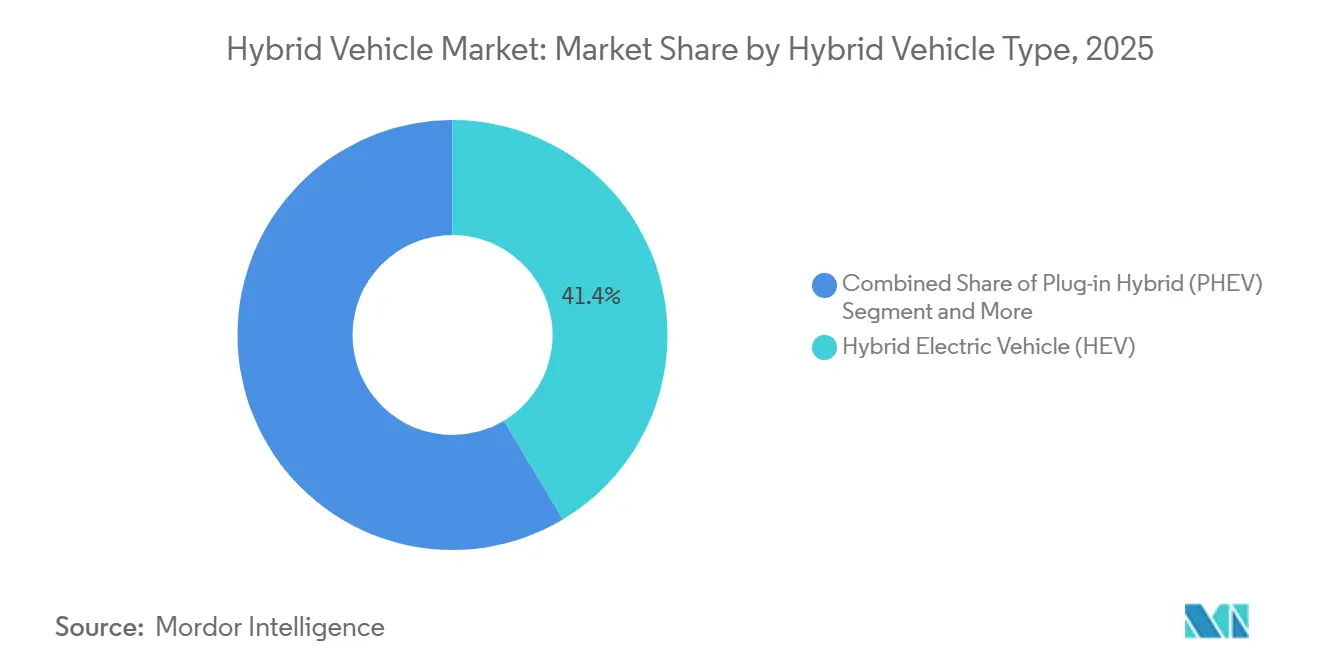
- By hybrid vehicle type, traditional hybrid electric vehicles secured 41.37% of the hybrid vehicle market share in 2025, whereas plug-in hybrids are projected to expand at a 13.17% CAGR through 2031.
- By vehicle type, passenger cars accounted for 77.31% of the hybrid vehicle market share in 2025; however, light commercial vehicles are projected to advance at a brisk 13.24% CAGR to 2031.
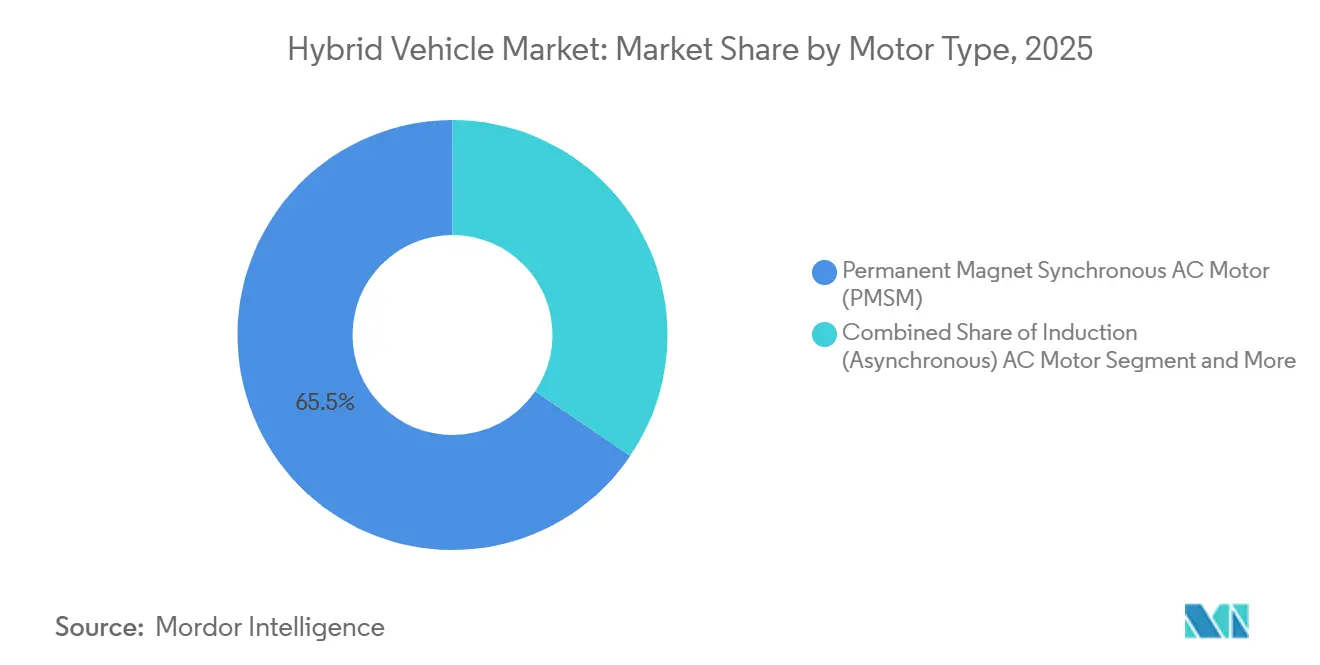
- By motor type, permanent-magnet synchronous units commanded 65.47% of the hybrid vehicle market share in 2025, while induction motors recorded the highest projected CAGR at 13.26% through 2031.
- By battery chemistry, lithium-iron-phosphate packs accounted for 47.17% of the hybrid vehicle market share in 2025 and are slated to grow at a 13.19% CAGR to 2031.
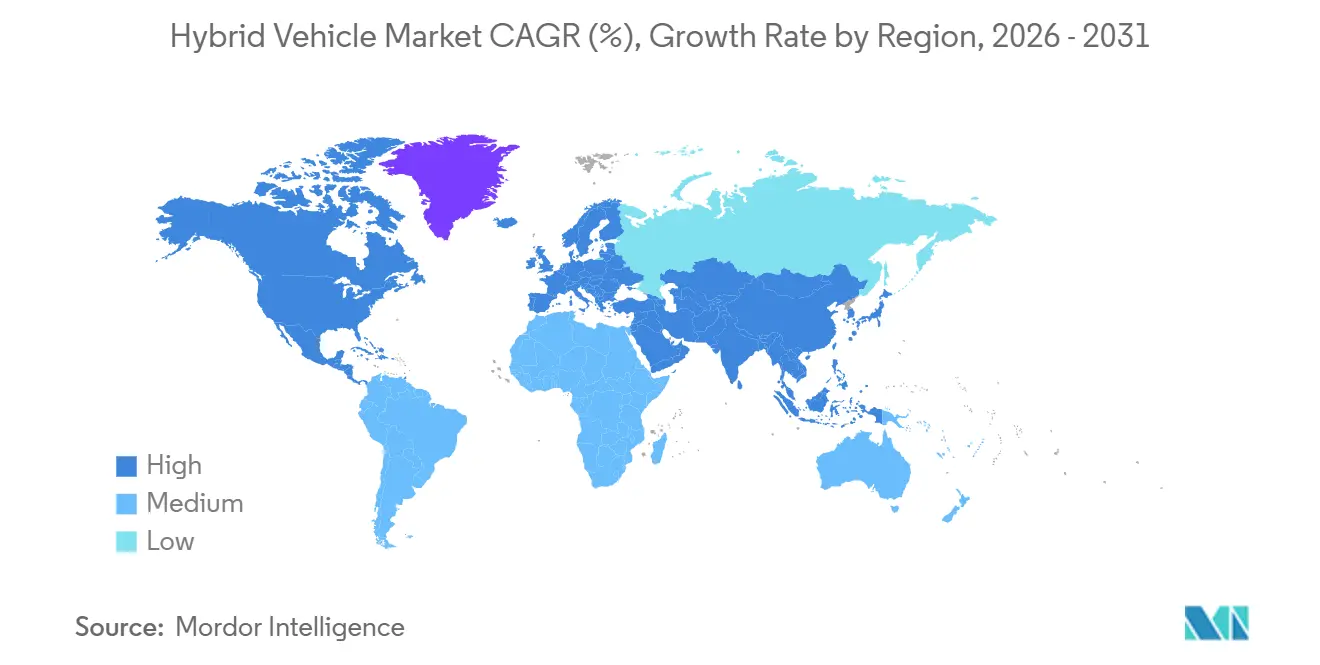
- By region, the Asia Pacific generated 38.73% of the hybrid vehicle market share in 2025 and led growth at a 13.21% CAGR during the forecast period.
Note: Market size and forecast figures in this report are generated using Mordor Intelligence’s proprietary estimation framework, updated with the latest available data and insights as of January 2026.
Global Hybrid Vehicle Market Trends and Insights
Drivers Impact Analysis
| Driver | (~) % Impact on CAGR Forecast | Geographic Relevance | Impact Timeline |
|---|---|---|---|
| Battery Cost-Parity Tipping Point | +2.4% | North America, Europe, Asia Pacific core markets | Medium term (2-4 years) |
| Stricter Global CAFE/GHG Norms | +2.1% | Global, with peak enforcement in EU, California, China | Medium term (2-4 years) |
| Soaring Fuel-Price Volatility Post-2024 | +1.8% | Global, acute in South America, Middle East, South Asia | Short term (≤ 2 years) |
| OEM Multi-Pathway Carbon Strategies | +1.6% | Global, led by Japan, Germany, South Korea | Long term (≥ 4 years) |
| 48-V Architecture Standardisation | +1.3% | North America, Europe | Medium term (2-4 years) |
| Grid-Independent Emergency-Power Use Case | +0.9% | Japan, California, Southeast Asia, Caribbean | Long term (≥ 4 years) |
| Source: Mordor Intelligence | |||
Battery Cost-Parity Tipping Point for PHEVs by 2027
By the mid-term future, automakers are steering towards significantly lower lithium-ion pack costs. Ford, in its recent earnings call, revealed a substantial year-on-year drop in the F-150 PowerBoost pack cost, attributing the decline to the United States-sourced lithium-hydroxide contracts [1]“Q3 2025 Results Transcript,” Ford Motor Co., ford.com . General Motors has set its sights on introducing plug-in crossovers with a competitive price premium, a strategic move that would negate the cost penalty seen in earlier years. Toyota, in its latest report, affirmed that the Prius Prime's battery cost per kilowatt-hour has fallen to a level that allows the company to maintain a healthy operating margin despite price reductions [2]“Annual Report FY 2025,” Toyota Motor Corp., toyota.co.jp . With rapid cell-to-pack integration, reduced cobalt content, and a surge in LFP usage, plug-in hybrids are on track to match the sticker prices of gasoline models in the upcoming cycle.
Stricter Global CAFE/GHG Norms & Zero-Emission Mandates
Regulatory tightening emerges as the primary driver behind the surge in hybrid adoption. The U.S. Environmental Protection Agency has set stringent light-duty standards for the near future, mandating significantly lower fleet emissions. This move pushes manufacturers to integrate electrified drivetrains or face hefty penalties. Meanwhile, Europe's upcoming regulations will enforce real-driving-emissions compliance under all ambient conditions. This has led to the adoption of mild-hybrids, even in compact cars. In China, the dual-credit scheme offers substantial incentives for each plug-in hybrid electric vehicle. This incentive enables OEMs to balance out their internal-combustion deficits [3]“New-Energy-Vehicle Credit Allocation 2025,” Ministry of Industry and Information Technology, miit.gov.cn . In California, the Advanced Clean Cars II initiative recognizes plug-in hybrids in zero-emission quotas, provided they meet a specific electric range requirement. This requirement is not only boosting battery sizes but also providing a buffer for compliance. Together, these regulatory measures are shaping the hybrid landscape, ensuring sustained demand through the end of the decade.
Soaring Fuel-Price Volatility Post-2024
In the first half of 2025, Brent crude prices experienced a notable increase compared to the previous year, leading to sustained high retail gasoline prices in deregulated markets. During this period, Brazil's pump prices rose significantly, further widening the total-cost-of-ownership gap between hybrids and traditional vehicles. As subsidy rollbacks continued, India's diesel prices saw a substantial year-on-year increase, driving commercial-vehicle fleets to shift towards hybrids, which offer promising double-digit fuel savings. In early 2025, Japan's Ministry of Economy, Trade, and Industry reported that hybrids had a considerable total cost-of-ownership advantage over gasoline cars when fuel prices exceeded a certain threshold. This fuel volatility underscores the demand in nations with limited charging networks.
OEM Multi-Pathway Carbon Strategies
Manufacturers are investing in internal-combustion, hybrid, and battery-electric lines, viewing it as a safeguard against potential infrastructure delays. In its recent sustainability report, Honda set ambitious targets for the near future, aiming for a balanced mix of sales from battery-electric vehicles, hybrid-electric vehicles, and fuel cells. This strategy ensures Honda's hybrid capacity remains intact, even if charging networks lag. Earlier announcements from Stellantis revealed plans to extend hybrid production well into the future, aiming to protect profit margins in regions that are slower to fully electrify. Hyundai, in its upcoming strategic plan, allocated a significant amount of investment for hybrid programs, matching its commitment to battery-electric vehicles. Volkswagen, too, is holding onto plug-in variants of key models for several more years, catering to grids that might have limited spare capacity. Such strategies underscore a commitment to maintaining robust hybrid volumes in the medium term.
Restraints Impact Analysis
| Restraint | (~) % Impact on CAGR Forecast | Geographic Relevance | Impact Timeline |
|---|---|---|---|
| BEV Total-Cost-Of-Ownership Parity Achieved | -1.9% | North America, Europe, China tier-1 cities | Short term (≤ 2 years) |
| Scarcity Of Sustainably Mined Nickel & Cobalt | -1.4% | Global, acute supply-chain impact in Europe, North America | Medium term (2-4 years) |
| Consumer Range-Anxiety Bias Shifting Straight To BEV | -0.8% | Urban markets with dense charging networks | Medium term (2-4 years) |
| Looming End-Of-Life Recycling Liabilities | -0.6% | Japan, North America (legacy hybrid markets) | Long term (≥ 4 years) |
| Source: Mordor Intelligence | |||
BEV Total-Cost-of-Ownership Parity Achieved in Urban Fleets
In cities with affordable electricity and depot charging, battery-electric vans are proving to be more cost-effective over the long term than their plug-in hybrid counterparts. In early 2025, Amazon announced plans to phase out its plug-in hybrid vans within a few years, citing that Rivian's battery-electric vehicles (BEVs) offer superior uptime and reduced maintenance costs. Similarly, UPS highlighted a significant reduction in cost per mile for its all-electric trucks operating in European city routes, underscoring a broader industry trend moving away from plug-in hybrids for fleets with set routes. London's Ultra Low Emission Zone has introduced daily fees for hybrids not operating in a zero-emission mode, diminishing their financial advantage over BEVs. With more cities likely to adopt similar measures, urban fleets might leap directly from diesel to fully electric vehicles, bypassing hybrids altogether.
Scarcity of Sustainably Mined Nickel & Cobalt
The International Energy Agency warns of a significant nickel shortfall in the near future unless refining capacities ramp up. This could lead to a substantial increase in spot prices within the next couple of years. Recently, Volkswagen faced a notable rise in cobalt procurement costs. This increase tightened margins for their plug-in hybrids, which depend on smaller battery volumes to navigate price shifts. Meanwhile, BMW is transitioning from nickel-manganese-cobalt cells in hybrids to lithium-iron-phosphate cells. This shift prioritizes supply security over energy density. In the coming years, EU battery regulations will require a higher percentage of recycled cobalt content. However, achieving this target is challenging due to the limited collection of end-of-life hybrid batteries. As a result, automakers are compelled to redesign their battery packs to avoid hefty compliance fines in Europe and North America.
Segment Analysis
By Hybrid Vehicle Type: Plug-In Adoption Outpaces, but HEV Volume Dominates
Traditional hybrid electric vehicles held 41.37% of the hybrid vehicle market share in 2025, whereas plug-in hybrids are on track to log a 13.17% CAGR to 2031. This leadership reflects the minimal charging dependency of standard hybrids, a decisive advantage in grids where public chargers remain scarce. Plug-in hybrids, however, benefit from larger policy credits, and their batteries are steadily dropping in cost, allowing OEMs to price them near gasoline trim levels. BYD’s Qin Plus DM-i undersells conventional sedans in China, bundling a 55 km electric range with an 18.3 kWh LFP pack.
Fleet demand continues to skew toward plug-in hybrids, where urban low-emission rules reward zero-tailpipe operation. Stellantis is committed to expanding the Wrangler 4xe battery capacity to 21.5 kWh in 2026, thereby qualifying for California’s 50-mile electric range rule. Mild hybrids, now standard on many North American pickups, strike a balance between fleet needs by offering 8–12% fuel savings at a fraction of the cost of full-hybrid models. However, HEVs will still account for the largest absolute volume in regions with limited charging infrastructure.
Note: Segment shares of all individual segments available upon report purchase
Get Detailed Market Forecasts at the Most Granular Levels
Download PDF
By Vehicle Type: LCVs Emerge as Sprinting Segment
Passenger cars accounted for 77.31% of the hybrid vehicle market share in 2025; however, light commercial vehicles are the fastest-growing class, with a 13.24% CAGR through 2031. Ford rolled out its Transit Custom plug-in hybrid in Europe in early 2025. With a moderate electric range, the vehicle enables emission-free deliveries in city centers, while also offering a substantial total driving radius. In Germany, Mercedes-Benz noted that orders for its eSprinter hybrid significantly outpaced those for BEV variants, highlighting fleet preferences to sidestep charging downtimes. Meanwhile, medium and heavy trucks are now integrating mild-hybrid systems, capturing braking energy during intercity journeys without compromising payload capacity.
By the end of the decade, the hybrid vehicle market share for LCVs may dwindle, especially as low-emission zone regulations extend from Europe to major capitals in Latin America. While passenger-car hybrids, particularly compact crossovers, will continue to hold a foothold in the Asia Pacific, their growth is expected to slow as urban consumers shift towards more affordable BEVs. On the other hand, commercial vans value the fueling flexibility that hybrids offer, especially for their diverse urban-rural routes and varying daily mileage.
By Motor Type: Induction Architectures Reduce Rare-Earth Exposure
Permanent-magnet synchronous motors accounted for 65.47% of the hybrid vehicle market share in 2025, favored for their efficiency and power density. Even so, induction motors exhibit a 13.26% CAGR through 2031, as they utilize neodymium, thereby reducing raw-material volatility. Tesla already shifted its Model 3 rear drive unit to induction to avoid rare-earth magnets. BYD’s Qin L DM-i utilizes a wound-rotor induction motor, delivering 160 kW of peak power, matching PMSM rivals while reducing motor costs.
Switched reluctance designs remain niche, but they gain attention for their low-speed torque in emerging-market hybrids. Axial-flux motors are appearing in premium plug-in SUVs, where compact packaging frees up cabin space; Mercedes-Benz has selected Yasa axial-flux units for its GLC 300e. The hybrid vehicle market size devoted to induction machines is projected to compound faster than overall demand.
Note: Segment shares of all individual segments available upon report purchase
Get Detailed Market Forecasts at the Most Granular Levels
Download PDF
By Battery Type: LFP Secures Plurality on Cost and Safety
Lithium-iron-phosphate claimed 47.17% of the hybrid vehicle market share in 2025 and sustains a 13.19% CAGR to 2031. BYD's Blade Battery, a proprietary innovation, has set a benchmark with significantly reduced costs and an impressive lifespan of thousands of charge cycles. In a strategic move, Ford plans to transition its Escape plug-in hybrids to LFP batteries in the near future. This shift comes with a slight compromise on range but translates to notable cost savings per vehicle. While nickel-metal hydride batteries still find a place in legacy hybrids from Toyota and Honda, they are gradually being phased out, especially as recycling challenges become more pronounced.
Mild hybrids, in particular, value LFP's thermal stability. This is crucial, as their battery packs frequently undergo rapid charge-discharge cycles, often in high engine bay temperatures. Volkswagen has charted a clear course: dedicating LFP batteries to plug-in hybrids with shorter electric ranges, while reserving nickel-based chemistries for their long-range battery electric vehicles (BEVs). Meanwhile, newer chemistries, such as sodium-ion, are projected to remain on the sidelines for volume hybrid applications for several years, solidifying LFP's leading position in the market.
Geography Analysis
Asia Pacific commanded 38.73% of the hybrid vehicle market share in 2025 and is projected to grow at a 13.21% CAGR through 2031. In recent years, China's sales of plug-in hybrids have surged, driven by supportive policies that incentivize production and sales, as well as competitive pricing strategies by leading manufacturers. Japan remains the world's leading exporter of conventional hybrids, serving key markets in Southeast Asia, the Middle East, and Latin America. Tax reductions on vigorous hybrids in India have narrowed the price gap with diesel vehicles, leading to a notable increase in hybrid vehicle registrations. In South Korea, national subsidies are providing substantial support to plug-in hybrid variants of popular models, boosting their adoption.
North America is witnessing a resurgence in hybrids as automakers address uncertainties surrounding battery-electric vehicles. Hybrid sales in the United States have seen significant growth, with major players dominating the market. Canada has extended incentives for plug-in hybrids with longer electric ranges, sustaining demand for popular models.
In contrast, Europe has experienced a decline in plug-in hybrid registrations, mainly due to the withdrawal of subsidies in key markets and uncertainty surrounding future zero-emission credit policies. The United Kingdom has maintained a reduced grant for affordable plug-in vehicles, shifting consumer interest towards mainstream crossovers rather than premium hybrids.
While South America and the Middle East are still in the early stages of hybrid adoption, they are experiencing rapid growth. In Brazil, tariff reductions on hybrids have significantly boosted the market share of leading models. In the United Arab Emirates, incentives such as free parking and toll exemptions for plug-in hybrids with longer electric ranges have encouraged luxury brands to introduce models that comply with these requirements. Saudi Arabia, as part of its Vision 2030 sustainability goals, plans to procure a substantial number of hybrid vehicles for its government fleets in the coming years. Although current volumes remain relatively low, these initiatives are expected to drive future demand as charging infrastructure develops.
Get Analysis on Important Geographic Markets
Download PDF
Competitive Landscape
In 2025, the hybrid vehicle market experienced moderate concentration, with Toyota, Honda, and BYD collectively accounting for a significant portion of the global volume. Toyota, having delivered a substantial number of hybrids that year, is actively refining its power-split architecture and battery management. Yet, with a limited lineup of plug-ins, Toyota is losing ground in the Chinese market to BYD. BYD's advantage stems from its vertically integrated battery and motor supply, enabling it to significantly undercut prices.
After brief hiatuses, Western automakers are making a comeback in the hybrid arena. Ford has reintroduced plug-in programs for its F-Series trucks, banking on fleet emission credits and alleviating concerns about towing range to validate the need for dual drivetrains. General Motors, eyeing a balanced approach to its BEV roadmap, has confirmed new Chevrolet and GMC hybrids for the 2026 model year. Stellantis, with an eye on cost efficiency, is utilizing 48-volt mild-hybrid systems in its Ram and Jeep models to meet standards in both the United States and Europe. The technological battleground is now centered on induction motors, axial-flux designs, and LFP battery packaging. Not to be left behind, Mercedes-Benz has patented segmented axial-flux motors, which promise a significant reduction in copper content, targeting a 2026 debut in their PHEVs.
Chinese contenders, such as Geely’s Lynk & Co. and SAIC’s MG, are rapidly expanding their footprints. Mazda’s MX-30 R-EV, featuring a rotary range extender, showcases niche innovations aimed at urban consumers who desire compact vehicles with occasional long-range capabilities. As price wars intensify, the industry's focus on supply-chain resilience, particularly regarding cobalt, nickel, and rare-earth elements, will play a pivotal role in determining long-term competitive standings.
Hybrid Vehicle Industry Leaders
Toyota Motor Corporation
BMW AG
Mercedes-Benz Group AG
Honda Motor Co., Ltd.
BYD Co., Ltd.
- *Disclaimer: Major Players sorted in no particular order
Need More Details on Market Players and Competitors?
Download PDF
Recent Industry Developments
- June 2025: General Motors announced the introduction of new Chevrolet hybrids for the 2026 model year, aiming to align its EV strategy with the United States' tightening emission regulations.
- May 2025: Toyota announced that the 2026 RAV4 will be exclusively available as a hybrid, mirroring the company's strategy of offering the 2025 Camry solely as a hybrid.
- April 2025: Horse Powertrain unveils a compact, fully integrated hybrid module at Auto Shanghai 2025, offering OEMs a seamless drop-in solution for their existing EV platforms.
Research Methodology Framework and Report Scope
Market Definitions and Key Coverage
Our study defines the hybrid vehicle market as every new on-road passenger car and commercial vehicle that pairs an internal-combustion engine with an electric traction system able to propel the wheels; micro, mild, full, and plug-in hybrids shipped through OEM channels are counted at manufacturer selling price, net of incentives and taxes.
Scope Exclusion. We leave out retrofit kits, off-highway machinery, and pure battery-electric or fuel-cell models.
Segmentation Overview
- By Hybrid Vehicle Type
- Mild-Hybrid
- Hybrid Electric Vehicle (HEV)
- Plug-in Hybrid (PHEV)
- By Vehicle Type
- Passenger Cars
- Light Commercial Vehicles
- Medium and Heavy Commercial Vehicles
- By Motor Type
- Permanent Magnet Synchronous AC Motor (PMSM)
- Induction (Asynchronous) AC Motor
- Switched Reluctance Motor (SRM)
- Axial-Flux Motor
- By Battery Type
- Nickel-Metal Hydride
- Lithium-iron Phosphate Battery
- Others
- By Geography
- North America
- United States
- Canada
- Rest of North America
- South America
- Brazil
- Argentina
- Rest of South America
- Europe
- Germany
- United Kingdom
- France
- Italy
- Spain
- Rest of Europe
- Asia-Pacific
- China
- India
- Japan
- South Korea
- Rest of Asia-Pacific
- Middle East and Africa
- United Arab Emirates
- Saudi Arabia
- South Africa
- Turkey
- Rest of Middle East and Africa
- North America
Detailed Research Methodology and Data Validation
Primary Research
We spoke with power-train engineers, tier-one component suppliers, fleet buyers, and policy officials across Asia-Pacific, Europe, and North America. Their insights let us fine-tune battery cost curves, hybrid take-rates, and real-world price dispersion, confirming early desk findings and highlighting regional nuances.
Desk Research
We began by mapping supply and demand signals from open datasets such as OICA production logs, IEA alternative-fuel statistics, Eurostat registration files, and UN Comtrade HS-8703 trade flows. We then matched them with policy texts from US EPA CAFE rules, EU fleet CO2 targets, and JAMA roadmaps. Corporate 10-Ks, investor decks, and reputable press helped us shape average selling prices. Paid portals, including D&B Hoovers for company financials and Marklines for model-level launches, added depth. These references illustrate, not exhaust, the wider pool we reviewed to cross-check and clarify figures.
Additional desk work covered customs data, patent filings, and country fuel-price trackers, so we could ground our assumptions in verifiable public evidence before moving to primary validation. Many further sources were screened to close residual gaps.
Market-Sizing & Forecasting
Our top-down model starts with country production plus imports, applies verified hybrid penetration by propulsion class to derive unit pools, and then multiplies by sampled OEM price lists to estimate revenue. Parallel bottom-up checks, such as selected supplier roll-ups, keep totals anchored. Key variables tracked include 48 V adoption, lithium-ion $/kWh trends, CAFE step-ups, retail fuel prices, and OEM launch pipelines. A multivariate regression, supported by expert consensus, projects demand through 2030, with scenario analysis where policy shocks loom.
Data Validation & Update Cycle
Outputs face peer reviews, variance checks against shipment trackers, and reconciliation with macro drivers. Models refresh every twelve months, with interim revisions if material events occur. Before release, an analyst reruns the latest data import so clients receive the most current view.
Why Mordor's Hybrid Car Baseline Earns Decision-Maker Trust
Published figures differ because firms group technologies differently, treat incentives in their own way, and refresh at unequal intervals.
Key gap drivers we observe are whether 12 V mild systems are included, how fleet rebates are netted, the timing of currency conversion, and the speed at which battery-cost assumptions are updated. Mordor's scope mirrors regulatory definitions, and our annual refresh captures rapidly shifting cost curves, keeping our totals aligned with market reality.
Benchmark comparison
| Market Size | Anonymized source | Primary gap driver |
|---|---|---|
| USD 261.51 B (2025) | Mordor Intelligence | |
| USD 312.80 B (2025) | Global Consultancy A | Counts only passenger cars yet applies global average ASP, inflating value |
| USD 291.42 B (2024) | Industry Publisher B | Uses fixed 2022 exchange rates and excludes OEM rebates, lifting topline |
| USD 568.93 B (2024) | Data Aggregator C | Adds hybrid component revenue and retrofit kits to vehicle sales |
The comparison shows that scope, pricing treatment, and refresh cadence can swing totals widely; Mordor's disciplined variable selection and transparent steps deliver a balanced, repeatable baseline our clients can rely on.
Need A Different Region or Segment?
Customize Now
Key Questions Answered in the Report
How fast is the hybrid car segment expected to grow by 2031?
It is projected to advance at a 13.16% CAGR, rising from USD 298.03 billion in 2026 to USD 553 billion by 2031.
Which region currently leads global hybrid vehicle sales?
Asia Pacific generated 38.73% of 2025 revenue and is forecast to maintain leadership with a 13.21% CAGR through 2031.
Which vehicle class is projected to post the quickest hybrid adoption?
Light commercial vehicles are set to expand at a 13.24% CAGR, driven by last-mile fleets seeking low-emission-zone access without range limits.
What battery chemistry dominates today’s hybrid models?
Lithium-iron-phosphate packs held a 47.17% share in 2025, favored for their cost, safety, and cycle-life advantages.
Why do some buyers choose hybrids instead of battery-electric vehicles?
Fuel-price volatility and limited charging infrastructure make hybrids attractive where grid capacity or fast chargers are scarce.
How are light trucks meeting emissions rules without full electrification?
Widespread 48-volt mild-hybrid systems cut fuel use 8–12% at low cost, helping pickups and SUVs comply with tightening CO₂ limits.


