
Market Overview
| Study Period | 2018 - 2031 |
|---|---|
| Forecast Data Period | 2026 - 2031 |
| Base Year Market Size (2025) | USD 4.51 Billion |
| Market Size (2026) | USD 4.57 Billion |
| Market Size (2031) | USD 4.86 Billion |
| Growth Rate (2026 - 2031) | 1.24 % |
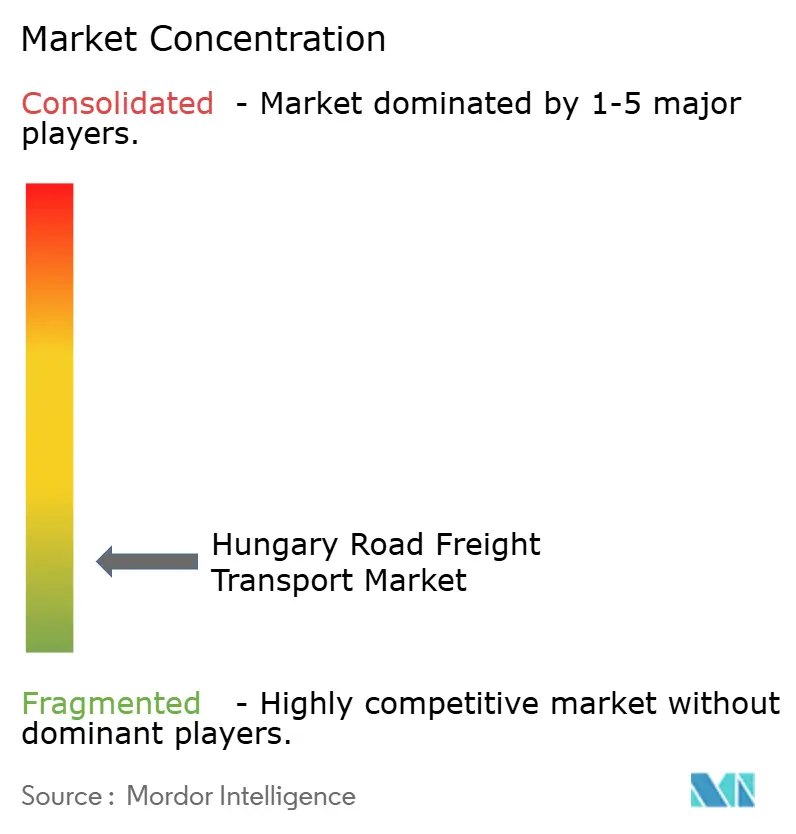
| Market Concentration | Low |
Major Players *Disclaimer: Major Players sorted in no particular order Image © Mordor Intelligence. Reuse requires attribution under CC BY 4.0. | |
Hungary Road Freight Transport Market Analysis by Mordor Intelligence
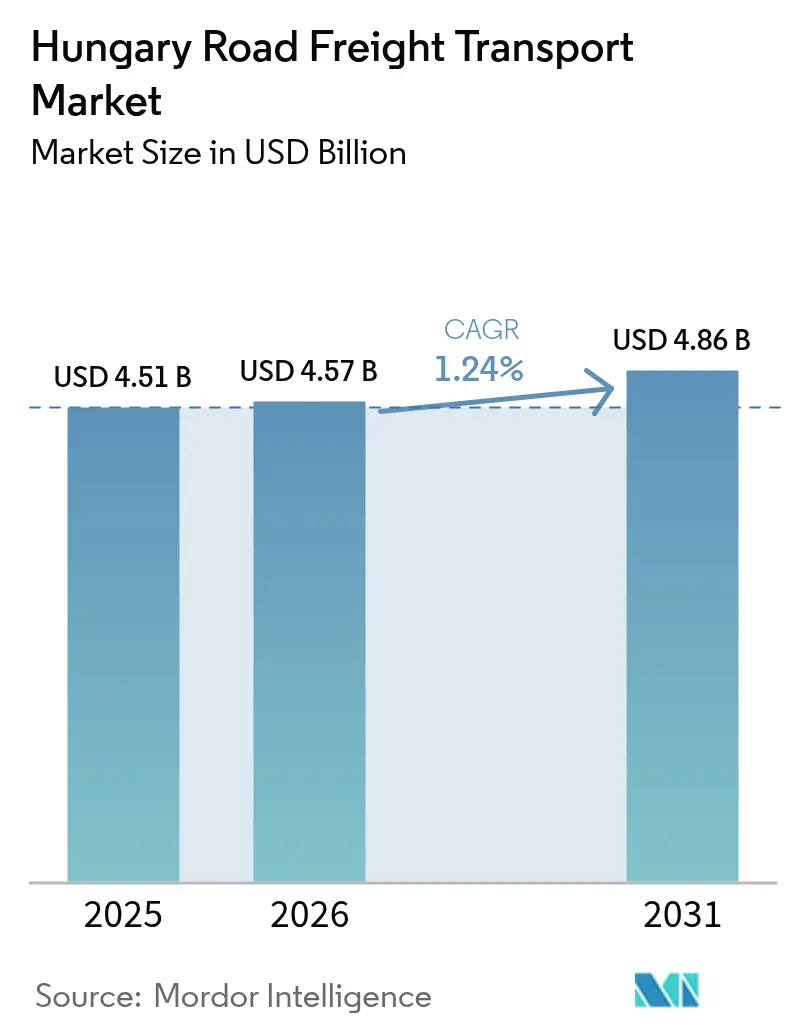
The Hungary road freight transport market size was valued at USD 4.51 billion in 2025 and estimated to grow from USD 4.57 billion in 2026 to reach USD 4.86 billion by 2031, at a CAGR of 1.24% during the forecast period (2026-2031). Near-shoring of European supply chains, sustained automotive and electronics exports, and EU-funded infrastructure upgrades provide a foundation for stable growth. At the same time, acute driver shortages, rising HU-GO distance-based tolls, and looming Euro-7 CAPEX outlays tighten margins. The market’s ability to deploy advanced fleet telematics, real-time documentation, and intermodal connectivity continues to offset operating-cost pressure. As a result, the Hungary road freight transport market increasingly supports high-value just-in-time flows for original-equipment manufacturers and surging e-commerce volumes concentrated in Budapest and Central Hungary.
Key Report Takeaways
- By end user industry, manufacturing led with 30.62% of the Hungary road freight transport market share in 2025; wholesale and retail trade is forecast to expand at a 1.44% CAGR between 2026-2031.
- By destination, the domestic sub-segment commanded 63.72% of the Hungary road freight transport market size in 2025, while the international sub-segment is projected to grow at a 1.61% CAGR between 2026-2031.
- By truckload specification, full-truck-load operations held 69.78% revenue share in 2025; less-than-truck-load is set to advance at a 1.41% CAGR between 2026-2031.
- By containerization, the non-containerized sub-segment represented 87.42% revenue share in 2025, whereas the containerized sub-segment is set to rise at a 1.29% CAGR between 2026-2031.
- By distance, long-haul services captured 73.05% revenue share in 2025, while short-haul movements recorded the fastest 1.43% CAGR between 2026-2031.
- By goods configuration, solid goods dominated with 74.44% market share in 2025; fluid goods are predicted to grow at a 1.37% CAGR between 2026-2031.
- By temperature control, the non-temperature controlled sub-segment accounted for 94.12% revenue share in 2025; the temperature controlled sub-segment is projected to increase at a 1.39% CAGR between 2026-2031.
Note: Market size and forecast figures in this report are generated using Mordor Intelligence’s proprietary estimation framework, updated with the latest available data and insights as of 2026.
Hungary Road Freight Transport Market Trends and Insights
Drivers Impact Analysis*
| Driver | (~) % Impact on CAGR Forecast | Geographic Relevance | Impact Timeline |
|---|---|---|---|
| Hungary’s expanding automotive and electronics export base is intensifying just-in-time road-haulage requirements | +0.3% | Budapest–Debrecen–Győr corridors | Medium term (2-4 years) |
| Surging e-commerce parcel activity in Budapest and Central Hungary is multiplying middle-mile and urban LTL movements | +0.2% | Budapest andCentral Hungary | Short term (≤ 2 years) |
| Accelerated near-shoring of OEM supply chains is boosting domestic component shuttle lanes | +0.2% | National clusters | Medium term (2-4 years) |
| CEF2 funded intermodal terminals are creating extra first/last-mile trucking demand | +0.1% | National corridors | Long term (≥ 4 years) |
| Post drought capacity constraints on rail and barge networks have shifted seasonal agri-bulk flows onto roads | +0.1% | Agricultural regions | Short term (≤ 2 years) |
| Nationwide ITS deployment and digital documentation are raising fleet utilization | +0.1% | Country-wide | Medium term (2-4 years) |
| Source: Mordor Intelligence | |||
Hungary’s Expanding Automotive and Electronics Export Base Intensifying Just-in-Time Road-Haulage Requirements
Automotive accounts for over one-quarter of Hungary’s manufacturing output, reinforced by BYD’s European headquarters and BMW’s new plant beginning series production in the second half of 2025[1]. These facilities rely on high-frequency shuttle lanes that prioritize road over rail for component flows needing sub-24-hour lead times. The USD 167.7 billion merchandise-export tally in 2024 underlines the scale of precision logistics needed to keep assembly lines supplied. Dedicated carriers gain volume from temperature-controlled and time-sensitive electronics, while less-than-truck-load (LTL) networks capture incremental traffic created by lean inventory strategies. Dense corridors around Budapest, Debrecen, and Gyor allow route optimization systems to lift asset-utilization levels and mitigate driver-shortage risk.
Surging E-Commerce Parcel Activity in Budapest and Central Hungary Multiplying Middle-Mile and Urban LTL Movements
E-commerce gross merchandise value reached USD 2.77 billion in 2025, sharply increasing parcel density in the capital region[2]. Online retailers now prioritize two-hour to next-day delivery windows, pushing carriers to adopt load-pooling algorithms for middle-mile transfer between fulfillment hubs and micro-depots. Budapest’s smart loading-area pilots and dynamic vehicle-routing tools developed under EU urban-logistics programs enhance curb-side productivity and limit congestion fees. LTL providers benefit from multi-stop optimization that amortizes tolls and driver time over larger delivery maps. The resulting uptick in Hungary road freight transport market demand for smaller vans and rigid trucks fuels incremental fleet orders despite higher unit CAPEX.
Accelerated Near-Shoring of OEM Supply Chains Boosting Domestic Component Shuttle Lanes
Heightened geopolitical risk accelerates supplier relocation from distant locations to the Visegrád group. Hungary earmarked EUR 15.4 billion (USD 16.99 billion) for a decade-long rail upgrade to reinforce national manufacturing ecosystems and trim cross-border complexity. As inputs travel shorter distances, daily component shuttles between tier-1 suppliers and assembly plants grow in frequency, underpinning full-truck-load (FTL) corridors and fostering stable, contract-backed lane density. Single-market customs clearance simplifies scheduling and enables backhaul pairing, reducing empty-run kilometers and cushioning Hungary road freight transport market operators against rising toll outlays.
CEF2-Funded Intermodal Terminals Creating Extra First/Last-Mile Trucking Demand
Four green-field terminals financed through the EU’s Connecting Europe Facility Phase 2 will add more than 1.5 million TEU of rail throughput by 2027, led by the fully operational Fényeslitke East-West Gate hub. Intermodal transfers rarely negate the need for trucks; instead, they spawn first- and last-mile drayage contracts that elevate demand for 40-ft skeletal trailers, lift-gate rigid trucks, and container-chassis fleets. Operators that integrate rail and road visibility platforms position themselves to win high-frequency shuttles linking inland depots with automotive or consumer-goods warehouses scattered across Central Hungary.
Restraints Impact Analysis*
| Restraint | (~) % Impact on CAGR Forecast | Geographic Relevance | Impact Timeline |
|---|---|---|---|
| A persistent shortage of qualified drivers is inflating labor costs and limiting capacity growth | -0.4% | Country-wide, acute in rural zones | Long term (≥ 4 years) |
| HU-GO toll increases are compressing operating margins on main corridors | -0.2% | Core motorway network | Short term (≤ 2 years) |
| Euro-7 emission standards impose high cap-ex burdens on SME fleets | -0.2% | National; larger drag on SME fleets | Medium term (2-4 years) |
| Congestion on the M3/M35 motorways is eroding on-time performance and raising penalties | -0.1% | Eastern Hungary | Short term (≤ 2 years) |
| Source: Mordor Intelligence | |||
Persistent Shortage of Qualified Drivers Inflating Labor Costs and Limiting Capacity Growth
Europe may face a 745,000-driver gap by 2028; Hungary mirrors this trend, where 31.6% of drivers exceed 55 years of age and only 6.5% are younger than 25[3]. Wage escalation, bonus schemes, and retention programs add direct operating expense, while unseated assets erode utilization. SMEs lacking human-resource scale are most exposed, accelerating consolidation toward well-capitalized fleets able to fund training and automation initiatives, such as assisted-driving retrofits aimed at improving work conditions.
HU-GO Toll Increases Compressing Operating Margins on Main Corridors
A 3.4% tariff adjustment effective January 2025 lifted Hungary’s distance-based road-user charges across the M0, M1, and M3 axes, raising the cost per km for both domestic and cross-border hauls. Carriers with route-planning analytics mitigate exposure, yet profitability headroom shrinks, particularly for low-margin bulk segments. Anticipated CO₂-indexed toll differentiation from 2026 further incentivizes accelerated fleet renewal toward Euro-6d and alternative-fuel drivetrains.
*Our forecasts treat driver/restraint impacts as directional, not additive. The impact forecasts reflect baseline growth, mix effects, and variable interactions.
Segment Analysis
By End-User Industry: Manufacturing Underpins Automotive Supply Chain Precision
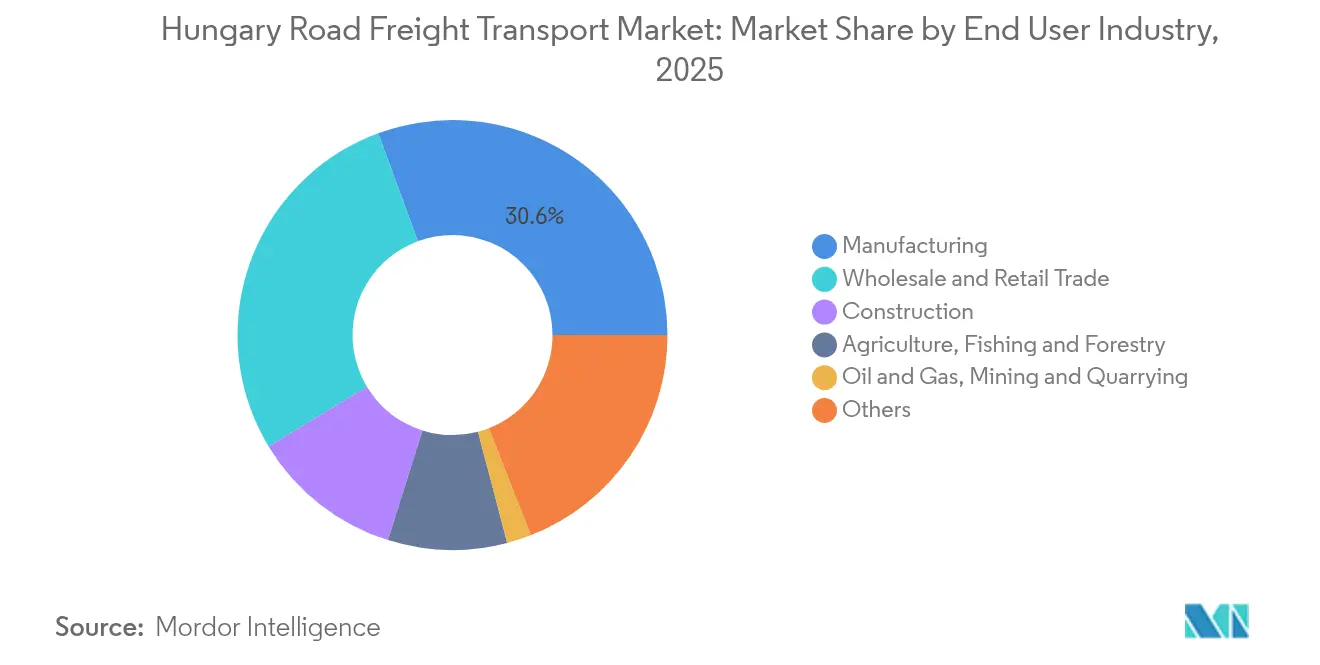
Manufacturing held 30.62% Hungary road freight transport market share in 2025, sustained by USD 167.7 billion worth of automotive and electronics exports. The segment generates high-frequency FTL shuttle flows of components, engines, and finished vehicles that demand GPS-tracked curtain-side trailers and selective temperature control for sensitive electronics. Upskilling toward electric-vehicle power-train production expands demand for lithium-battery transport in ADR-compliant equipment. In contrast, wholesale and retail trade, enabled by e-commerce, GMV of USD 2.77 billion, expands fastest at 1.44% CAGR between 2026-2031 as omnichannel retailers migrate to hub-and-spoke networks. These dynamics shift resource allocation toward LTL vans fitted with barcode-linked proof-of-delivery apps.
Across lower-volume verticals, construction sustains flat yet steady traffic aligned to the EUR 15.4 billion (USD 16.99 billion) rail-modernization rollout; agriculture taps spot capacity during harvest peaks; and oil and gas retains specialized tanker demand despite rerouted energy imports. Each niche forces carriers to diversify equipment: walking-floor trailers for grain, flatbeds for steel, and pressurized tanks for refined fuels. As a result, the Hungary road freight transport industry relies on multi-commodity fleet strategies to preserve margin.

By Truckload Specification: FTL Dominance Faces Technology-Driven LTL Upswing
Full-truck-load services commanded 69.78% Hungary road freight transport market share in 2025, reflecting repetitive plant-to-plant moves. Large shippers lock in contract capacity, shielding carriers from spot-rate swings. However, LTL advances at 1.41% CAGR between 2026-2031 as cloud-based consolidation platforms match partial loads into optimized multi-drop tours. Algorithms dynamically group consignments that share delivery slots, tightening empty-space ratios and improving driver work-life balance through predictable regional loops.
FTL providers counter by adopting drop-and-hook trailer pools and predictive-maintenance sensors to retain service reliability. Yet expanding e-commerce triggers a structural flow toward pallet-level distribution, enhancing the strategic relevance of LTL within the Hungary road freight transport market.
By Containerization: Bulk-Driven Non-Containerized Strength as TEU Share Inches Up
Non-containerized cargo represented 87.42% share of the Hungary road freight transport market size in 2025 given the prevalence of grain, construction materials, and oversized machinery. Tipper, walking-floor, and low-bed trailers remain essential, particularly when Danube navigation limits or rail congestion redirect bulk volumes onto roads.
Meanwhile, containerized traffic grows at a 1.29% CAGR between 2026-2031, propelled by Fényeslitke’s remote-operated cranes and inland depots extending 45G connection to shipping lines. Operators offering tri-modal visibility suites win tenders from freight forwarders seeking single-invoice drayage.
By Distance: Long-Haul Backbone Meets Urban-Centered Short-Haul Expansion
Long-haul corridors absorbed 73.05% market share in 2025, leveraging Hungary’s central location to connect Vienna, Bratislava, and the Port of Koper with Balkan and Black Sea endpoints. These routes suffer most from driver scarcity and time-window penalties.
Short-haul flows, projected at 1.43% CAGR between 2026-2031, are driven by Budapest’s urban-consolidation centers and daily component shuttles under 200 km radius. Autonomous yard tractors and electric light-commercial vehicles gradually penetrate the short-haul niche, supported by municipal zero-emission-zone incentives.
By Destination: Domestic Corridor Density Meets Rising Cross-Border Momentum
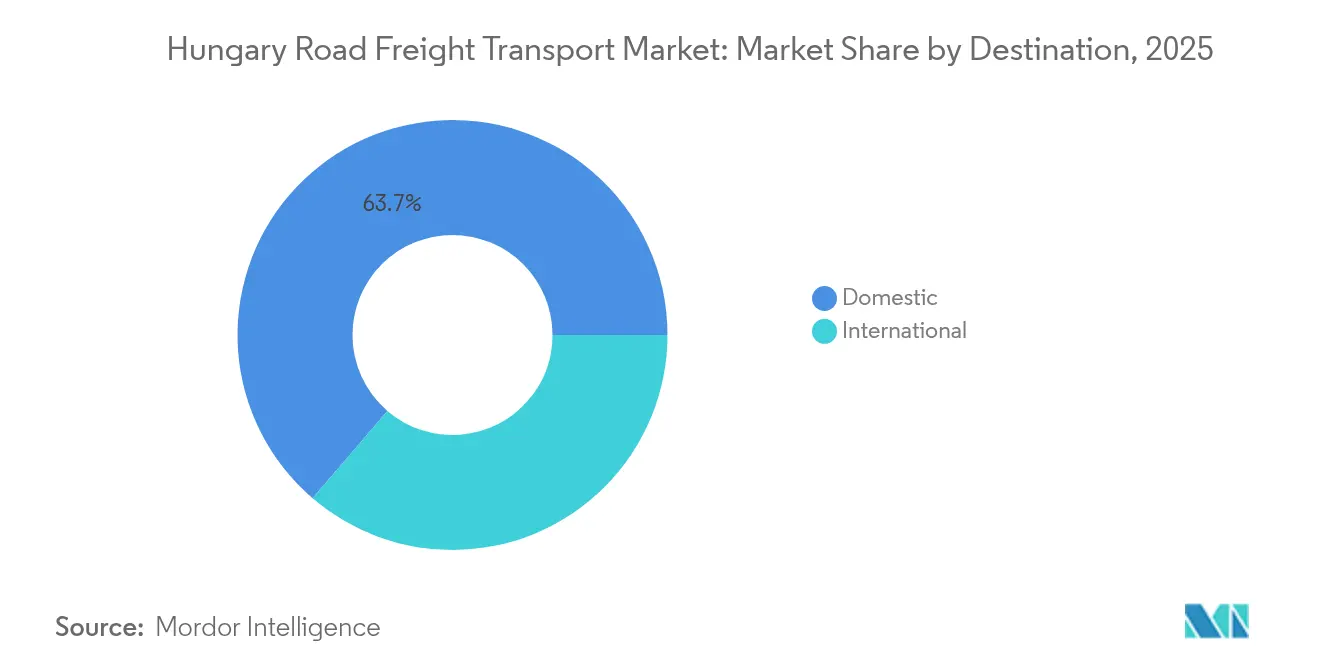
Domestic freight retained a 63.72% share of the Hungary road freight transport market size in 2025 on the back of clustered industrial geography and EU customs-free movement. Dense loops linking Budapest, Debrecen, and Győr enable 2-turn daily cycles that heighten tractor productivity. Nevertheless, the international segment’s 1.61% CAGR between 2026-2031 underscores Hungary’s pivot toward an East-West gateway for Asian cargo redirected through new Silk Road alignments. Fleet operators refreshing tractors with comfortable cabs and digital tachograph upgrades compete more effectively for long-haul stages to Germany, Italy, and Romania.
Seasonal volatility still favors domestic specialization, yet cross-border carriers that combine bonded-warehouse services and customs brokerage capture incremental throughput amid geopolitical rerouting. This evolution keeps the Hungary road freight transport market versatile across intra-EU and broader Eurasian corridors.
By Goods Configuration: Solid Cargo Core vs. Specialized Fluid Opportunities
Solid goods accounted for 74.44% of the Hungary road freight transport market share in 2025, comprising everything from auto parts and white goods to parcel traffic. Carriers invest in load-securing automation and video-telematics to protect high-value electronics.
Fluid goods, projected at 1.37% CAGR between 2026-2031, include fuels, lubricants, dairy, and edible oils. ADR compliance, stainless-steel tank cleaning, and temperature-control linings elevate entry barriers, allowing specialized operators to command premium rates yet face higher equipment renewal costs under Euro-7.
By Temperature Control: Broad Dry-Cargo Base With Focused Cold-Chain Growth
Non-temperature-controlled freight captured a 94.12% share in 2025, as most manufactured and bulk commodities travel dry. Temperature-controlled flows expand at 1.39% CAGR between 2026-2031, reflecting Hungary’s meat-processing exports and vaccine logistics aligned to EU pharmaceutical distribution hubs.
Reefer carriers deploy real-time temperature trackers and door-sensor telemetry to maintain GDP compliance, creating a differentiated service tier within the broader Hungary road freight transport market.
Geography Analysis
Hungary’s central location keeps 63.72% of freight movements domestic, yet its strategic corridors enable consistent cross-border growth. Budapest sits at the confluence of TEN-T Core Network corridors and records the nation’s highest logistics land values, driven by e-commerce GMV of USD 2.77 billion that sustains final-mile demand. The surrounding Central Transdanubia and Northern Great Plain regions accommodate automotive tier-1 suppliers, forming dense FTL lanes that underpin fleet investments.
Eastern gateways gain prominence as Fényeslitke’s intermodal hub scales, allowing Ukrainian agribulk and Chinese overland containers to penetrate EU markets with one stop. Northern cross-border links via Bratislava and Vienna remain high-frequency due to synchronized production schedules between Hungarian assembly plants and Austrian component makers. Southern routes into Serbia and Romania absorb rerouted cargo while EU accession negotiations continue, providing growth headroom once customs formalities decline.
Rural counties leverage EU Cohesion Funds to modernize feeder roads, enabling higher weight limits and thus improving backhaul opportunities for regional carriers. Nonetheless, the HU-GO E-toll’s 3.4% uplift hits longer domestic stretches hardest, pressuring rate recalculations that ripple across the Hungary road freight transport market.
Regulatory Landscape
Hungary road freight operators face a tighter compliance environment that combines higher road-user charges with more prescriptive routing requirements for HGVs. From January 1, 2026, the Ministry of Construction and Transport (ÉKM) implemented Decree 44/2025 (XII. 23.) to channel international transit HGV traffic onto designated motorways/expressways and specified transit routes, followed by ministry guidance in June 2026 clarifying interpretation and exemptions around loading and unloading in Hungary.
The cost and control measures also rely on e-administration and toll enforcement. The BIREG system remains a mandatory electronic registration interface for bilateral and multilateral freight authorizations and cabotage administration under the responsible ministry. In parallel, the 2026 two-stage HGV toll increase (cited as totaling 35% over 2025 rates) raises the financial stakes of routing and compliance, particularly on main-road sections where charges have been adjusted upward to discourage diversion through smaller settlements.
Value Chain Analysis
The Hungary road freight transport value chain runs from shippers (manufacturing and wholesale/retail trade) through freight forwarders and 3PLs, dispatch and brokerage platforms, and carriers (from owner-operators to integrated fleets). Supporting services such as fuel, tolling, leasing and financing, maintenance, insurance, telematics, and compliance administration sit alongside the execution layer. Road haulage is increasingly paired with contract logistics (warehousing and cross-docking) around Budapest and major industrial corridors, and with rail-road interfaces where intermodal terminals and inland hubs create drayage, chassis management, and time-slot coordination needs.
Two structural frictions shape how value is captured. First, operating-cost inflation has pressured carrier economics (with industry reporting pointing to high single-digit year-on-year cost increases in Q4 2025 for both domestic and international hauling). Fleets respond by prioritizing utilization tools (route optimization, drop-and-hook, and real-time documentation) and using more disciplined tender pricing. Second, policy direction under the National Logistics Concept 2030-2035 (adopted in November 2025) increases the emphasis on combined transport, with planned transshipment capacity in locations such as Zalaegerszeg, Gyor, and Szeged. This expands the role of intermodal operators and adds first/last-mile complexity for trucking providers.
Competitive Landscape
The Hungary road freight transport market is highly fragmented. However, the top five to ten providers collectively hold a significant revenue share, leaving space for niche specialists. Waberer’s International operates nearly 3,000 tractors and 250,000 m² of warehousing, supported by proprietary AI-driven dispatch systems that lift the empty-km ratio below 10%[4]. Its 62.5% acquisition of GySEV Cargo in 2025 aims to fuse rail-road services and hedge against fuel-price volatility.
Multinationals such as DHL Freight and DSV capitalize on pan-European network density to offer guaranteed cross-border capacity and integrated customs brokerage. Domestic mid-caps target temperature-controlled and dangerous-goods haulage where skill scarcity discourages entry. Start-ups backed by venture capital deploy freight-matching platforms that aggregate SME carrier capacity, offering dynamic pricing to e-commerce shippers.
Regulatory costs and driver attrition hasten consolidation. Carriers able to finance Euro-7 tractor replacements and implement CO₂ telematics reporting are positioned to win tenders from automotive OEMs seeking Scope 3 emissions visibility. Technology adoption—digital proof-of-delivery, real-time truck-parking apps, and predictive maintenance—has become a primary competitive lever across the Hungary road freight transport market.
Hungary Road Freight Transport Industry Leaders
-
Waberer’s International Nyrt.
-
Trans-Sped Kft.
-
Revesz Group
-
DHL Group
-
Raben Group
- *Disclaimer: Major Players sorted in no particular order
Market Opportunities and Future Outlook
Regulatory rerouting and toll differentiation create whitespace for carriers that can redesign networks around motorways, tighten time-window planning, and demonstrate compliance digitally. The January 1, 2026 transit-route framework in Decree 44/2025 and the June 2026 follow-on clarifications shift how international traffic is scheduled versus domestic distribution. That supports providers that build dedicated motorway-based linehaul and cross-dock patterns while still serving industrial zones that require local access.
Intermodal-linked trucking is a second opportunity cluster anchored in active national policy and terminal development. The National Logistics Concept 2030-2035 (adopted November 2025) targets raising combined-transport share from 7% to 21% by 2030 and names additional transshipment capacity in Zalaegerszeg, Gyor, and Szeged. This supports demand for standardized container drayage, chassis pools, and visibility integration across road and rail. Infrastructure upgrades also reinforce corridor capacity and reliability for road freight, including MKIF starting the M1 motorway widening (September 2025) and a 2026 design award for a 2x2-lane Debrecen to Nyiregyhaza link, both of which support east-west and regional manufacturing connectivity for time-sensitive loads.
Recent Industry Developments
- April 2026: Révész Trans Kft. inaugurated a new logistics base in Tiszaújváros as part of a HUF 3.2 billion capacity expansion project that also includes facilities in Kazincbarcika. With HUF 1.4 billion in government support, the build-out increases regional warehousing and handling capacity near key industrial activity, tightening the link between contract logistics and local road-haulage lanes.
- January 2025: Waberer’s International acquired a 62.5% stake in GySEV Cargo to expand intermodal capabilities and integrate rail and road services. The move strengthens access to combined-transport solutions and supports more structured first/last-mile trucking tied to rail flows across Hungary and neighboring corridors.
- November 2024: Kuehne + Nagel upgraded its Hungary-wide LTL network for healthcare cargo by enhancing temperature-controlled facilities, specialized handling protocols, and shipment tracking. The investment raises service capability in regulated cold-chain distribution and supports higher-value road freight movements that require tighter visibility and compliance.
Research Methodology Framework and Report Scope
Market Definition and Coverage
For this study, the market means the value of paid road-based freight transport services in Hungary, where cargo is moved by commercial trucks on domestic routes and cross-border routes, and revenue is counted when the transport service is delivered.
Scope exclusions: We exclude courier and parcel delivery networks, passenger transport, and non-road freight modes such as rail, air, and inland waterways.
Segmentation Overview
- End User Industry
- Agriculture, Fishing, and Forestry
- Construction
- Manufacturing
- Oil and Gas, Mining and Quarrying
- Wholesale and Retail Trade
- Others
- Destination
- Domestic
- International
- Truckload Specification
- Full-Truck-Load (FTL)
- Less than-Truck-Load (LTL)
- Containerization
- Containerized
- Non-Containerized
- Distance
- Long Haul
- Short Haul
- Goods Configuration
- Fluid Goods
- Solid Goods
- Temperature Control
- Non-Temperature Controlled
- Temperature Controlled
Data Sources, Market Sizing, and Validation
Desk Research
Desk work starts with anchoring Hungary freight activity to public movement and trade signals, so the later modeling is not built on assumptions alone. We typically refer to sources such as Eurostat road freight statistics (tons moved and ton-km), the Hungarian Central Statistical Office (KSH) transport series, and official trade and customs releases that indicate import and export flows.
Next, we reconstruct the cost and operating context using sources such as European Commission mobility and transport publications, national road toll and vignette information, and public energy price statistics that reflect diesel direction. Company annual reports, audited filings, investor presentations, and credible press releases are used to understand service mixes and pricing direction, and where it helps with cross-checking we also use paid subscriptions for company financial intelligence, news and financials, and shipment-level import and export records. These desk sources are illustrative only, and other public and proprietary sources are also reviewed for data collection, validation, and research clarification.
Primary Interviews and Surveys
We conduct expert interviews and surveys with road carriers, freight buyers, logistics managers, and transport specialists active in Hungary. Their views help check secondary activity data, fill gaps in pricing and utilization assumptions, and triangulate the final market estimate before sign-off.
Distribution of primary research fieldwork respondents
| Company type | Respondent position |
|---|---|
| Top tier: 27% | CXOs: 15% |
| Mid tier: 48% | Functional/Unit leaders: 32% |
| Smaller Players: 25% | Managers: 53% |
Market-Sizing & Forecasting
The core sizing uses a top-down build that reconstructs Hungary road freight revenues from activity and pricing signals, and then it is adjusted to match what operators say they see in the field. In practice, freight volumes and intensity indicators are taken from road freight movement series, trade-linked flows, and trucking utilization context, and then average revenue per ton-km style benchmarks are applied with Hungary-specific corrections.
To keep the model realistic, we track inputs such as ton-km trends, cross-border share of loads, diesel and toll cost movements, driver availability pressure, and the typical mix of FTL and LTL work. A selective bottom-up check is run using sampled carrier revenues, fleet size proxies, and simple ASP x volume approximations for key corridors, and then gaps are handled through calibrated ranges where small private operators do not disclose full financials.
For forecasting, we run scenario analysis and then blend it into one central case after expert feedback, because this market is sensitive to fuel costs, industrial output, and trade cycles. Growth paths are stress-tested against macro indicators and capacity constraints, so the final forecast remains traceable to a few clear drivers rather than hidden assumptions.
Data Validation & Update Cycle
Validation is done through triangulation across three layers: activity indicators, the direction of price and cost movements, and what interviewees report for utilization and yield. When outputs look unusual, we run variance checks against historic ranges, re-check currency timing, and revisit any step that may have doubled-counted cross-border movements.
Before sign-off, the model and the written logic go through a multi-step internal review, and follow-up calls are triggered when one assumption changes the totals more than expected. Reports are refreshed annually, with interim updates when major events occur such as sharp fuel shifts, toll reforms, or trade disruptions. Right before delivery, we complete a final pass so clients receive the most current view available.
Mordor Intelligence's Hungary Road Freight Transport Market Size Compared Against Other Published Estimates
Published market values for Hungary road freight transport can look far apart because each publisher draws the market boundary differently and also chooses different activity signals to convert into revenue. The year of pricing, treatment of cross-border work, and whether parcel-like deliveries are counted can move the total by a meaningful amount.
By checking ton-km movement, cross-border corridor intensity, and price refresh points inside the model, Mordor Intelligence keeps the estimate tied to paid trucking services and leaves courier and parcel networks outside the market total.
Benchmark comparison
| Source | Market Size | Gaps in Research Methodology |
|---|---|---|
| Mordor Intelligence | USD 4.51 B (2025) | |
| Industry Association A | USD 5.20 B (2025) | Often reported as a broader trucking and delivery services value, where parcel-style networks and some ancillary logistics charges can be included, which lifts the total versus pure freight haulage. |
| Trade Journal B | USD 3.90 B (2024) | Uses a different base year and tends to apply conservative yield assumptions during cost shocks, and it may rely more on smaller disclosed samples without lane-level validation of utilization changes. |
The spread across sources mostly comes from what is counted as road freight revenue and how pricing is refreshed for the chosen year. Our approach stays repeatable by linking the total to visible freight activity, then cross-checking with operator feedback so the final number can be explained with clear drivers.
Key Questions Answered in the Report
What is the current size of the Hungary road freight transport market?
The market is valued at USD 4.57 billion in 2026 and is forecast to reach USD 4.86 billion by 2031 at a 1.24% CAGR.
Which end-user industry contributes most to Hungarian road freight demand?
Manufacturing, driven by automotive and electronics exports, accounts for 30.62% of national freight revenues.
How are driver shortages affecting carriers’ profitability?
With 31.6% of drivers older than 55 and a widening talent gap, carriers raise wages and invest in retention, squeezing profit margins and accelerating fleet consolidation.
What role do intermodal terminals play in future growth?
EU-funded terminals such as Fényeslitke generate first- and last-mile trucking contracts, supporting containerized-traffic CAGR of 1.29% through 2031.
Why is less-than-truck-load (LTL) service gaining traction?
E-commerce GMV of USD 2.77 billion fuels frequent, small-lot deliveries that suit LTL networks supported by route-optimization technology, yielding a 1.41% segment CAGR.
How will Euro-7 standards influence fleet investment?
Stricter emission limits from 2027 compel carriers to renew tractors or adopt LNG/EV alternatives, increasing CAPEX but unlocking lower CO₂-indexed toll rates.