
Market Overview
| Study Period | 2020 - 2031 |
|---|---|
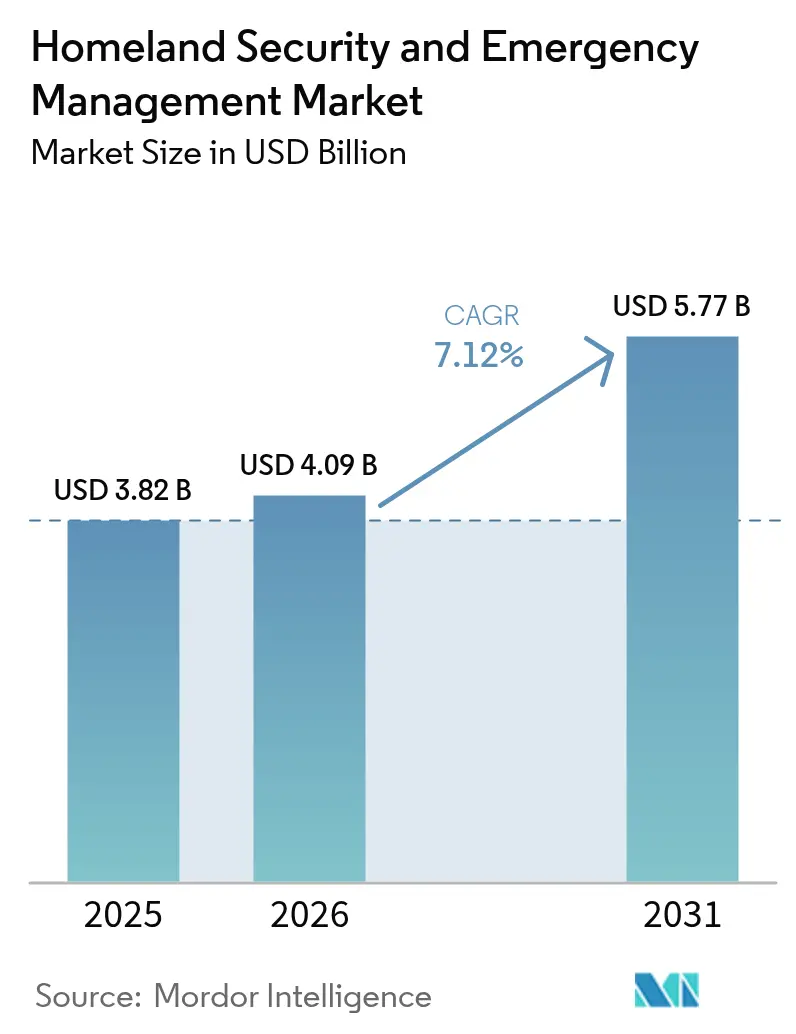
| Market Size (2026) | USD 4.09 Billion |
| Market Size (2031) | USD 5.77 Billion |
| Growth Rate (2026 - 2031) | 7.12 % |
| Fastest Growing Market | Asia Pacific |
| Largest Market | North America |
| Market Concentration | Medium |
Major Players *Disclaimer: Major Players sorted in no particular order Image © Mordor Intelligence. Reuse requires attribution under CC BY 4.0. | |
Homeland Security And Emergency Management Market Analysis by Mordor Intelligence
The homeland security and emergency management market size in 2026 is estimated at USD 4.09 billion, growing from 2025 value of USD 3.82 billion with 2031 projections showing USD 5.77 billion, growing at 7.12% CAGR over 2026-2031. Intensifying overlaps between cyber, physical, and environmental threats motivate governments and private operators to invest in integrated platforms that merge perimeter protection with real-time digital intelligence. State-sponsored cyberattacks, rising geopolitical frictions, and more frequent climate-driven disasters are expanding the addressable scope of the homeland security and emergency management market, while emerging technologies such as 5G, cloud, and AI deliver the scale required for nationwide rollouts. Competitive intensity is growing as defense primes partner with cloud and telecom players to field modular solutions for critical infrastructure, public safety communications, and border management. At the same time, purchasing decisions are moving toward outcome-based contracts in which vendors must demonstrate faster incident response and measurable risk reduction. As procurement frameworks mature, regional differentiation is widening: North America adopts zero-trust cyber architectures, Asia accelerates smart-city surveillance deployments, and Europe mandates strict data-protection safeguards alongside cross-border intelligence sharing.
Key Report Takeaways
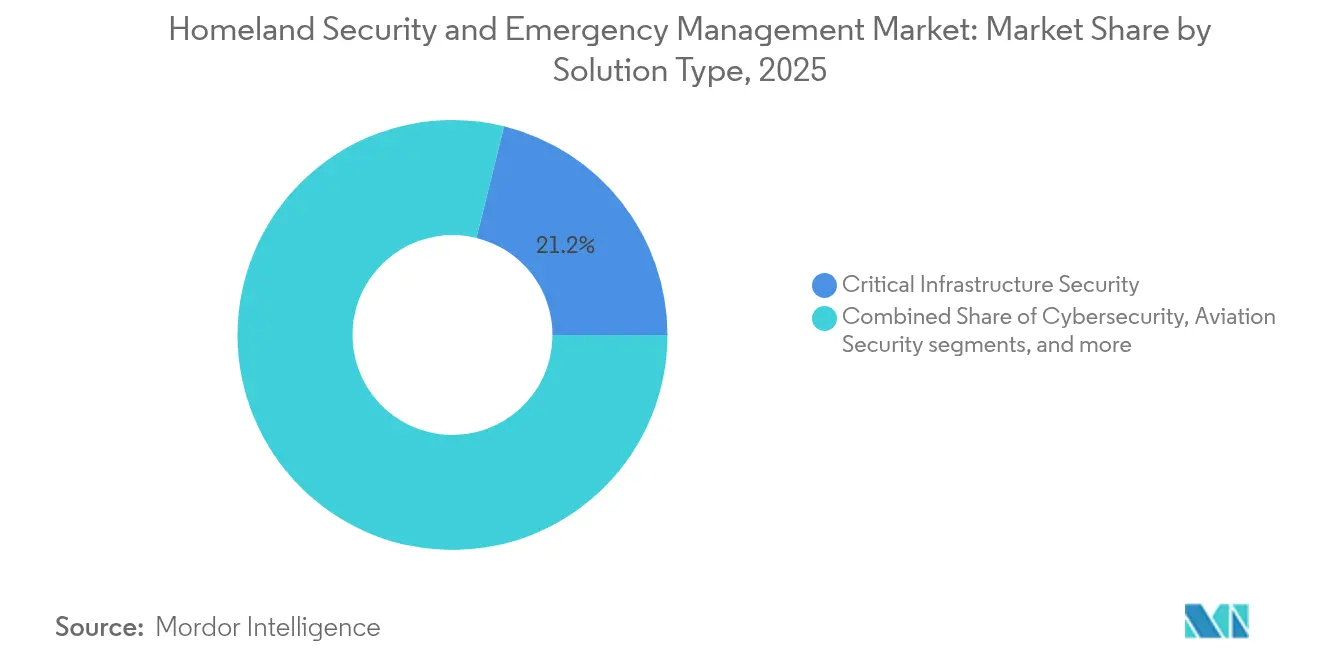
- By solution type, critical infrastructure security held 21.15% of the homeland security and emergency management market share in 2025, while maritime and port security is advancing at an 8.05% CAGR through 2031.
- By technology, cloud security platforms accounted for 22.05% of the homeland security and emergency management market size in 2025; 5G and secure communications top the growth chart at 8.67% CAGR to 2031.
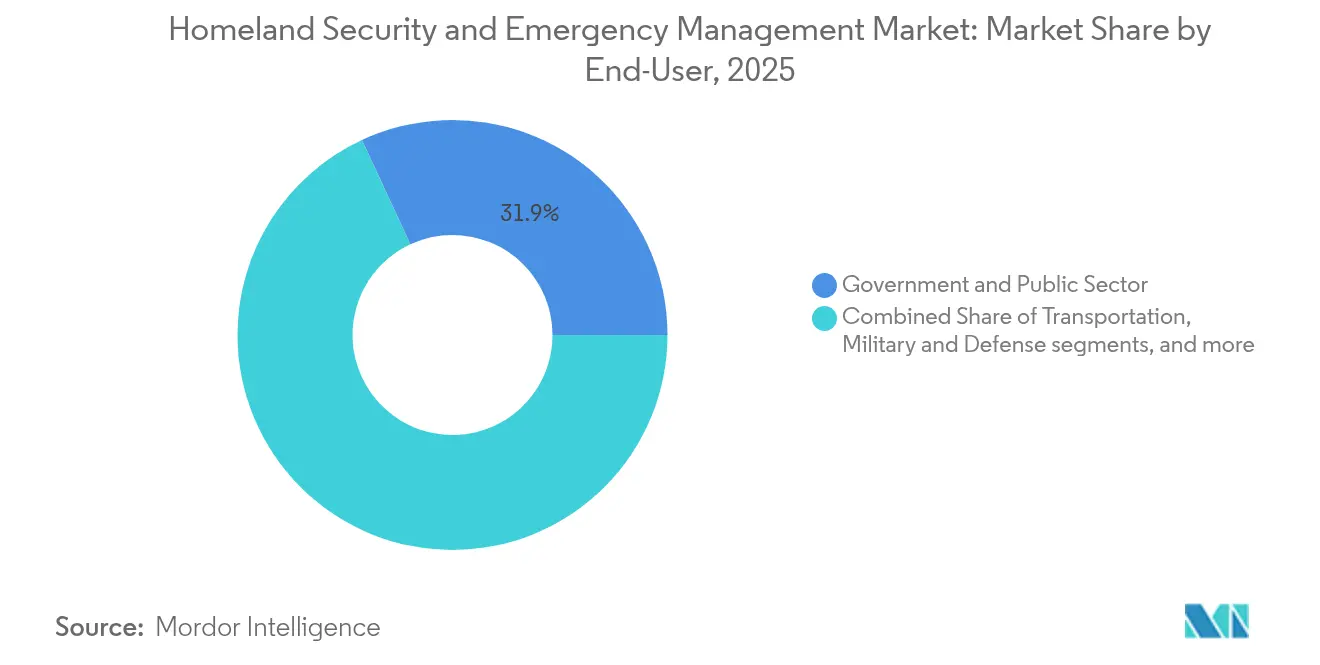
- By end-use vertical, the government and public sector led with 31.92% revenue share in 2025; healthcare and EMS are projected to expand at 9.02% CAGR between 2026 and 2031.
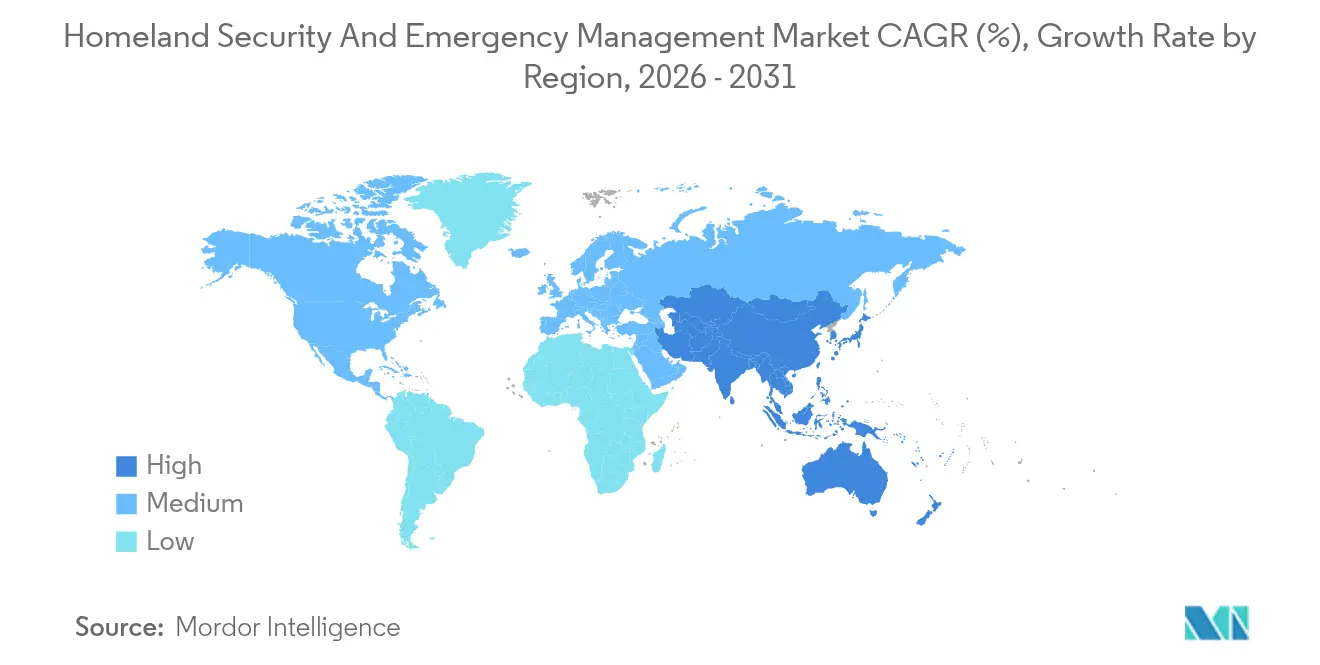
- By geography, North America commanded 36.45% of the homeland security and emergency management market share in 2025, whereas Asia is set to grow fastest at 8.79% CAGR through 2031.
Note: Market size and forecast figures in this report are generated using Mordor Intelligence’s proprietary estimation framework, updated with the latest available data and insights as of 2026.
Market Trends and Insights
Drivers Impact Analysis of Homeland Security And Emergency Management Market*
| Driver Impact Analysis | (~) % Impact on CAGR Forecast | Geographic Relevance | Impact Timeline |
|---|---|---|---|
| Escalating state-sponsored cyberattacks on critical infrastructure | +2.10% | Global, focus on North America and Europe | Short term (≤ 2 years) |
| Mandatory NG911 / EU-112 public warning system compliance deadlines | +1.40% | North America and EU | Medium term (2-4 years) |
| AI-enabled video analytics roll-outs in GCC and Asian megacities | +1.10% | APAC and Middle East | Medium term (2-4 years) |
| 5g private network adoption inside military bases | +1.80% | Global, early in North America | Medium term (2-4 years) |
| Maritime chokepoint disruptions boosting integrated maritime domain awareness spend | +0.80 | Global sea lanes | Short term (≤ 2 years) |
| Climate-driven severe weather events driving mobile emergency operation centers | +1.00 | Coastal regions worldwide | Long term (≥5 years) |
| Source: Mordor Intelligence | |||
Escalating State-Sponsored Cyberattacks on Critical Infrastructure
Nation-state groups have shifted from intelligence gathering to the placement of dormant malware within electric grids, ports, and water systems. The FBI disclosed that Volt Typhoon maintained covert access to US transport networks for over five years and could launch disruptive actions during conflict events.[1] Dan Sabbagh, “Chinese hackers ‘already targeting US infrastructure’, says FBI,” The Guardian, guardian.com Operators are therefore retiring perimeter-centric defenses in favor of zero-trust models that continuously validate every device and user. Energy utilities segment operational-technology networks, while airports apply behavioral analytics to spot suspicious lateral movement. These measures have pushed cybersecurity spending toward identity management, encrypted industrial protocols, and continuous network monitoring. As ransomware overlaps with geopolitically motivated sabotage, insurance premiums have risen, elevating the total cost of inaction and spurring additional safeguards.
Mandatory NG911 / EU-112 Public Warning System Compliance Deadlines
Regulatory calendars in the United States and European Union mandate next-generation emergency call routing, location precision under three meters, and multimedia exchange between dispatchers and first responders. Compliance projects require cloud-based call handling, redundant fiber backbones, and cybersecurity certification aligned with NIST and ETSI standards. Counties already upgraded report lower call abandonment rates and faster triage of multi-casualty events. Vendors supplying IP core services, geospatial analytics, and cyber-hardened radio gateways benefit directly, while system integrators capture extended maintenance contracts. Because public warning systems must interface with private telecom networks, cross-border standards are tightening, accelerating platform convergence across continents.
AI-Enabled Video Analytics Roll-outs in GCC and Asian Megacities
Smart-city programs in Dubai, Riyadh, and Singapore now treat proactive threat detection as vital to urban resilience. Municipal command centers ingest feeds from thousands of cameras, drones, and fixed sensors, applying computer vision to flag abandoned objects or crowd anomalies within seconds. The US Department of Homeland Security echoed this shift by deploying automated target recognition to detect prohibited items in travel lanes.[2] US Department of Homeland Security, “Roles and Responsibilities Framework for Artificial Intelligence in Critical Infrastructure,” dhs.govAI modules reduce false alarms, freeing officers for high-value tasks. Edge processing inside cameras limits bandwidth needs and protects privacy by transmitting only metadata. As accuracy climbs across demographics, municipalities negotiate usage boundaries with civil-society groups to balance safety and civil liberties.
5G Private Network Adoption Inside Military Bases
Dedicated 5G cells installed at training grounds and logistics hubs support secure, low-latency video from unmanned ground vehicles and rapid sensor data exchange within the Joint All-Domain Command and Control framework. The US 2024 National Defense Authorization Act allocated USD 179 million for open-RAN pilot sites, mandating that spectrum be reconfigurable to minimize jamming risk.[3] Jared Keller, “DoD Spending Plan Gives Boost to 5G Research,” Military Embedded Systems, militaryembedded.com Zero-trust principles govern each connection, while post-quantum cryptography pilots aim to future-proof mission data. Similar initiatives appear in Australia, Japan, and NATO training ranges, boosting demand for ruggedized small cells, secure SIM provisioning, and automated spectrum management.
Restraints Impact Analysis of Homeland Security And Emergency Management Market*
| Restraints Impact Analysis | (~) % Impact on CAGR Forecast | Geographic Relevance | Impact Timeline |
|---|---|---|---|
| Fragmented multi-jurisdiction procurement slowing platform standardization | −1.5% | Global, stronger in federal systems | Medium term (2-4 years) |
| Litigation and moratoria on facial-recognition surveillance in EU and US cities | −0.8% | EU, US cities | Short term (≤ 2 years) |
| Cyber-talent shortages creating greater than 20% vacancies in government SOCs | −1.3 % | Developed economies | Medium term (2-4 years) |
| Emerging-economy budget reallocations away from capital-intensive CBRNE systems | −0.5 % | Emerging markets | Short term (≤ 2 years) |
| Source: Mordor Intelligence | |||
Fragmented Multi-Jurisdiction Procurement
Emergency agencies often buy radios, sensors, and analytics platforms under separate grant programs, creating incompatible data schemas obstructing mutual aid. The US Government Accountability Office estimates that eliminating duplicated homeland security contracts could save hundreds of millions. Parallel challenges surface in Europe, where municipal surveillance software can struggle to integrate with national border systems. Vendors must provide middleware that translates between proprietary formats, but the additional engineering cost slows rollout schedules and increases total project price, tempering near-term growth.
Litigation and Moratoria on Facial-Recognition Surveillance
Privacy advocates have secured temporary bans on real-time facial scans in San Francisco, Portland, and several EU capitals. Courts cite concerns over algorithmic bias and mass surveillance. In response, the DHS issued a facial-capture policy that lets US citizens opt out of certain non-law enforcement uses and mandates independent bias testing. While airports and border crossings continue to deploy the technology within narrow use cases, city police agencies delay investments until legal clarity improves. Suppliers are enhancing demographic parity and adding consent management layers, but revenue from broad public-space deployments remains capped in the short term.
*Our forecasts treat driver/restraint impacts as directional, not additive. The impact forecasts reflect baseline growth, mix effects, and variable interactions.
Homeland Security And Emergency Management Market Segment Analysis
By Solution Type:
Critical Infrastructure Remains Anchor, Maritime Gains MomentumCritical infrastructure security generated the largest revenue slice in 2025, underscoring heightened concern over the resilience of electricity, water, and transportation assets. The segment's 21.15% homeland security and emergency management market share arose after publicized attempts to compromise rail signaling and pipeline monitoring networks. Utilities responded by segmenting supervisory control and data acquisition (SCADA) traffic, deploying intrusion detection at substations, and integrating incident-response playbooks with federal fusion centers. This segment's homeland security and emergency management market size is forecast to rise steadily on continued grant allocations, mandatory cyber incident reporting rules, and the incorporation of digital twins that enable predictive maintenance.
Although smaller in absolute terms, maritime and port security are projected to expand at 8.05% CAGR through 2031, reflecting the strategic value of seaborne trade lanes, NATO's Baltic Sentry drone flotilla, and commercial AI systems that flag vessels deviating from declared routes highlight a broader commitment to maritime domain awareness. Ports pair surface radars with underwater acoustics to detect unauthorized divers near fiber cables. As insurance underwriters demand robust monitoring to cover sabotage risks, procurement of autonomous patrol boats and AI-scored risk dashboards accelerates. Additional growth drivers include decarbonization mandates that require new emission-tracking sensors, further widening the solution scope within the homeland security and emergency management market.
Other solution lines, CBRNE detection, perimeter protection, aviation security, and risk and emergency services, add redundancy across the threat spectrum. While their share fluctuates, integrated command-and-control platforms allow agencies to visualize alerts from all subsystems in a single pane, simplifying incident orchestration.



By Technology:
Cloud Dominates Yet 5G Leads Growth CurveCloud security platforms represented 22.05% of the homeland security and emergency management market size in 2025 because agencies prioritized flexible compute environments to ingest growing sensor volumes. FedRAMP-authorized frameworks enable real-time correlation of cyber indicators, while continuous monitoring tools automate compliance reporting. Several state fusion centers reduced average patch cycles from weeks to days after migrating security analytics to the cloud, demonstrating measurable resilience improvements. Vendors differentiate through automated evidence gathering, machine-learning-based anomaly detection, and hardened enclaves for classified workloads. As multicloud adoption rises, secure API gateways and policy-as-code solutions underpin interoperability.
Conversely, 5G and secure communications exhibit the fastest CAGR of 8.67% through 2031. Base commanders cite the need for deterministic latency below 10 milliseconds to support coordinated drone swarms and augmented-reality maintenance. Private network rollouts pair millimeter-wave radios with network-slicing software that isolates mission traffic from commercial users. Edge encryption chips ensure data privacy even if a node is compromised. This upward trajectory positions 5G as a cornerstone for expanding the homeland security and emergency management market size across incident management, telemedicine, and autonomous logistics.
Complementary technologies such as AI, smart sensors, big data analytics, and biometrics reinforce each other. AI engines streamline triage of millions of monthly alerts, while smart sensors reduce blind spots across isolated terrain. As these capabilities mature, integration layers become the competitive battleground rather than individual sensor performance.
By End-Use Vertical:
Government Sustains Leadership, Healthcare AcceleratesGovernment and public sector agencies accounted for 31.92% of 2025 spending. Statutory responsibility for national defense and disaster response guarantees recurring budgets even during economic contractions. Federal cybersecurity executive orders require agencies to adopt zero-trust frameworks, spurring multiyear modernization pipelines. Emergency management operations centers upgrade voice-over-IP dispatch consoles and deploy AI-assisted situation maps that visualize resource allocation in real time. These investments cement the government’s primacy within the homeland security and emergency management market.
Healthcare and emergency medical services are the fastest-rising vertical, projected at 9.02% CAGR. Hospital networks classified as critical infrastructure face ransomware threats that jeopardize patient safety. In response, administrators install network segmentation, biometric access controls for drug dispensaries, and disaster-recovery data vaults. EMS teams equip ambulances with 5G tablets that stream ultrasound images to emergency physicians, cutting triage times. The homeland security and emergency management market size for healthcare further benefits from tele-health expansion and mandates to secure patient data under revised HIPAA security rules.
Industrial facilities, defense installations, and the transportation sector round out demand. Each has distinct risk profiles yet converges on the same underlying need for unified threat visibility and rapid recovery mechanisms.
Geography Analysis
North America Homeland Security and Emergency Management Market
North America led with a 36.45% share in 2025, supported by robust federal appropriations for critical-infrastructure defense and extensive collaboration between agencies and private operators. The Port of Los Angeles blocked 750 million hacking attempts in 2024, illustrating the attack volume shaping purchasing priorities. Zero-trust adoption rates outpace other regions, and grant frameworks such as the Infrastructure Investment and Jobs Act funnel funds toward resilience upgrades.
APAC Homeland Security and Emergency Management Market
Asia-Pacific is the growth engine, expanding at 8.79% CAGR. Rapid urbanization and megacity investments create fertile ground for AI-enabled surveillance, smart evacuation corridors, and resilient telecom backbones. The 2024 Noto Peninsula earthquake exposed gaps in sensor coverage and spurred fast-track procurement of integrated warning platforms. Meanwhile, rising semiconductor fabs across Taiwan and South Korea require strict security perimeters and air-gap cyber defenses, intensifying regional spend.
Europe and Lebanon Homeland Security and Emergency Management Market
Europe maintains a sizeable position through stringent regulatory mandates and joint border-management initiatives. Projects such as the biometric upgrade at Beirut-Rafic Hariri International Airport demonstrate the export of European standards beyond the continent. Funding from the EU Internal Security Fund underpins cross-border data-sharing hubs.
MEA and LATAM Homeland Security and Emergency Management Market
The Middle East continues to direct oil revenues toward layered airport, energy-facility, and public-venue protection systems. Africa and Latin America advance more slowly but prioritize maritime and disaster-response capabilities in coastal cities prone to hurricanes and cyclones.

Regulatory Landscape
Regulation is increasingly steering homeland security and emergency management procurement toward auditable cyber controls, resilient communications, and trusted supply chains across critical infrastructure. In the United States, CISA is implementing the Cyber Incident Reporting for Critical Infrastructure Act of 2022 (CIRCIA), which increases demand for incident intake workflows, evidence preservation, and interoperable reporting tooling across operators and managed security providers. At the state and local level, CISA ties eligibility for State and Local Cybersecurity Grant Program funding to submission of cybersecurity plans by January 30, 2026, reinforcing standardized controls for jurisdictions modernizing SOC operations and public-safety IT.
In Europe, the Critical Entities Resilience (CER) Directive (Directive (EU) 2022/2557) sets cross-sector resilience obligations. Member States are required to identify critical entities by July 17, 2026, which shapes security investments in energy, transport, and banking operators and their vendors. The EU Internal Market Emergency and Resilience Act (Regulation (EU) 2024/2747), operational from October 2024, adds a crisis-management framework that can increase coordination requirements for essential supply and service continuity. Procurement-side restrictions also affect hardware and electronics sourcing for defense-adjacent and critical infrastructure programs, including FY 2026 NDAA-driven restrictions and ongoing FAR rulemaking on covered semiconductor products and services.
Value Chain Analysis
The value chain covers upstream component and software suppliers (sensors, radios, rugged compute, semiconductors, encryption modules, cloud infrastructure, and threat intelligence feeds), as well as primes and platform vendors that integrate command-and-control, analytics, and identity layers for government and regulated operators. Systems integrators and telecom partners then deploy and operate solutions across public-safety networks, border and maritime surveillance, and critical infrastructure sites. Sustainment is delivered through managed services, SOC operations, and long-term maintenance contracts. As demand signals increasingly bundle cyber-physical requirements, integration is shifting toward unified data models, geospatial platforms, and secure API gateways that connect emergency communications, video analytics, and incident management.
Supply chain resilience and assurance have become explicit intermediate steps in delivery, not only procurement checks. DHSs Supply Chain Resilience Center (SCRC) and the White House Council on Supply Chain Resilience are running stress-testing and dependency mapping, including a trilateral SCRC MOU with Australia and the UK focused on critical supply chains. Cyber supply chain risk management is also moving deeper into the stack, as shown by DOE CESER programs that use SBOM and software composition analysis to identify vulnerabilities in energy-sector hardware and software. In April 2026, a Presidential Determination under Defense Production Act Section 303 targeted expanded domestic manufacturing capacity for grid infrastructure equipment (such as transformers and high-voltage transmission components). This underscores how availability of power-system hardware can constrain timelines for security modernization, backup power, and resilient communications deployments.
Competitive Landscape
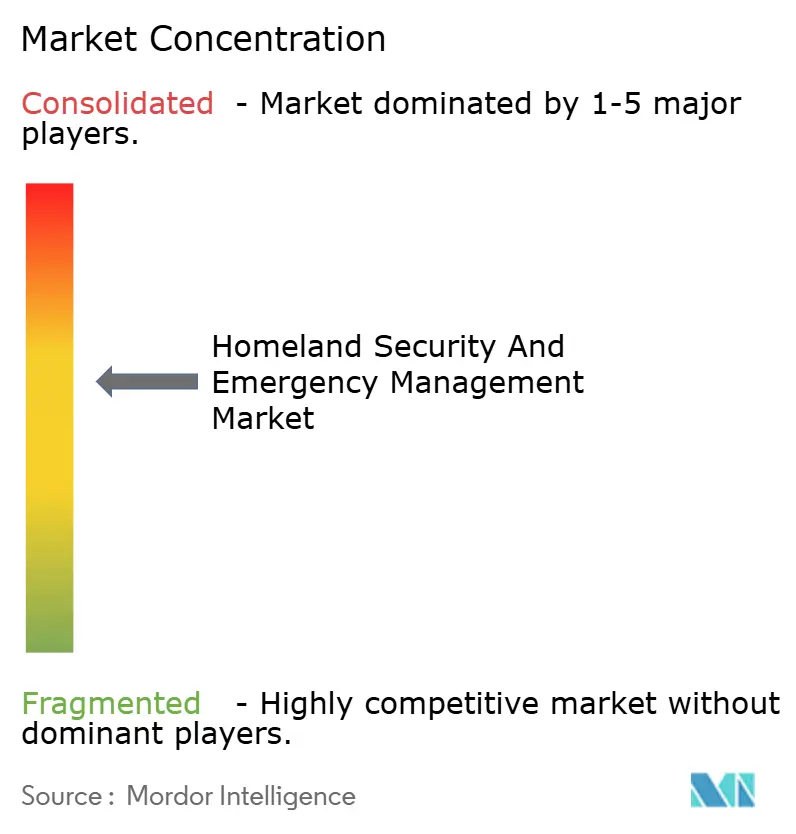
Industry structure is moderately concentrated, with firms like Thales Group, Lockheed Martin Corporation, RTX Corporation, and Northrop Grumman Corporation leveraging decades of program performance and in-house R&D to capture long-cycle contracts. Thales secured EUR 10.8 billion of new orders in the first half of 2024, raising its record backlog to EUR 47 billion and underscoring sustained demand for integrated solutions.[5]Thales Group, “Half-Year 2024 Results,” thalesgroup.com
Strategic partnerships dominate. Cloud hyper-scalers team with radar and missile-defense providers to offer analytics-as-a-service, while telecom carriers bundle 5G private-network services with threat-detection subscriptions. Lockheed Martin’s USD 4.1 billion C2BMC-Next award illustrates how the convergence of space, cyber, and missile-defense drives platform unification.
Niche disruptors add competitive tension. Windward uses maritime behavioral data to deliver early-detection algorithms that flag stealth vessels within minutes. Start-ups focusing on quantum-safe encryption, secure-mesh drones, or deception technology attract venture funding and could displace incumbent modules in multi-vendor stacks.
Pricing pressure remains modest because mission-critical credentials, export controls, and sovereign data requirements limit direct substitution. However, as artificial intelligence models commoditize, value shifts to proprietary threat-intelligence feeds and integration expertise.
Homeland Security And Emergency Management Industry Leaders
Lockheed Martin Corporation
Northrop Grumman Corporation
Thales Group
RTX Corporation
Elbit Systems Ltd.
- *Disclaimer: Major Players sorted in no particular order
Homeland Security And Emergency Management Market Companies Covered in this Report
- Lockheed Martin Corporation
- Northrop Grumman Corporation
- RTX Corporation
- General Dynamics Information Technology, Inc. (General Dynamics Corporation)
- Thales Group
- International Business Machines Corporation (IBM)
- Honeywell International, Inc.
- BAE Systems plc
- Elbit Systems Ltd.
- Cisco Systems, Inc.
- Airbus SE
- Leonardo S.p.A.
- Booz Allen Hamilton, Inc.
- Palantir Technologies Inc.
- Fortinet, Inc.
- Esri Global, Inc.
- MOOG Inc.
- AT&T Inc.
- Accenture plc
Read Analysis of Homeland Security And Emergency Management Companies

Market Opportunities and Future Outlook
Counter-uncrewed aircraft systems (C-UAS) has emerged as a near-term commercialization lane within border security and critical infrastructure protection, supported by large program commitments and vendor wins. In July 2026, AeroVironment received a three-year USD 500 million IDIQ award for the Domestic Shield C-UAS program, and CACI announced SkyValor selection to strengthen drone defense at the US southern border. These announcements point to continued budgeted demand for layered detection, identification, and defeat solutions integrated with command-and-control, creating whitespace for suppliers of mission management software, RF sensing, radar, EO/IR payloads, and interoperability layers that connect fielded sensors to dispatch and incident response workflows.
Resilience modernization is also redirecting spend toward unified early warning, public risk communications, and cross-agency operational awareness platforms. The White House 2026 National Resilience Strategy elevates technology infrastructure upgrades that unify awareness across public health, safety, and key service providers, supporting opportunities for cloud security platforms, geospatial analytics, and data-sharing middleware that reduce fragmentation across jurisdictions. Communications continuity is another practical procurement driver, with the First Responder Network Authority Reauthorization Act of 2026 requiring the FirstNet contractor to submit business continuity and disaster recovery plans within 180 days of enactment, and to re-evaluate every five years, expanding demand for hardened networks, cyber monitoring, and redundant backhaul in public-safety communications stacks.
Recent Industry Developments in Homeland Security And Emergency Management Market
- July 2026: AeroVironment received a three-year USD 500 million IDIQ award to provide counter-uncrewed aircraft systems for the Domestic Shield program. The award reinforces the shift from point solutions toward scalable, programmatic C-UAS procurement with standardized sensor-to-effector architectures. It also increases integration demand for command-and-control software that can fuse radar, RF, and electro-optical inputs across dispersed sites.
- February 2025: The US Department of Homeland Security issued the Generative AI Public Sector Playbook to standardize responsible adoption across agencies. The guidance formalizes governance expectations around data handling, testing, and oversight for operational AI use in security and emergency management. Vendors selling AI-enabled analytics and decision-support tools face stronger requirements for transparency, model risk management, and security controls.
- June 2024: Thales and Frances CEA started a three-year R&D program to build trusted generative AI systems for defense intelligence. The effort highlights investment in sovereign and trusted AI capabilities that can be adapted to homeland-security missions such as intelligence analysis, alert triage, and secure decision support. It also supports procurement interest in privacy-preserving and assurance-focused AI pipelines rather than only higher-performing models.


Homeland Security And Emergency Management Market Report Scope and Research Methodology
Market Definition and Coverage
This market is defined as spend on homeland security and emergency management capabilities used to prevent, detect, respond to, and recover from threats and large incidents. It includes solutions and services that support public safety agencies and mandated critical infrastructure operators.
Scope exclusions: Routine defense procurement for combat missions and purely private enterprise security programs are excluded from this sizing.
Segments Covered in This Report
- By Solution Type
- Critical Infrastructure Security
- CBRNE Detection and Protection
- Perimeter and Physical Security
- Cybersecurity
- Border Security and Immigration Control
- Maritime and Port Security
- Aviation Security
- Risk and Emergency Services
- By Technology
- AI and Machine Learning
- IoT and Smart Sensors
- Big-Data Analytics
- 5G and Secure Communications
- Cloud Security Platforms
- Biometric Identification
- By End-Use Vertical
- Government and Public Sector
- Critical Infrastructure (Energy, Utilities)
- Military and Defense
- Transportation (Aviation, Maritime, Rail)
- Commercial and Industrial Facilities
- Healthcare and Emergency Medical Services
- By Geography
- North America
- United States
- Canada
- Mexico
- Europe
- United Kingdom
- France
- Germany
- Italy
- Rest of Europe
- Asia-Pacific
- China
- India
- Japan
- South Korea
- Rest of Asia-Pacific
- South America
- Brazil
- Argentina
- Rest of South America
- Middle East and Africa
- Middle East
- Saudi Arabia
- United Arab Emirates
- Israel
- Rest of Middle East
- Africa
- South Africa
- Egypt
- Rest of Africa
- Middle East
- North America
Data Sources, Market Sizing, and Validation
Desk Research
Desk research helped set the demand context and clarify what should and should not be counted. We relied on public, non-paywalled sources such as budget documents and procurement portals, national statistics offices, the World Bank and IMF for macro indicators, and trade and customs releases where relevant for major equipment categories. We also reviewed emergency management and public safety materials published by agencies, along with standards and preparedness guidance from bodies such as NIST and FEMA.
To tighten assumptions, we cross-checked solution adoption signals and vendor exposure using company filings, annual reports, investor presentations, reputable press coverage, and contract award announcements. In a few places, paid subscriptions were used for company financial intelligence, patent tracking, and tender visibility so mix and pricing assumptions were not built from a single data trail. These desk sources are illustrative and not exhaustive, and many other references were consulted for data collection, validation, and clarification.
Primary Interviews and Surveys
Primary work was used to confirm what buyers actually procure under homeland security and emergency management budgets, and how spending shifts across prevention, response, and recovery cycles. We spoke with a balanced set of stakeholders across solution providers, system integrators, and user organizations, and we validated regional demand patterns across APAC, EMEA, and the Americas so one geography did not set the global curve. When public data was thin, pricing ranges and deployment mix (new build versus upgrade) were checked again through follow-up conversations.
Distribution of primary research fieldwork respondents
| Company type | Respondent position | Region |
|---|---|---|
| Top tier: 39% | CXOs: 15% | APAC: 51% |
| Mid tier: 45% | Functional/Unit leaders: 37% | EMEA: 31% |
| Smaller Players: 16% | Managers: 48% | Americas: 18% |
Market-Sizing & Forecasting
The sizing model starts with a top-down build where public safety and security spending pools are reconstructed using government budget lines, program allocations, and procurement intensity in major countries, and then they are normalized to comparable categories. Once the demand pool is formed, it is split using practical indicators such as the share of modernization programs, incident response readiness cycles, and the balance between prevention and recovery spend.
We then corroborate totals using selective bottom-up approximations, which include sampled contract values, solution price bands, and volume proxies like installed base refresh and new site rollouts. A few market fingerprints were used as inputs because they tend to move the category in a visible way, including cybersecurity and critical infrastructure funding signals, border and passenger screening throughput, public safety communications upgrades, CBRNE readiness investments, and disaster response and resilience programs tied to storm and wildfire seasons. Where supplier disclosure is limited, we filled gaps by using ranges agreed with interviewees and by anchoring the model to disclosed public contracts rather than assuming full coverage.
For forecasting, scenario analysis was applied around government budget growth, threat intensity, and upgrade cycles, and the final trajectory was checked against expert expectations for software and managed services mix growth. When consensus differed by region, we kept regional curves separate before rolling them up to the global number.
Data Validation & Update Cycle
Validation is done through several passes so the final number is not driven by one assumption. We compare outputs against independent signals like public procurement volumes, major program announcements, and multi-year budget direction, then flag unusual jumps for a second review. If a variance is large, the team re-checks conversion factors, year timing, and any double counting between solutions and services, followed by targeted re-contact with interviewees.
Before sign-off, another analyst reviews key inputs and the logic chain from demand pool to final totals. The report is refreshed annually, and interim updates are made when material events occur that can shift budgets or procurement priorities. Right before delivery, a fresh pass is done so clients receive the latest updated view.
Mordor Intelligence's Homeland Security and Emergency Management Market Sizing Compared With Other Published Estimates
It is normal to see different published market sizes for homeland security and emergency management because the label can be stretched in different directions. The biggest differences usually come from what is counted as homeland security versus broader defense and public sector IT, how services are treated, and which year and currency conversion choices are used.
Some published figures fold in broad national security, defense platforms, and wide public sector digital transformation spend. In Mordor Intelligence, the count is limited to integrated prevention, response, and recovery programs tied to civilian protection, critical infrastructure, and digital assets, and it excludes routine defense procurement and private-only security projects.
Benchmark comparison
| Source | Market Size | Gaps in Research Methodology |
|---|---|---|
| Mordor Intelligence | USD 4.09 B (2026) | |
| Global Consultancy A | USD 739.33 B (2026) | Uses a much wider spend universe that appears to include large defense-adjacent programs and broad homeland security portfolios across many public systems, so the total moves closer to overall national security and public sector technology budgets. |
| Industry Publisher B | USD 846.00 B (2025) | Represents the category as a large aggregated solutions market with extensive technology buckets and upgrade cycles, which can double count enabling IT layers and include general surveillance and security spend not strictly tied to emergency management programs. |
The spread is mainly explained by scope width and how adjacent defense and general public sector technology spend is treated. By keeping the demand pool tied to identifiable prevention, response, and recovery programs, and then cross-checking with procurement and upgrade signals, our estimate stays easier to trace and repeat year over year.


Key Questions Answered in the Report
What is the current Homeland Security and Emergency Management Market size?
The homeland security and emergency management market was valued at USD 4.09 billion in 2026 and is on track to reach USD 5.77 billion by 2031, reflecting a 7.12% CAGR.
Which region leads spending?
North America holds the largest share at 36.45%, driven by federal cybersecurity and critical-infrastructure programs.
Which segment is expanding fastest?
Maritime and port security shows the highest growth rate, projected at 8.05% CAGR between 2026-2031 due to heightened maritime-infrastructure threats.
Why are cloud platforms important to homeland security?
Cloud security platforms enable real-time sharing of threat intelligence, automated compliance, and scalable analytics, making them the largest technology segment at 22.05% share.
How will 5G influence emergency management?
Private 5G networks provide low-latency, high-reliability links for drones, sensors, and field medics, underpinning the fastest-growing technology segment at 8.67% CAGR.
Page last updated on:


 Your data is secure and never sold or shared.


