
High-Yield Bond Market Size and Share
Market Overview
| Study Period | 2021 - 2032 |
|---|---|
| Market Size (2027) | USD 2.5 Trillion |
| Market Size (2032) | USD 3.10 Trillion |
| Growth Rate (2027 - 2032) | 4.30 % |
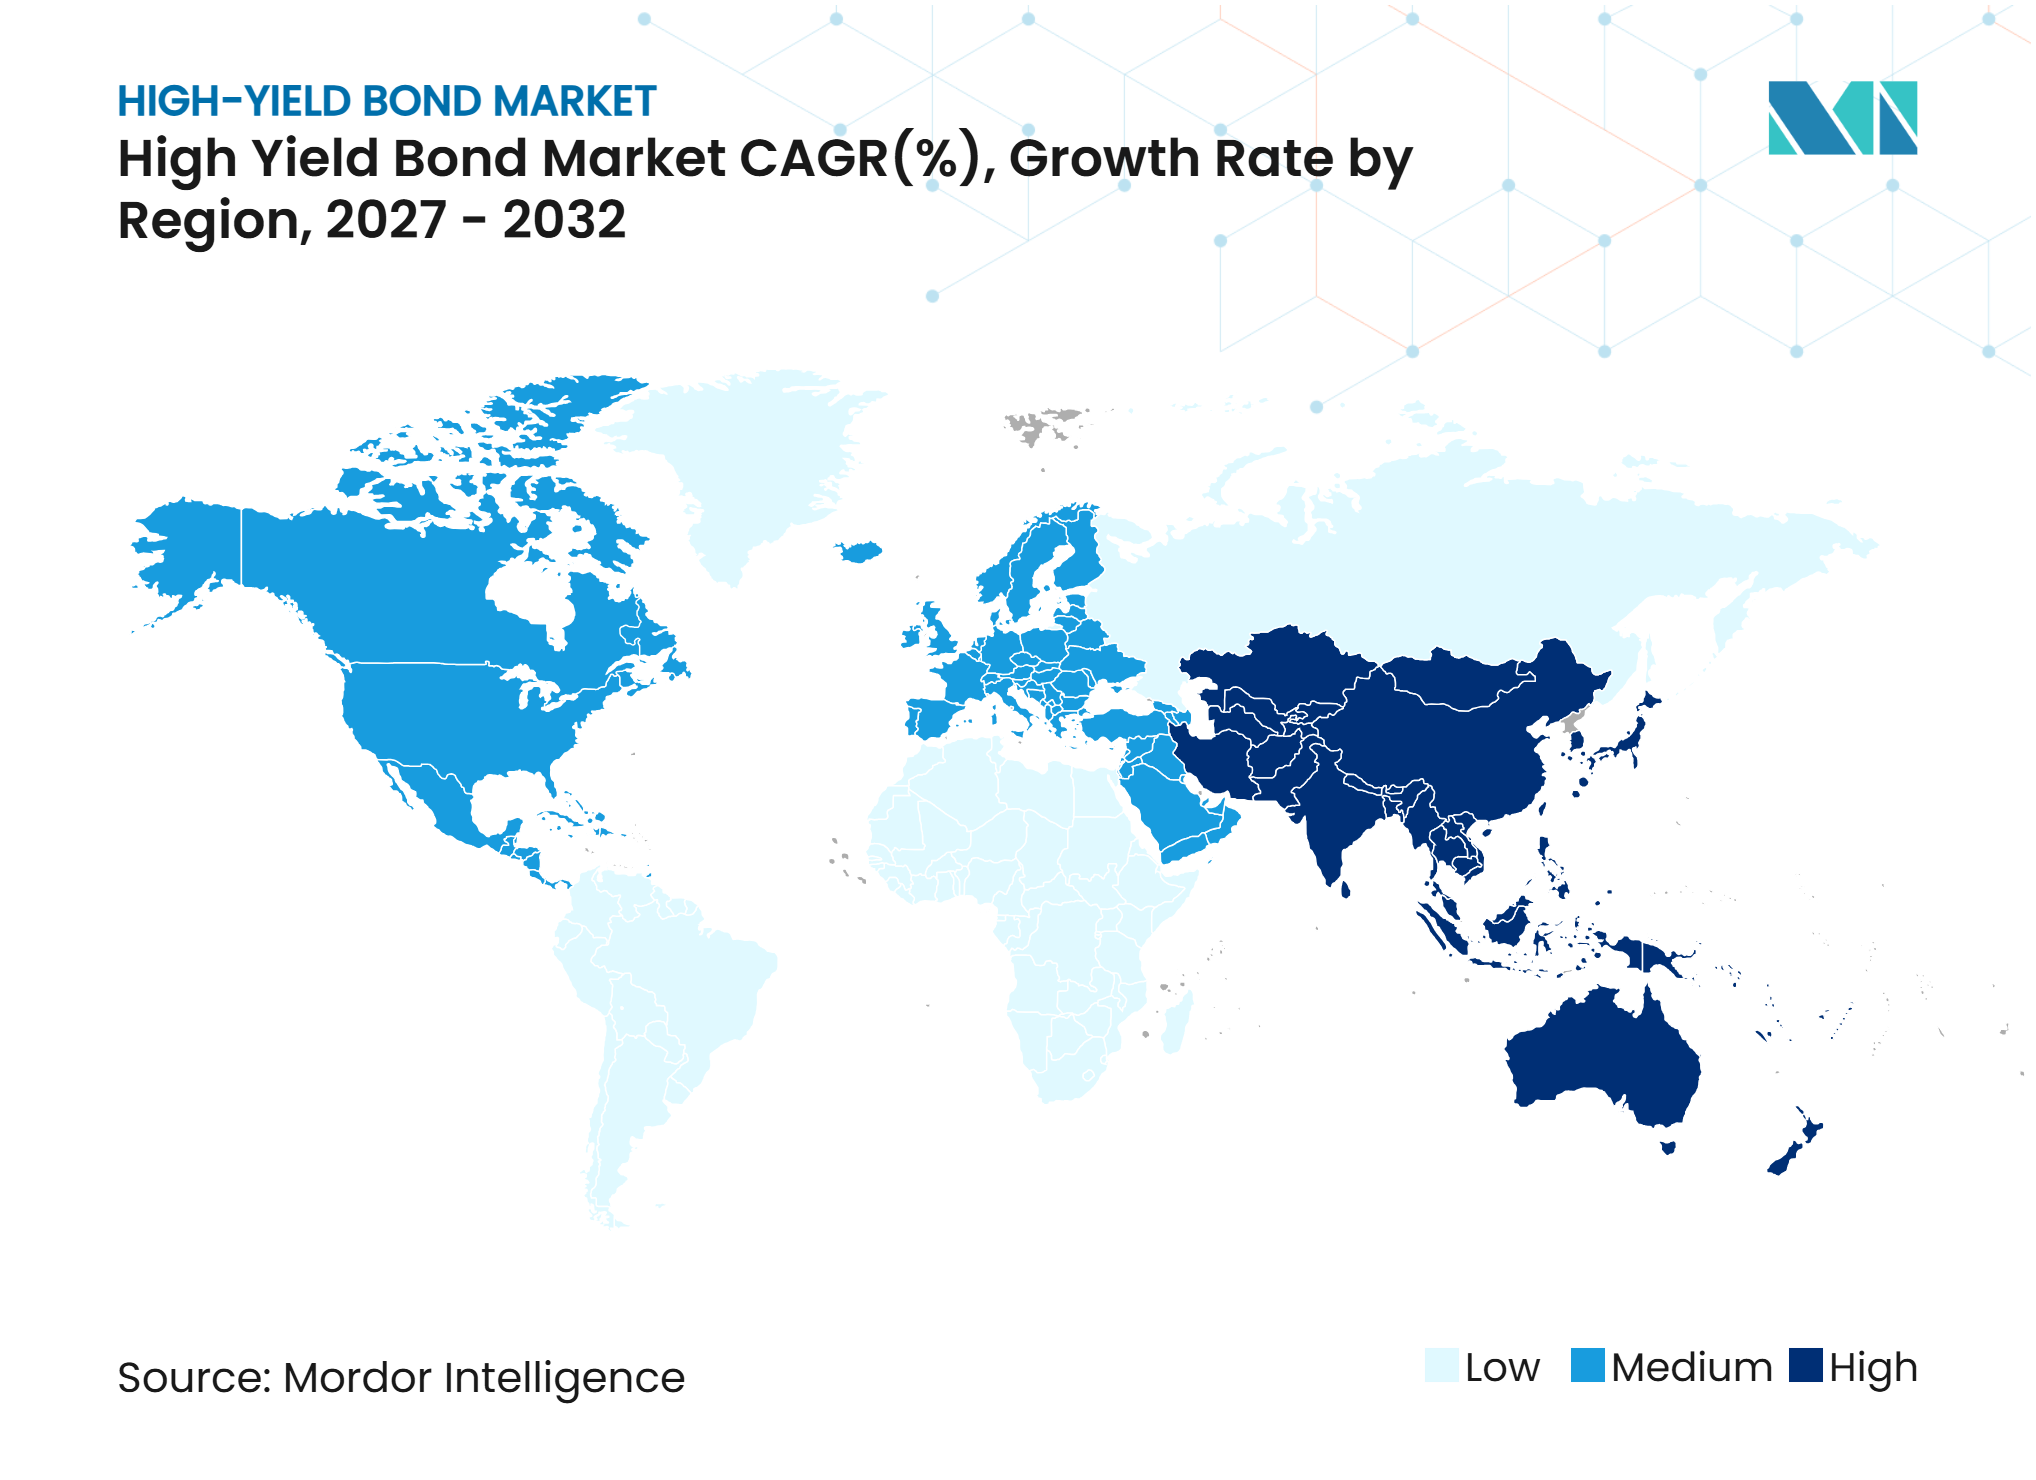
| Fastest Growing Market | Asia-Pacific |
| Largest Market | North America |
| Market Concentration | Low |
Major Players *Disclaimer: Major Players sorted in no particular order Image © Mordor Intelligence. Reuse requires attribution under CC BY 4.0. | |
High-Yield Bond Market Analysis by Mordor Intelligence
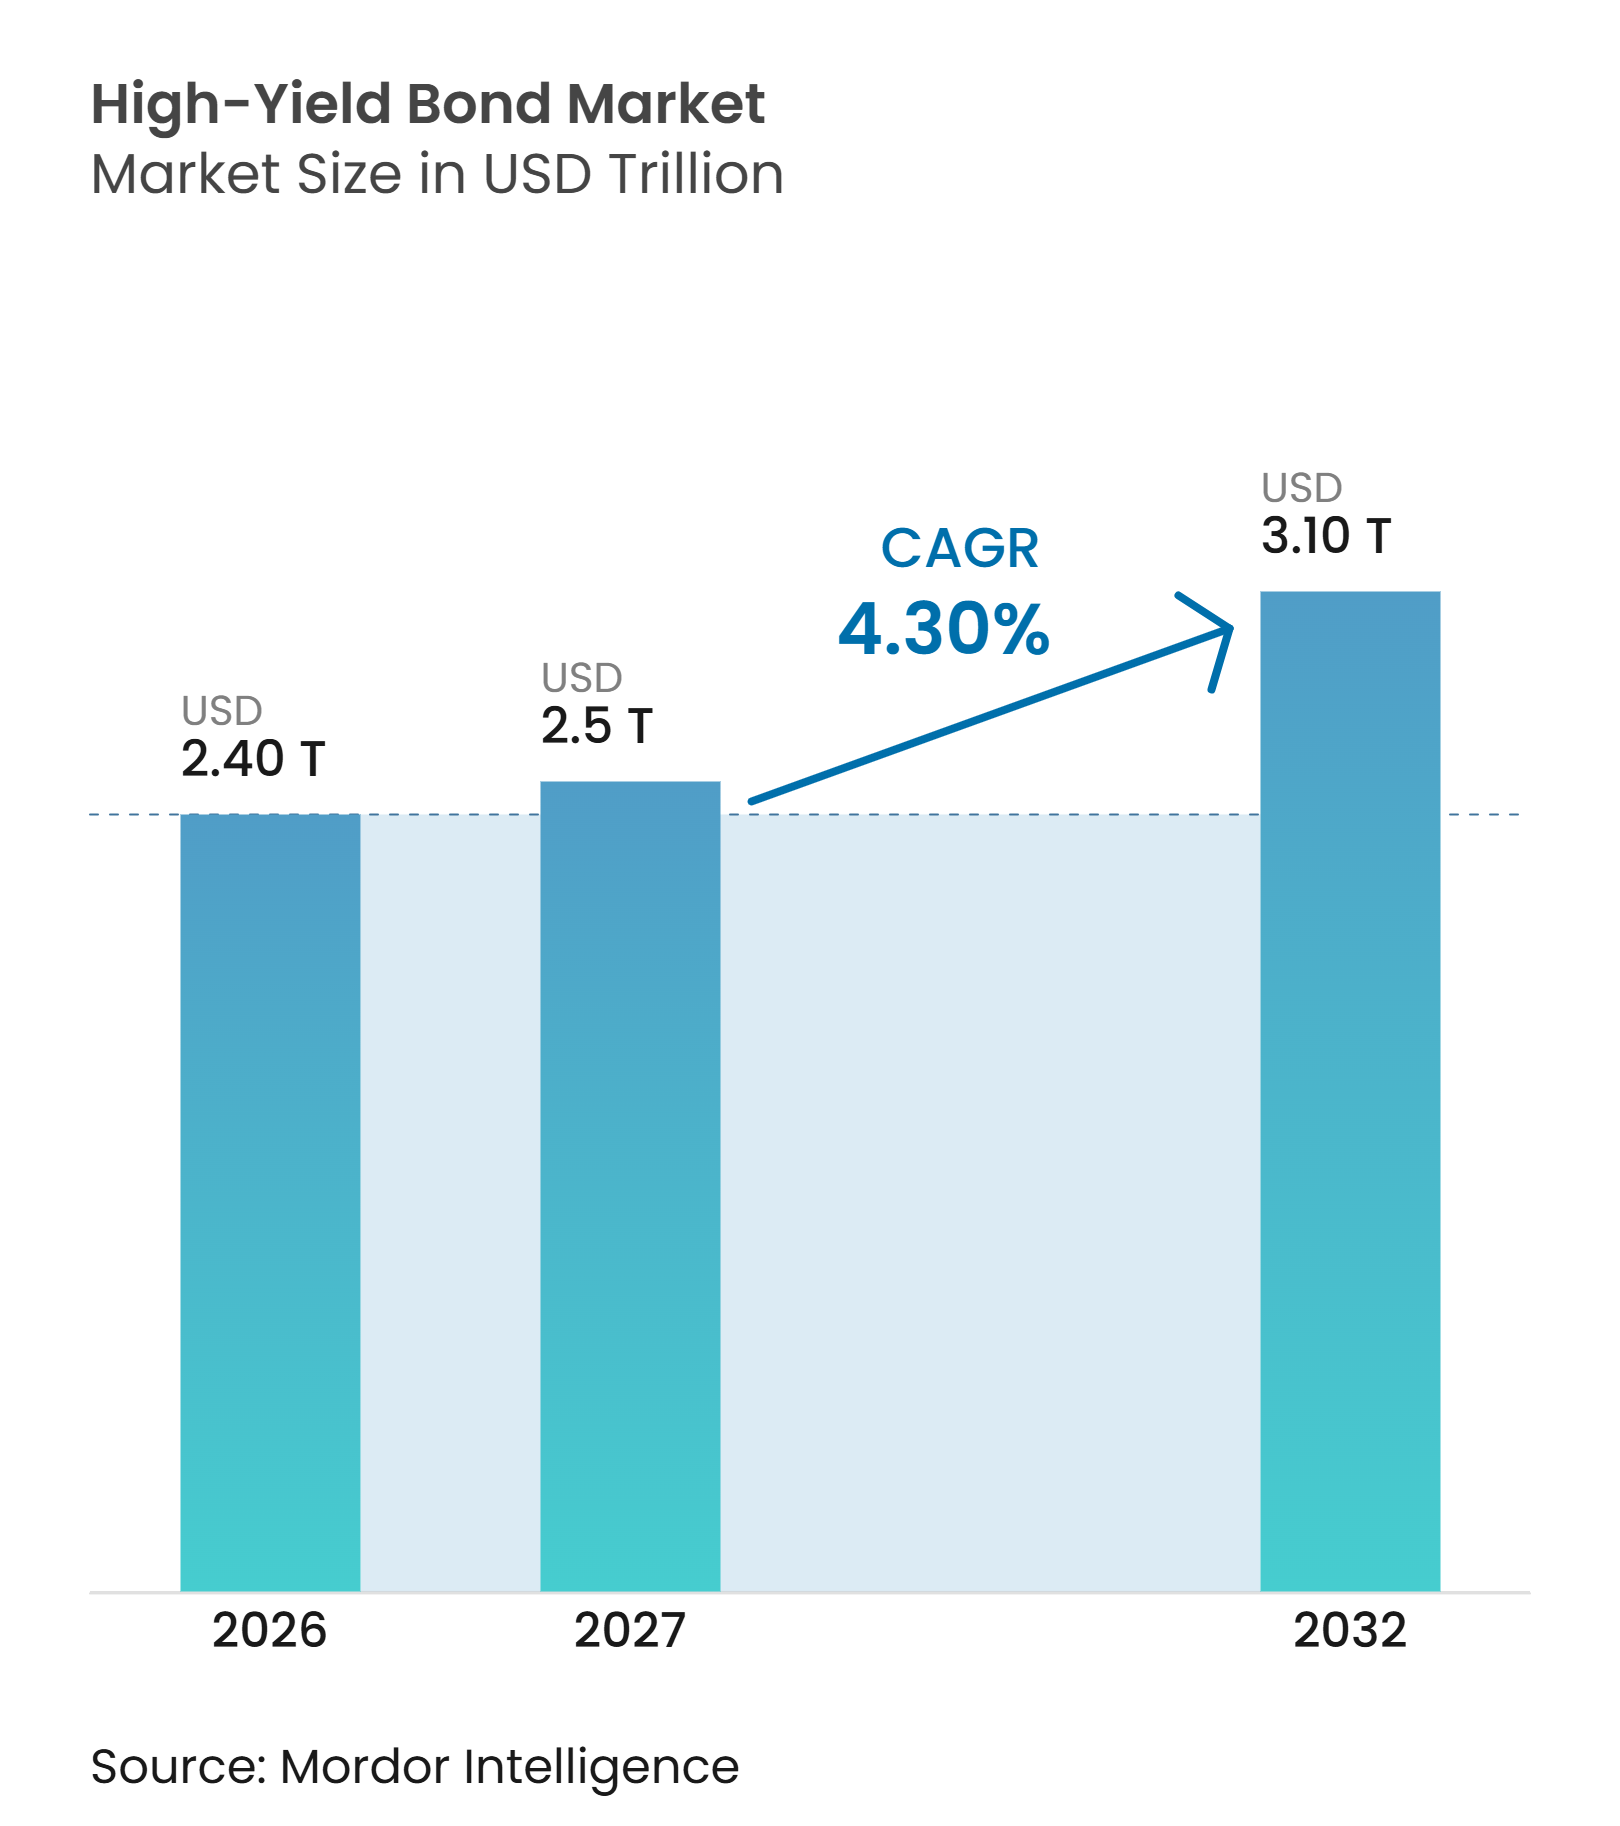
The High Yield Bond Market size is expected to grow from USD 2.40 trillion in 2026 to USD 2.5 trillion in 2027 and is forecast to reach USD 3.10 trillion by 2032 at 4.30% CAGR over 2027-2032.
Institutional investors continue to seek income above investment-grade alternatives, while refinancing needs keep the issuance pipeline active. The high-yield bond market is also gaining support from data center financing, as operators use speculative-grade debt to fund facilities backed by long-term hyperscaler leases. Credit conditions remain uneven because strong demand and lower headline defaults coexist with greater stress among lower-rated issuers. Private credit competes for some transactions, but public bonds retain a role in larger financing needs, transparent pricing, and broad institutional distribution. The high-yield bond market will therefore depend on disciplined credit selection, especially as refinancing costs reset and the maturity wall moves toward 2028 to 2032.
Key Report Takeaways
- By issuer type, non-financial corporates captured 78.2% of the high-yield bond market share in 2026, while emerging market sovereign and quasi-sovereign bonds are projected to grow at a 6.6% CAGR through 2032.
- By credit rating, BB-rated bonds held 59.6% of the high-yield bond market share in 2026, while CCC-rated bonds and below are projected to grow at a 5.2% CAGR through 2032.
- By remaining time to maturity, bonds with 1 year to less than 5 years captured 47.3% of the high-yield bond market share in 2026, while the 5 years to less than 10 years category is projected to grow at a 5.4% CAGR through 2032.
- By seniority and security, senior unsecured bonds accounted for 58.1% of the high-yield bond market share in 2026, while senior secured bonds are projected to grow at a 6.1% CAGR through 2032.
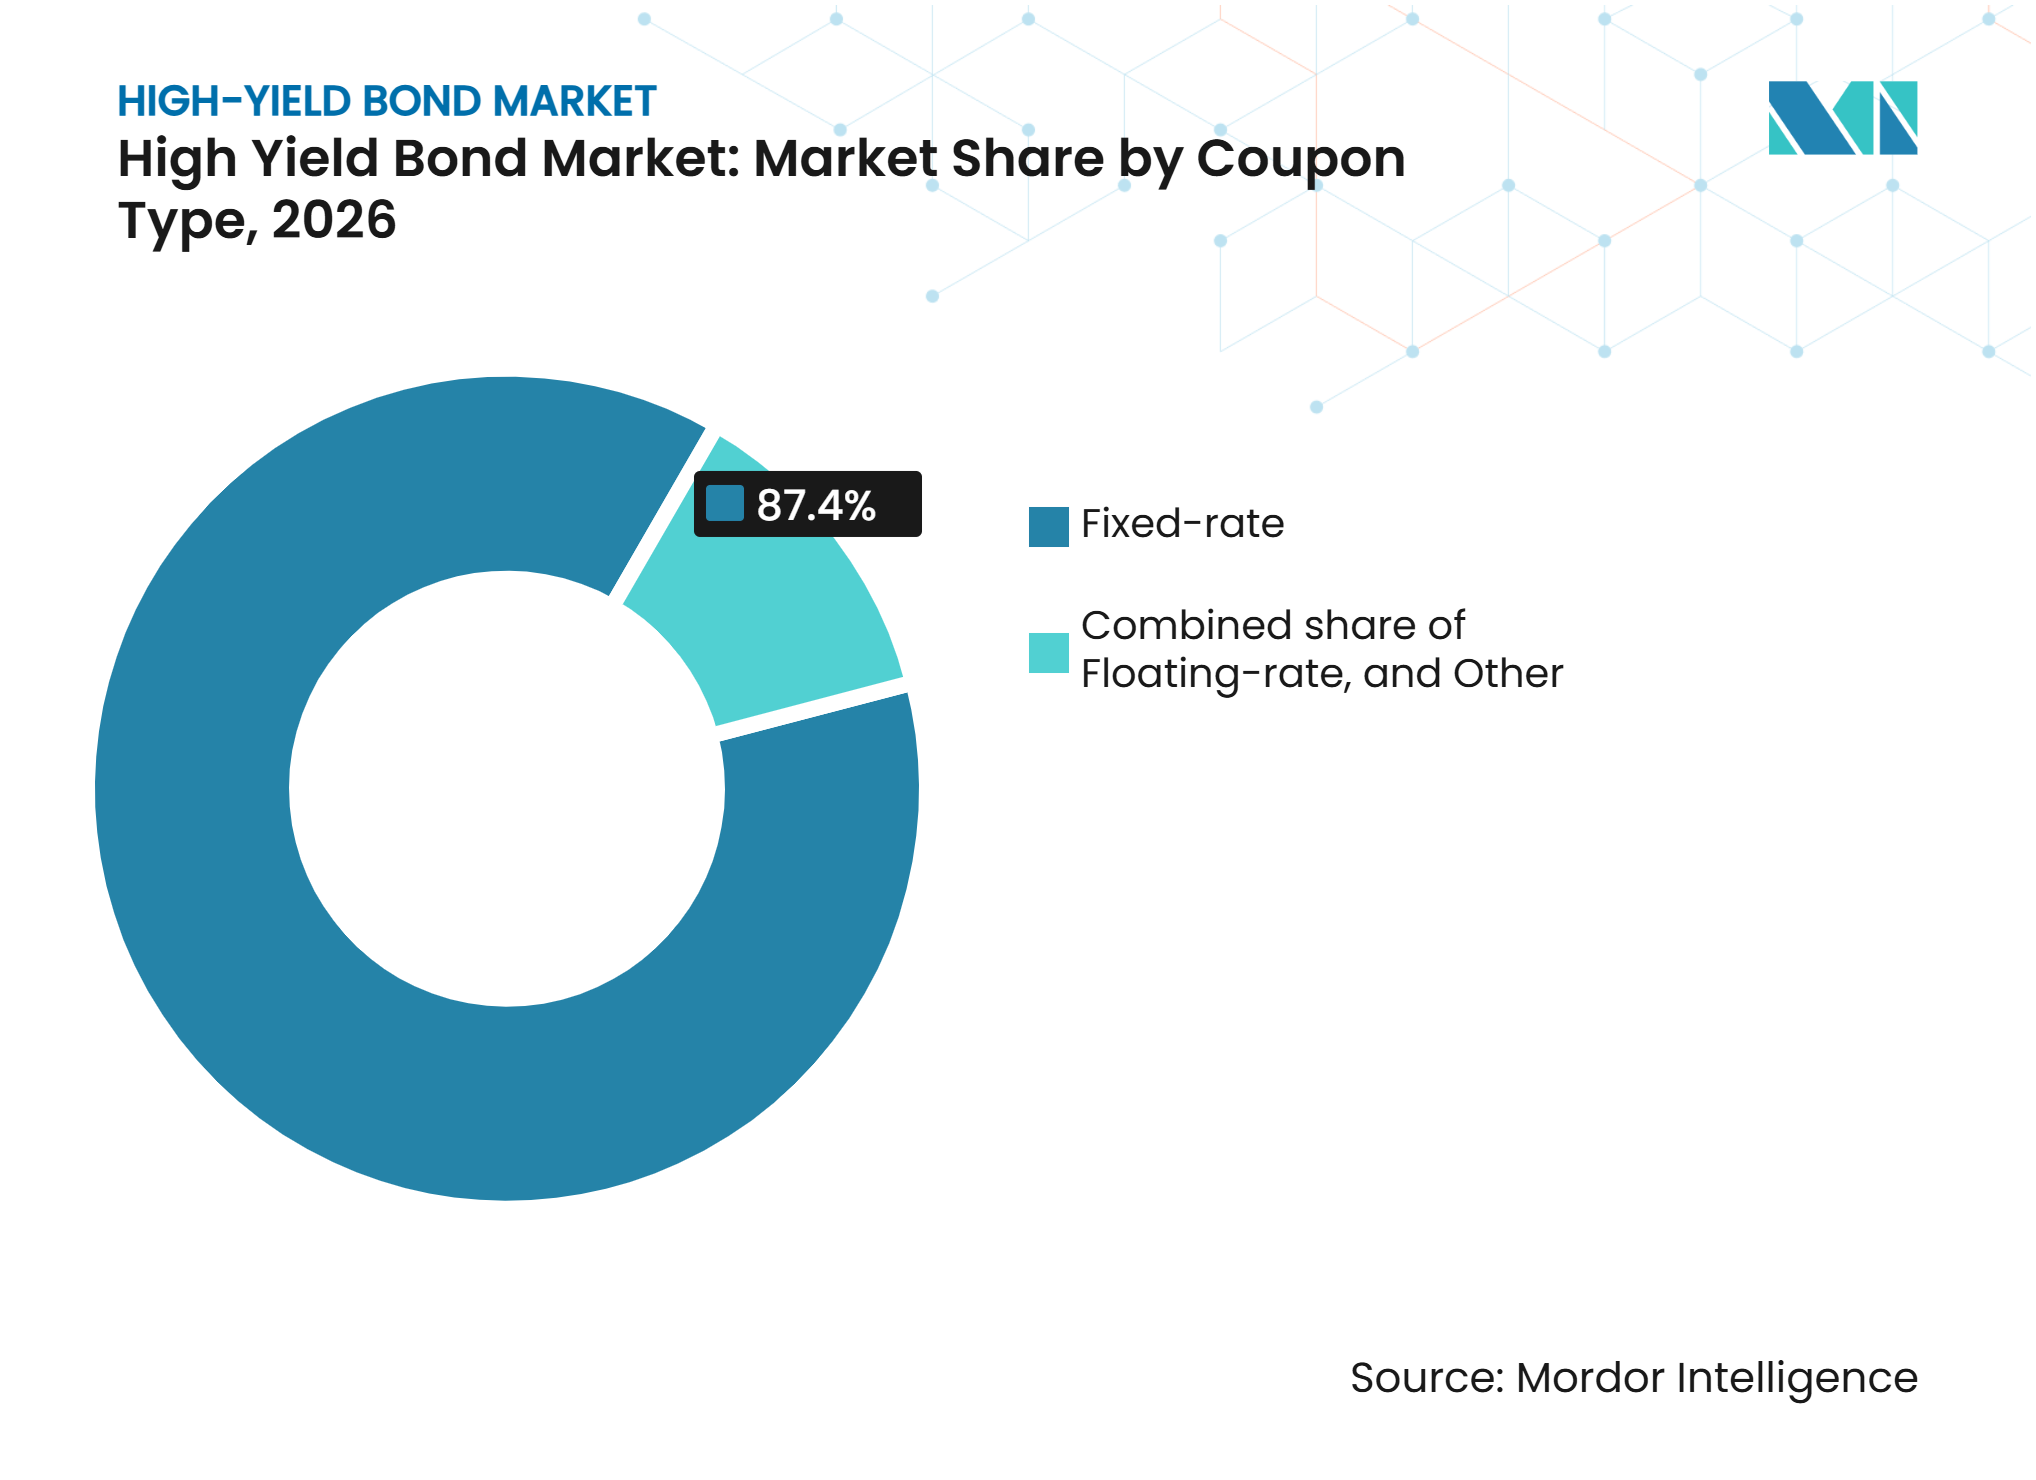
- By coupon type, fixed-rate bonds held 87.4% of the high-yield bond market share in 2026, while floating-rate bonds are projected to grow at a 7.2% CAGR through 2032.
- By currency, USD-denominated bonds captured 69.6% of the high-yield bond market share in 2026, while the other-currency segment is projected to grow at a 5.8% CAGR through 2032.
- By geography, North America held 59.7% of the high-yield bond market share in 2026, while Asia-Pacific is projected to grow at a 6.9% CAGR through 2032.
Note: Market numbers in this report are based on Mordor Intelligence's proprietary estimation framework, which combines nine months of actuals with Q4 projections for base year 2026.
Market Trends and Insights
Drivers Impact Analysis of High-Yield Bond Market*
| Driver | (~) % Impact on CAGR Forecast | Geographic Relevance | Impact Timeline |
|---|---|---|---|
| Institutional Demand for High-Yield Income | +1.1% | Global | Medium term (2-4 years) |
| Corporate Debt Refinancing and Maturity Management | +0.9% | North America and Europe | Short term (≤ 2 years) |
| AI Infrastructure and Data-Center Financing Needs | +0.7% | North America, with spillover to Asia-Pacific | Short term (≤ 2 years) |
| Recovery in Mergers, Acquisitions, and Leveraged Buyouts | +0.6% | North America and Europe | Medium term (2-4 years) |
| Improved Credit Quality and Market Access for Eligible Issuers | +0.4% | Global | Long term (≥ 4 years) |
| Attractive Fixed-Rate Financing Relative to Alternative Funding Channels | +0.3% | Global | Long term (≥ 4 years) |
| Source: Mordor Intelligence | |||
Institutional Investor Demand for High-Yield Income
Institutional demand remains an important support for the high-yield bond market because pension plans, insurers, and multi-asset portfolios need income beyond investment-grade securities. The United States primary credit market is operating at its most competitive level on record, based on Barclays’ review of more than 1 million investor orders since 2017, and oversubscription has reduced new-issue concessions. In June 2025, J.P. Morgan Asset Management launched the JPMorgan Active High Yield ETF with a USD 2 billion CalPERS investment, which the company described as the largest active ETF launch on record. Record collateralized loan obligation issuance also channels capital toward high-yield credit and supports demand during periods of market volatility. The median investment-bank forecast for United States high-yield total returns in 2026 is 6.2%, with forecasts ranging from 5% to 8.5%[1]. This demand base supports issuance, but it does not remove the need to distinguish between higher-quality BB and stressed CCC credits.
Corporate Debt Refinancing and Maturity Management
Refinancing has dominated supply for 3 consecutive years and remains a key driver for the high-yield bond market. The OECD reported that 31% of outstanding non-investment-grade debt must be refinanced from 2026 to 2028, and 67% of that debt carries coupons of 6% or less. Refinancing represented 72% of European high-yield deal proceeds in 2025 and 50% in the first quarter of 2026, which shows that issuers are addressing maturities before pressure peaks[2]. Early refinancings extend maturities into 2028 to 2032, concentrating a later maturity wall that could sustain issuance during the forecast period. BB- and B-rated borrowers with market access have been extending maturities, while lower-rated companies face larger coupon resets and more limited access to capital. This contrast gives active managers a larger role in assessing balance-sheet resilience and refinancing capacity.
AI Infrastructure and Data-Center Financing Needs
Data-center construction has created a new issuance channel for the high-yield bond market. United States AI-related high-yield issuance reached USD 26.6 billion in the first 4 months of 2026, more than twice the full-year 2025 total. Meridian Arc Holdco raised a USD 5.7 billion high-yield bond in April 2026, drawing nearly USD 20 billion in orders to finance two Indiana data centers. Legal & General Asset Management estimated that data centers could represent 5% to 10% of United States high-yield supply in 2026. Triple-net lease structures with investment-grade hyperscaler tenants are helping lower-rated issuers obtain institutional funding at tighter spreads. J.P. Morgan served as lead bookrunner on Hut 8’s USD 4.25 billion Beacon Point senior secured notes offering in June 2026, demonstrating investor demand for secured AI infrastructure structures[3].
Recovery in Mergers, Acquisitions, and Leveraged Buyouts
Mergers, acquisitions, and leveraged buyouts are rebuilding after several years of lower activity caused by valuation differences and sponsor caution. By February 2026, banks were working on USD 100 billion of leveraged-buyout debt, with 3 quarters of that amount actively being syndicated[4]. Barclays projected USD 100 billion to USD 120 billion of merger-and-acquisition financing and USD 70 billion to USD 90 billion of leveraged-buyout issuance in 2026. The high yield bond market is likely to receive a greater share of larger cross-border transactions, while smaller sponsors continue to use direct lenders. United States merger-and-acquisition-related loan issuance increased 9% in 2025 to USD 142 billion, with 46 deals above USD 1 billion, compared with 36 in 2024. This pattern favors larger credits that can access broad syndicated debt markets and can support higher-quality new supply.
Restraints Impact Analysis of High-Yield Bond Market*
| Restraint | (~) % Impact on CAGR Forecast | Geographic Relevance | Impact Timeline |
|---|---|---|---|
| Rising Defaults and Deteriorating Creditworthiness Among Lower-Rated Issuers | -1.1% | Global | Short term (≤ 2 years) |
| Elevated Borrowing Costs and Adverse Interest-Rate Conditions | -0.8% | North America and Europe | Medium term (2-4 years) |
| Covenant Erosion and Liability Management Risks | -0.5% | North America, with spillover to Europe | Medium term (2-4 years) |
| Competition from Private Credit and Leveraged Loan Financing | -0.7% | Global | Long term (≥ 4 years) |
| Source: Mordor Intelligence | |||
Rising Defaults and Deteriorating Creditworthiness Among Lower-Rated Issuers
Default risk is concentrated in the lowest-rated part of the high-yield bond market rather than spread evenly across issuers. Moody’s placed the 1-year expected default probability for United States high-yield companies at 3.2% in the first quarter of 2026, while CCC-rated issuers and below faced default rates of 14.2% to 18.6%. Distressed exchanges accounted for 65% of corporate defaults in 2025, which means reported default rates may not capture all underlying credit weakness. In Europe, the trailing 12-month speculative-grade bond default rate reached 4% at the end of 2025 before easing to 2.6% in the second quarter of 2026, following 31 downgrades and 13 upgrades in the first quarter. Weaker covenant protection can also reduce recoveries on unsecured bonds, increasing loss risk for sub-B investors. The difference between resilient BB borrowers and distressed CCC issuers makes issuer-level credit analysis more consequential.
Elevated Borrowing Costs and Adverse Interest-Rate Conditions
Borrowing costs remain above the levels that prevailed when much of the current high-yield debt stock was issued in 2020 and 2021. The OECD found that 67% of non-investment-grade debt maturing from 2026 to 2028 has coupons of 6% or less, so refinancing can redirect cash from investment toward interest payments. PIMCO indicated that coupons on maturing debt could double for B- and CCC-rated borrowers. Higher interest expense constrains free cash flow and limits opportunities for credit-profile improvement at highly leveraged companies. Tighter spreads do not fully offset the all-in cost of borrowing for lower-rated issuers. These conditions can limit market access for sub-BB borrowers and favor companies with stronger balance sheets, secured collateral, or earlier refinancing plans.
*Our forecasts treat driver/restraint impacts as directional, not additive. The impact forecasts reflect baseline growth, mix effects, and variable interactions.
High-Yield Bond Market Segment Analysis
By Issuer Type:
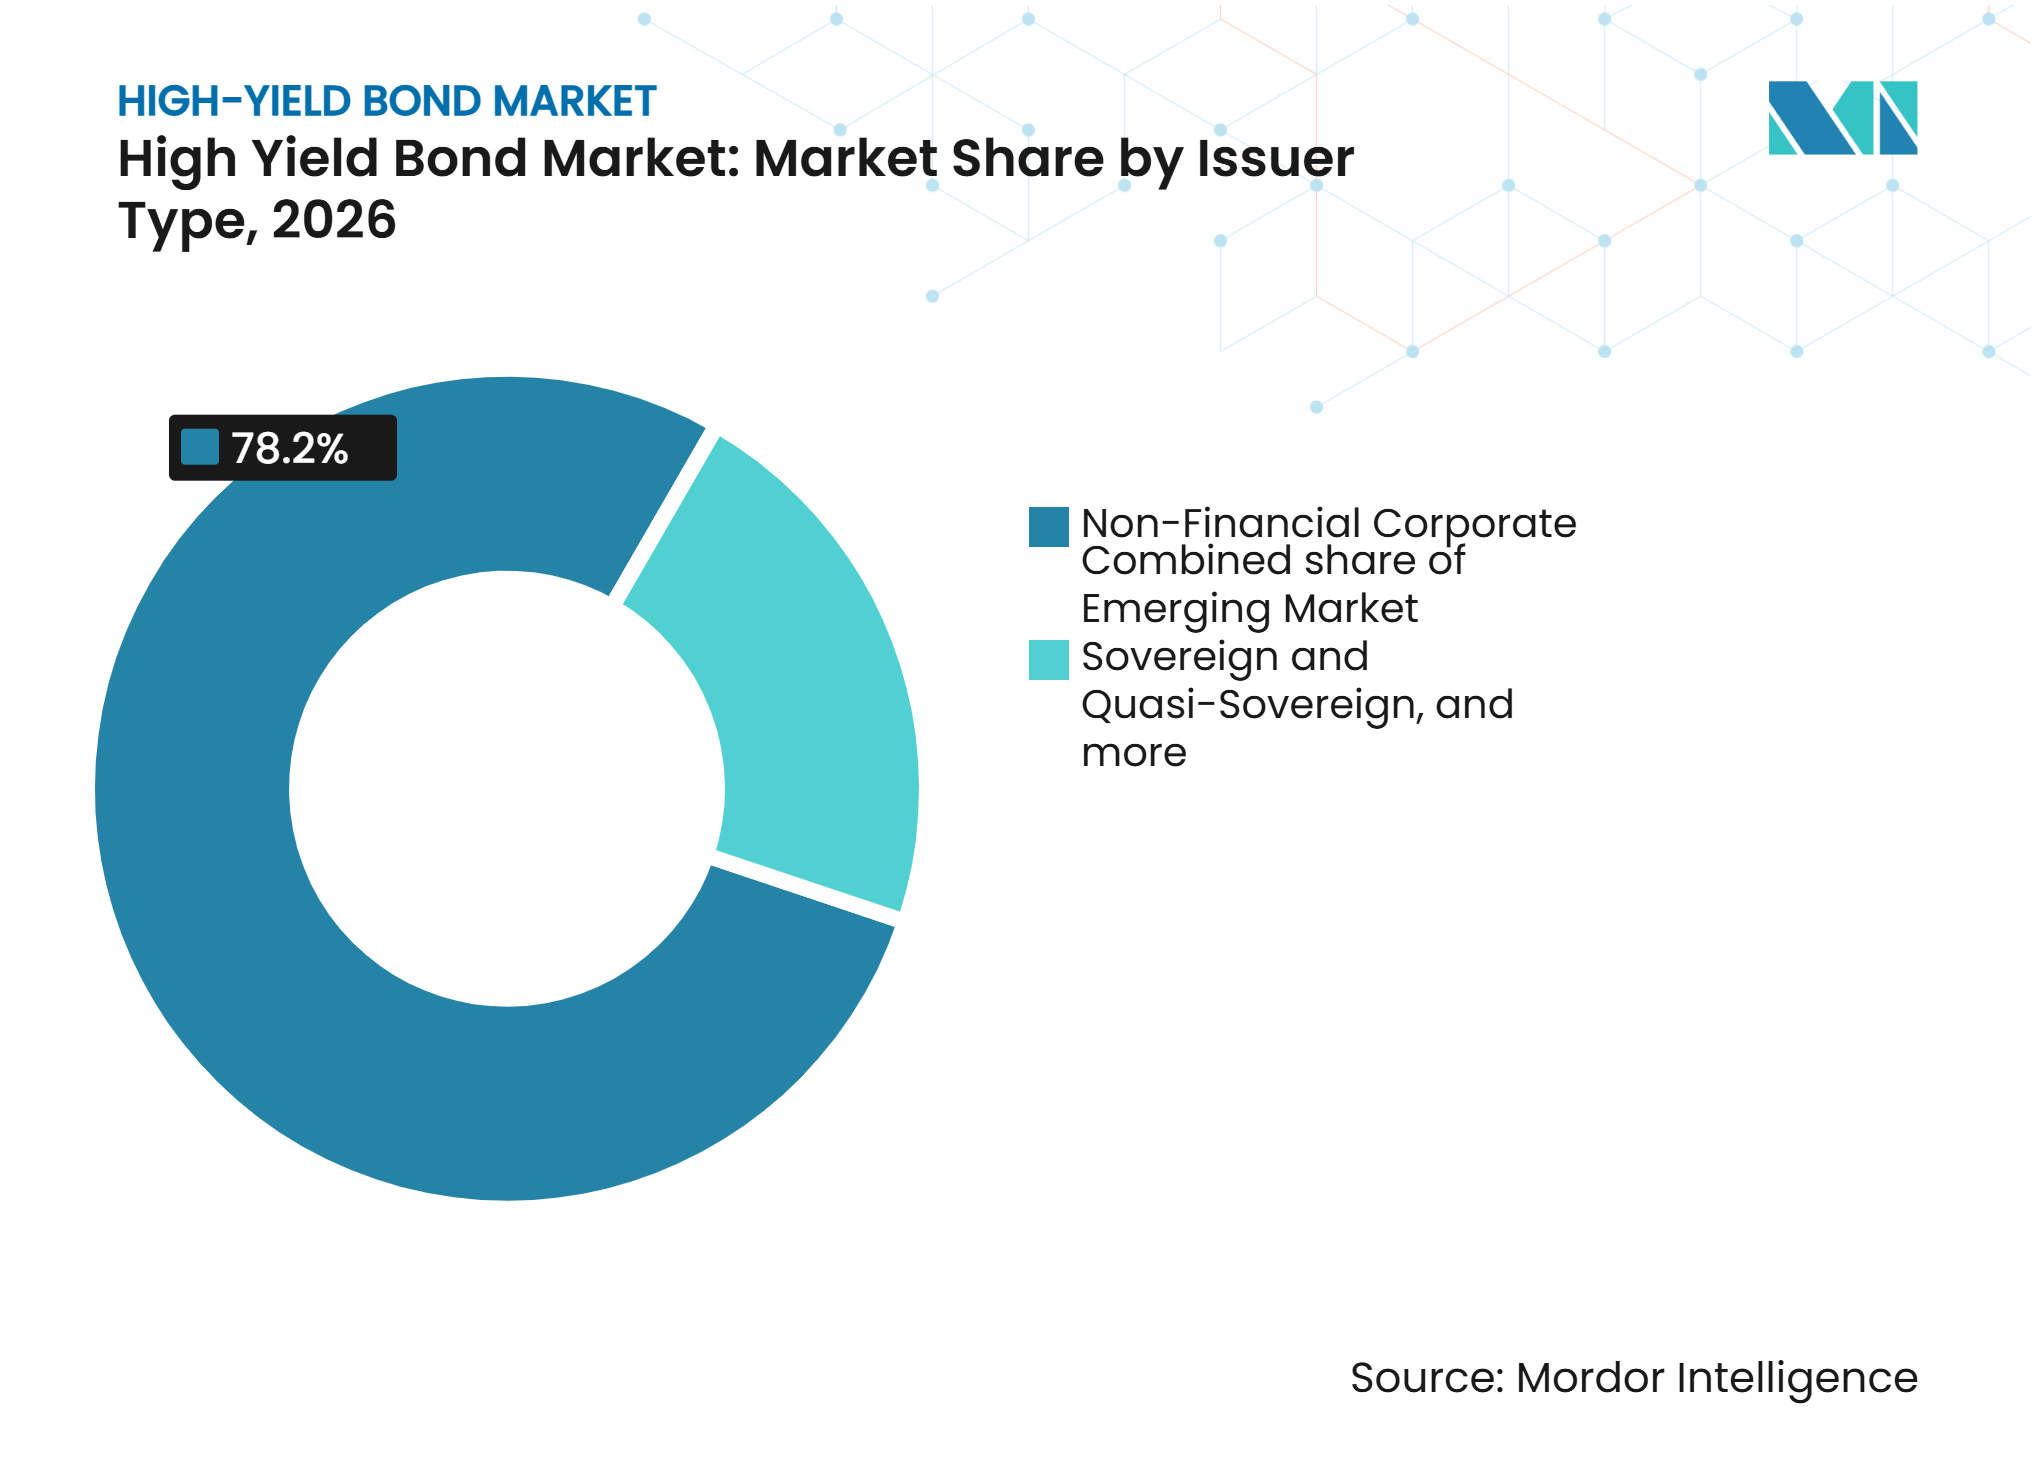
Corporate Issuance Remains the Mainstay While Sovereigns ExpandNon-financial corporates accounted for 78.2% of the high-yield bond market size in 2026. Communications, energy, healthcare, and consumer companies use bonds as a core capital-markets channel for leveraged corporate financing. Financial corporate issuers remain a smaller but meaningful group that includes banks, insurers, and other institutions. European banks' Additional Tier 1 and Tier 2 instruments provide a recurring channel that is shaped by Basel III capital requirements. AI infrastructure operators are also entering the issuer base with structures that combine project-finance features and corporate bond formats.
Emerging market sovereign and quasi-sovereign issuers are projected to grow at a 6.6% CAGR from 2027 to 2032. The Asia high-yield index has changed as Chinese property issuers have declined and frontier sovereigns and quasi-sovereign infrastructure operators have become more prominent. In May 2026, emerging-market sovereign primary issuance reached USD 13.5 billion, exceeding the 10-year monthly average of USD 10.7 billion. Bolivia, Egypt, and the Democratic Republic of the Congo accessed international markets during the month. Reform programs supported by the International Monetary Fund in Sub-Saharan Africa and South Asia are widening the eligible issuer base and supporting faster growth.


By Credit Rating:
BB Bonds Form the Core While CCC Bonds Remain High RiskBB-rated bonds accounted for 59.6% of the high-yield bond market in 2026 and form the core of many institutional mandates. Around 55% of the United States high-yield index was rated BB by mid-2026, which was 10 percentage points higher than a decade earlier. Fallen angels and the movement of riskier issuers toward private credit have supported this higher-quality composition. B-rated bonds remain the middle tier and are viewed by several active managers as attractive for risk-adjusted income. Global high-yield default rates were 1.5% at the end of 2025 and were concentrated primarily in the CCC segment.
CCC-rated bonds and below are projected to grow at 5.2% CAGR through 2032. Growth reflects a larger speculative-grade issuer universe, greater emerging-market access, rating migration after coupon resets, and demand from distressed-debt managers. The high yield bond industry must balance this growth opportunity against materially higher default risk in the category. CCC+ bonds had a 1-year default rate of 16.2%, while Moody’s placed the broader CCC category in a 14.2% to 18.6% range. SEC Rule 144A and FINRA TRACE requirements continue to improve disclosure and reporting standards across the rating spectrum.
By Remaining Time to Maturity:
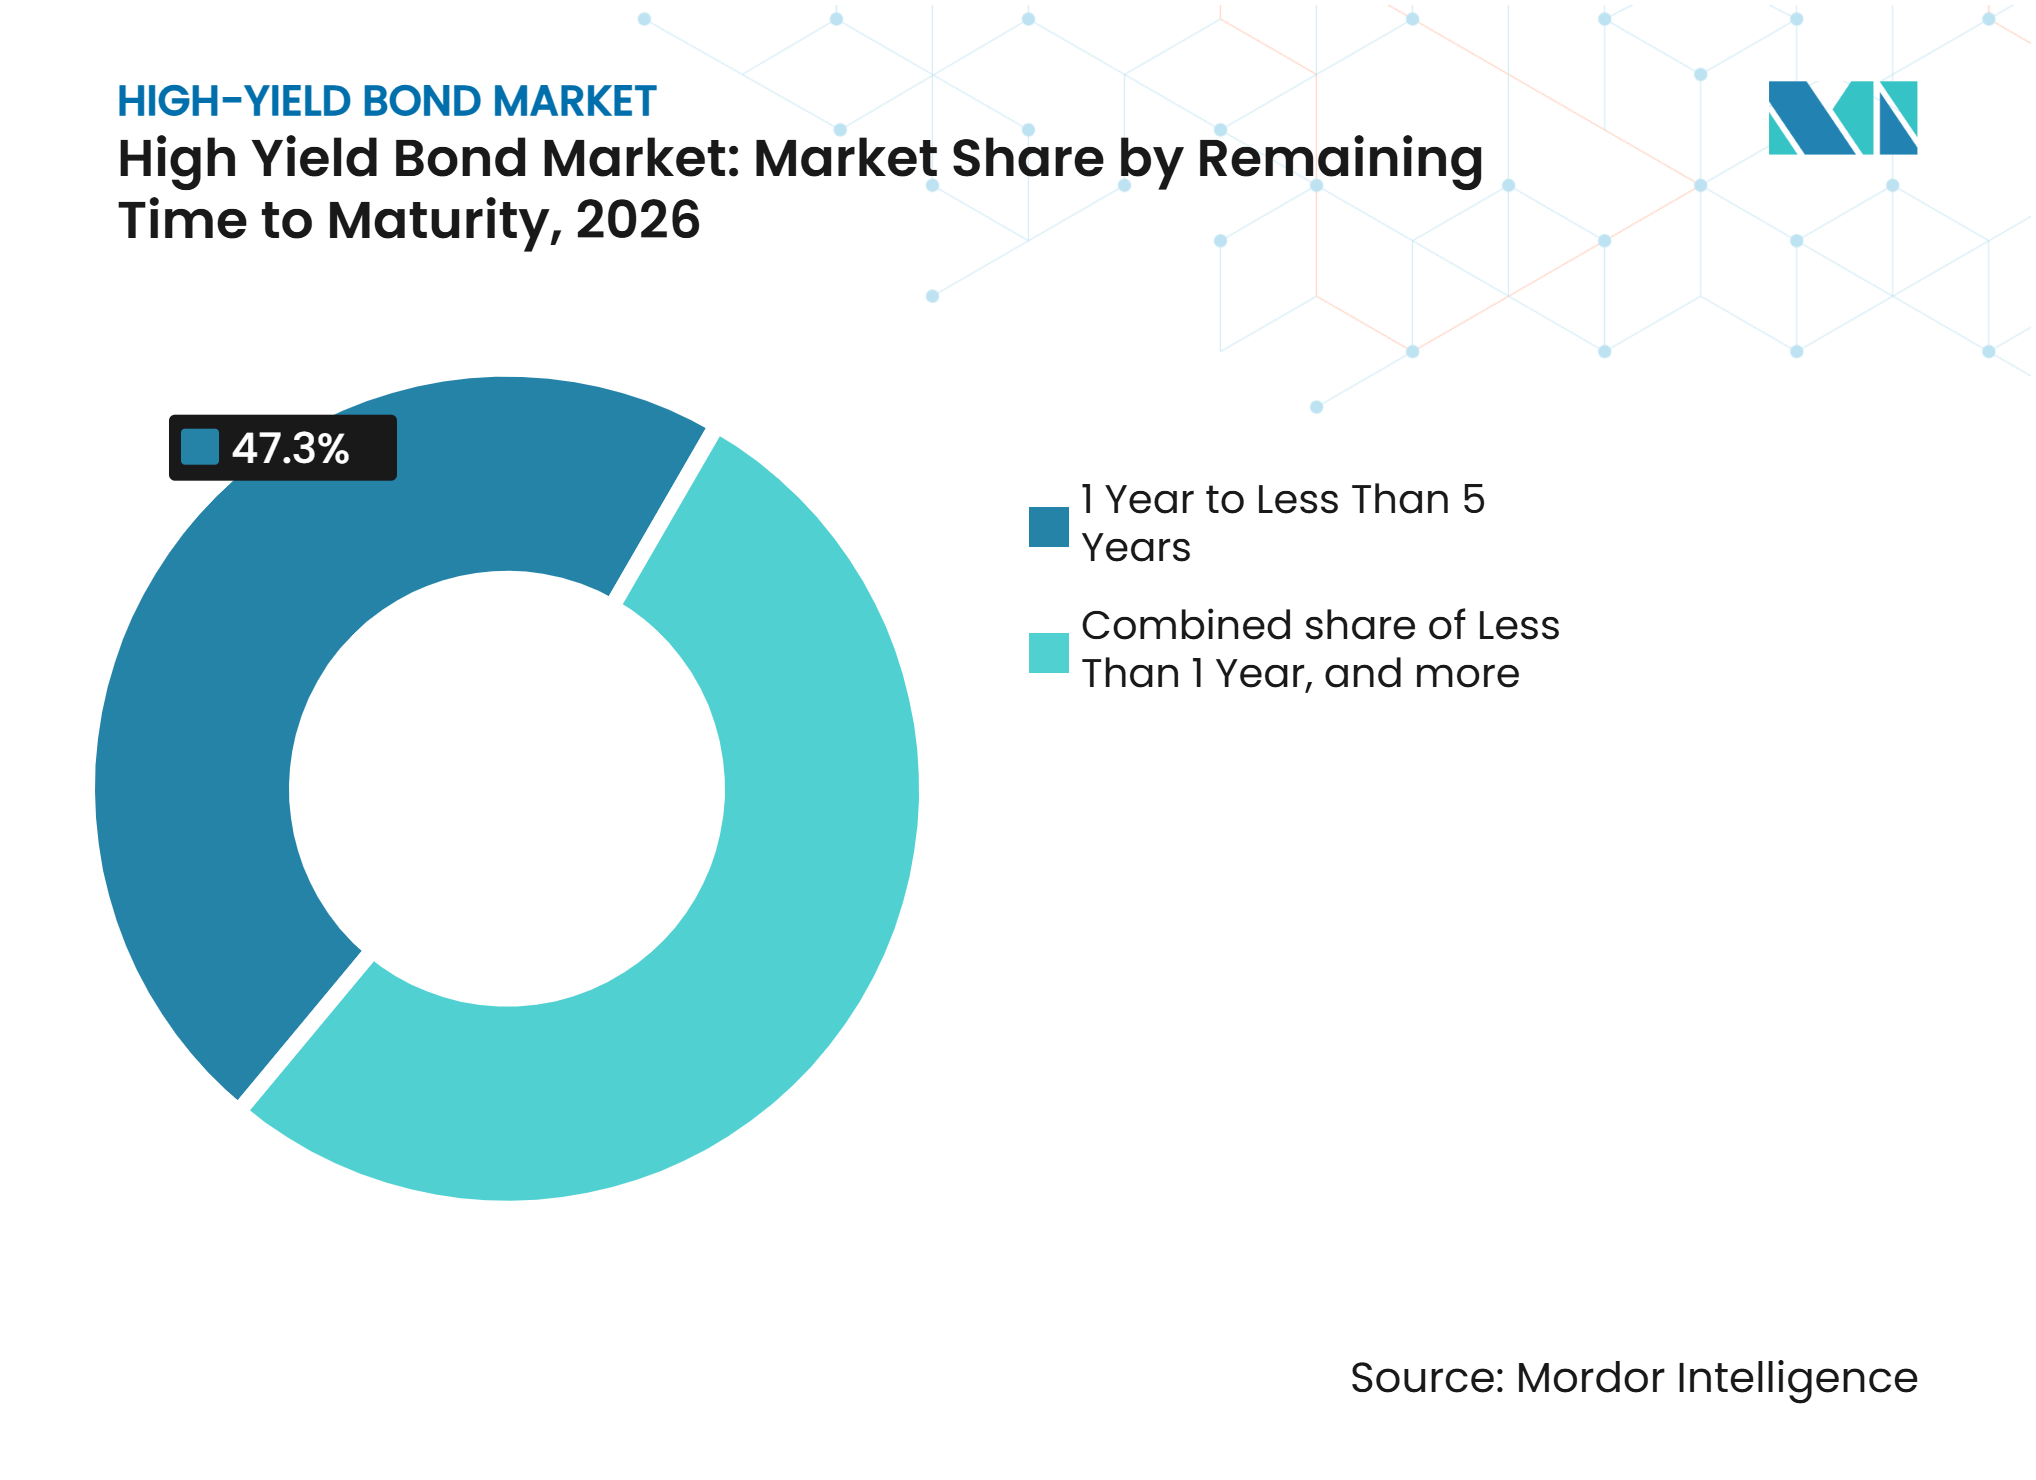
Short-Dated Bonds Lead While Medium Tenors BuildBonds with 1 year to less than 5 years remaining maturity held a 47.3% share in 2026. Issuers favor shorter durations in an elevated-rate environment, while investors seek income with lower sensitivity to rate movements. The average maturity of newly issued European high-yield bonds fell to 5.6 years in 2025 from 5.8 years in 2024. Short-duration strategies also appeal to liability-driven investors who want income without extended duration risk. Bonds with less than 1 year remaining maturity will remain a useful indicator of refinancing needs as the next maturity wall approaches.
The 5 years to less than 10 years category is projected to grow at 5.4% CAGR from 2027 to 2032. Higher-quality issuers that complete refinancing in 2026 and 2027 are expected to extend maturities as rates moderate. This can lock in funding costs and reduce the frequency of future refinancing. The high yield bond market benefits when investment-grade-adjacent BB issuers develop the scale to access longer-term structures efficiently. Bonds with 10 years or more remaining maturity are likely to remain a smaller category used mainly by quasi-sovereigns and investment-grade-adjacent corporates. These issuers use longer maturities to align financing with long-lived assets and liabilities.

By Seniority and Security:
Unsecured Bonds Lead While Secured Structures Gain GroundSenior unsecured bonds accounted for a 58.1% share in 2026. They remain the standard instrument for repeat high-yield issuers that do not need to pledge specific assets. Subordinated bonds and junior or hybrid instruments are used mainly by financial companies for regulatory capital management under Basel III and Solvency II. European banks have issued selected Additional Tier 1 and Tier 2 securities, while junior and hybrid bonds support conglomerate and holding-company structures. The high-yield bond industry continues to use unsecured funding where established issuers have reliable market access and sufficient investor confidence.
Senior secured bonds are projected to grow at 6.1% CAGR through 2032. Oaktree noted that more high-yield bonds are being issued in senior secured form. Data-center financings have helped drive this shift because triple-net leases with investment-grade hyperscaler tenants can support secured structures. Secured bonds can achieve lower spreads even when the issuer is below investment grade. Lower recoveries on unsecured bonds in a covenant-light environment also make asset-backed financing more appealing to investors. This can gradually increase the strategic value of pledged assets in the high-yield bond market.
By Coupon Type:
Fixed-Rate Bonds Dominate While Floating-Rate Demand RisesFixed-rate bonds captured an 87.4% share in 2026 and remain the principal contractual-income format in the high-yield bond market. Issuers prefer predictable interest costs for financial planning. Pension funds and insurance portfolios also use fixed-rate bonds to match income and duration requirements. Most leveraged-buyout and refinancing transactions continue to use fixed-rate structures. The yield premium over investment-grade debt supports their continued relevance for income-focused investors.
Floating-rate bonds are projected to grow at a 7.2% CAGR through 2032. Their growth reflects a closer relationship between public bond structures and private-credit or broadly syndicated loan structures. Borrowers can issue floating-rate notes that provide collateralized loan obligation-compatible exposure without using a fully syndicated loan format. Collateralized loan obligation new issuance exceeded USD 150 billion in a single quarter in 2025, which supported demand for floating-rate instruments that can enter collateral pools. The Federal Reserve’s 25 bps rate cut in December 2025 and its cautious forward guidance also supported interest in floating-rate income as a partial hedge against rate uncertainty.
By Currency:
United States Dollar Bonds Lead While Other Currencies Broaden AccessUSD-denominated bonds accounted for a 69.6% share in 2026, supported by the deepest investor base and the greatest secondary-market liquidity. The outstanding United States high-yield bond market was USD 1.47 trillion at the end of 2025. EUR-denominated high yield was EUR 574 billion (USD 675.20 billion), and Asia high yield was USD 114 billion. The EUR segment is the second-largest currency category and serves mainly European corporate issuers. ESMA disclosure requirements under the European Union Prospectus Regulation shape issuance in this part of the high yield bond market.
Other currencies, including GBP and selected emerging-market hard-currency denominations, are projected to grow at 5.8% CAGR through 2032. Egypt issued a dual-tranche United States dollar bond at yields of 8.625% to 9.45% in early 2025, while Kenya priced an 11-year United States dollar bond with a 9.5% coupon. Saudi Arabia raised USD 11.5 billion in January 2026 from an order book exceeding USD 28 billion. The expansion of emerging-market sovereign access can broaden currency opportunities for global mandates. International Monetary Fund-supported reform programs are an important factor for countries seeking durable access to external capital markets.
Geography Analysis
North America held a 59.7% share of the high-yield bond market in 2026 and remains the main center of global leveraged finance. United States high-yield issuance totaled USD 328 billion in 2025, the highest annual total since 2021. Dealer forecasts place 2026 issuance between USD 340 billion and USD 380 billion. BB bonds represented 55% of the United States index by mid-2026, while the projected 2026 default rate was 1.75%.
Europe is the second-largest regional market and recorded primary issuance of EUR 148.9 billion (USD 175.13 billion) in 2025. European primary issuance reached EUR 50.4 billion (USD 59.29 billion) in the second quarter of 2026, an increase of 6.7% from the prior year. The United Kingdom, Germany, and France anchor the issuer base, while Spain and Italy contribute consumer, telecommunications, and industrial issuers. Emerging European markets recorded more upgrades than downgrades in the first quarter of 2026, although chemicals, packaging, and consumer products continued to face rating pressure.
Asia-Pacific is projected to grow at a 6.9% CAGR from 2027 to 2032, the fastest rate among regions. The Asia high-yield index was USD 114 billion to USD 115 billion in early 2026, and its 10 largest issuers accounted for 40% of benchmark weight. Asia high yield returned 9.81% in 2025 through November, supported by non-China-property default rates of 0.5%. The Asian Development Bank reported that regional financial markets remained resilient through late 2025 and early 2026, supported by accommodative monetary policy and improving economic conditions. In the Middle East and Africa, Saudi Arabia’s January 2026 bond transaction and Sub-Saharan sovereign issuance linked to International Monetary Fund reform programs are expanding the regional opportunity set.
Competitive Landscape
Market Concentration
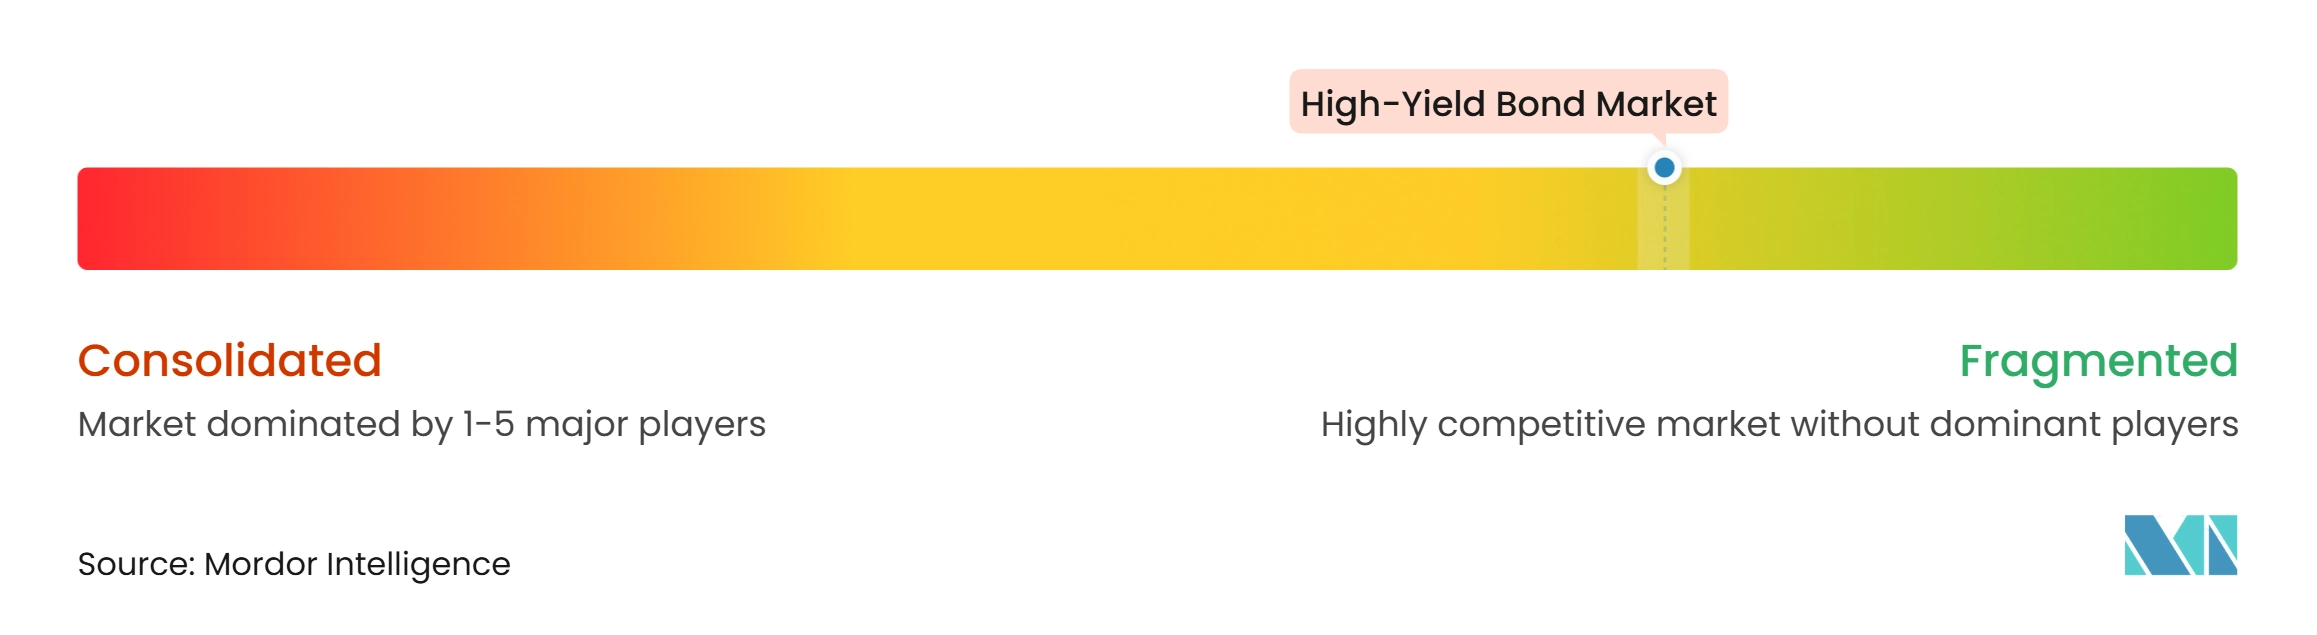
The high-yield bond market is fragmented, with competition spread across traditional asset managers, specialist credit investors, alternative asset managers, and electronic trading platforms. BlackRock, PGIM, PIMCO, J.P. Morgan Asset Management, Wellington Management, Oaktree, Apollo, KKR, and Ares compete through differentiated investment strategies, distribution networks, and credit research capabilities. Competition increasingly centers on low-cost exchange-traded funds (ETFs), short-duration products, and blended public-private credit strategies. In June 2025, J.P. Morgan Asset Management launched its active high-yield bond ETF, JPHY, anchored by a USD 2 billion investment from CalPERS, with a 0.45% management fee. In February 2025, BlackRock converted its High Yield Municipal Fund into the iShares High Yield Muni Active ETF, reflecting the shift toward exchange-traded investment structures.
Alternative asset managers such as Oaktree, Apollo, KKR, and Ares compete for institutional allocations through strategies spanning public high-yield debt and private credit. Wellington Management has highlighted how private credit can finance weaker high-yield borrowers, potentially leaving public bond markets with a different issuer risk profile. Regional investment opportunities also influence competition, particularly in Asia, where Fidelity's January 2026 outlook cited high-yield yields of 7.8%, compared with 7.0% in the United States. Managers therefore differentiate themselves through credit underwriting, research capabilities, regional expertise, and the ability to invest across public and private markets.
Technology is becoming an increasingly important differentiator in high-yield bond trading and research. In June 2026, Tradeweb launched TARA, an AI-powered research assistant that enables institutional credit traders to query trading activity and liquidity conditions using natural-language prompts. Trumid reported USD 10.4 billion in average daily trading volume for May 2026, an increase of 53% year over year, as activity on its electronic credit trading platform expanded. Asset managers are also applying predictive analytics and alternative data to identify deteriorating issuer fundamentals, potential defaults, and covenant risks earlier. Compliance with applicable SEC Rule 144A provisions and FINRA TRACE reporting requirements adds operational and reporting demands, while supporting greater market transparency.
High-Yield Bond Industry Leaders
-
BlackRock, Inc.
-
PGIM, Inc.
-
Barings LLC
-
Swiss Life Asset Managers
-
Neuberger
- *Disclaimer: Major Players sorted in no particular order
High-Yield Bond Market Companies Covered in this Report
- BlackRock, Inc.
- PGIM, Inc.
- PIMCO LLC
- JPMorgan Asset Management
- Fidelity Investments
- T. Rowe Price Group, Inc.
- Neuberger
- Barings LLC
- AllianceBernstein Holding L.P.
- Wellington Management Group LLP
- Franklin Templeton
- Invesco Ltd.
- The Vanguard Group, Inc.
- Janus Henderson Group plc
- Nuveen LLC
- MFS Investment Management
- Oaktree Capital Management, L.P.
- Apollo Global Management, Inc.
- KKR & Co. Inc.
- Swiss Life Asset Managers
Recent Industry Developments in High-Yield Bond Market
- September 2026: Tradeweb enhanced its AI-Price model for investment-grade and high-yield corporate bonds, achieving a 30% improvement in pricing accuracy versus the prior TRACE print benchmark, expanding coverage to emerging market bonds and enabling advanced pre-trade analytics.
- July 2026: PIMCO launched the GIS Global Bond Opportunities Fund under its UCITS range, a flexible global core bond strategy dynamically allocating across credit, rates, and currencies, building on a platform managing over USD 150 billion in global bonds.
- June 2026: J.P. Morgan acted as lead bookrunner on a USD 4.25 billion senior secured notes offering for Hut 8’s Beacon Point data center in Texas, the highest loan-to-cost ratio ever for a high-performance computing bond, illustrating growing institutional appetite for secured AI-infrastructure high-yield structures.
- June 2026: Tradeweb launched TARA, a conversational AI-powered assistant for institutional United States credit market participants, enabling natural-language queries on trading flows, liquidity, and pricing intelligence, with planned expansion to additional asset classes.
Global High-Yield Bond Market Report Scope
Segmentation Overview
| Non-Financial Corporate |
| Financial Corporate (Banks + Insurance + Other Financial Institutions) |
| Emerging Market Sovereign and Quasi-Sovereign |
| BB Category |
| B Category |
| CCC Category and Below |
| Unrated Bonds |
| Less Than 1 Year |
| 1 Year to Less Than 5 Years |
| 5 Years to Less Than 10 Years |
| 10 Years and Above |
| Senior Secured |
| Senior Unsecured |
| Subordinated |
| Junior / Hybrid |
| Fixed-rate |
| Floating-rate |
| Other |
| USD |
| EUR |
| GBP |
| Other |
| North America | United States |
| Canada | |
| Mexico | |
| South America | Brazil |
| Argentina | |
| Rest of South America | |
| Europe | United Kingdom |
| Germany | |
| France | |
| Italy | |
| Spain | |
| Rest of Europe | |
| Asia-Pacific | China |
| Japan | |
| India | |
| South Korea | |
| Australia | |
| Indonesia | |
| Thailand | |
| Malaysia | |
| Singapore | |
| Vietnam | |
| Rest of Asia-Pacific | |
| Middle East and Africa | Saudi Arabia |
| United Arab Emirates | |
| Turkey | |
| South Africa | |
| Egypt | |
| Rest of Middle East and Africa |
| By Issuer Type | Non-Financial Corporate | |
| Financial Corporate (Banks + Insurance + Other Financial Institutions) | ||
| Emerging Market Sovereign and Quasi-Sovereign | ||
| By Credit Rating | BB Category | |
| B Category | ||
| CCC Category and Below | ||
| Unrated Bonds | ||
| By Remaining Time to Maturity | Less Than 1 Year | |
| 1 Year to Less Than 5 Years | ||
| 5 Years to Less Than 10 Years | ||
| 10 Years and Above | ||
| By Seniority and Security | Senior Secured | |
| Senior Unsecured | ||
| Subordinated | ||
| Junior / Hybrid | ||
| By Coupon Type | Fixed-rate | |
| Floating-rate | ||
| Other | ||
| By Currency | USD | |
| EUR | ||
| GBP | ||
| Other | ||
| By Geography | North America | United States |
| Canada | ||
| Mexico | ||
| South America | Brazil | |
| Argentina | ||
| Rest of South America | ||
| Europe | United Kingdom | |
| Germany | ||
| France | ||
| Italy | ||
| Spain | ||
| Rest of Europe | ||
| Asia-Pacific | China | |
| Japan | ||
| India | ||
| South Korea | ||
| Australia | ||
| Indonesia | ||
| Thailand | ||
| Malaysia | ||
| Singapore | ||
| Vietnam | ||
| Rest of Asia-Pacific | ||
| Middle East and Africa | Saudi Arabia | |
| United Arab Emirates | ||
| Turkey | ||
| South Africa | ||
| Egypt | ||
| Rest of Middle East and Africa | ||
Key Questions Answered in the Report
What is driving growth in high yield bonds through 2032?
Refinancing needs, institutional demand for income, data-center financing, and a recovering pipeline of mergers, acquisitions, and leveraged buyouts support growth through 2032.
Which issuer type leads high-yield issuance?
Non-financial corporates accounted for 78.2% share in 2026, while emerging market sovereign and quasi-sovereign issuers are projected to grow at a 6.6% CAGR through 2032.
Why are BB-rated bonds important to investors?
BB-rated bonds accounted for 59.6% share in 2026 and provide the higher-quality core of many institutional high-yield allocations.
Which region is growing fastest for high-yield bonds?
Asia-Pacific is projected to grow at a 6.9% CAGR through 2032, supported by changes in the regional issuer base and resilient financial conditions.
How does private credit affect public high-yield bonds?
Private credit competes for some leveraged-finance transactions, particularly among weaker borrowers, while public bonds remain important for larger financings and liquid institutional distribution.
Why are senior secured bonds gaining attention?
Senior secured bonds are projected to grow at a 6.1% CAGR through 2032 because collateral can improve investor protection and help issuers achieve lower borrowing spreads.