High Voltage Cables Market Size and Share
Market Overview
| Study Period | 2021 - 2031 |
|---|---|
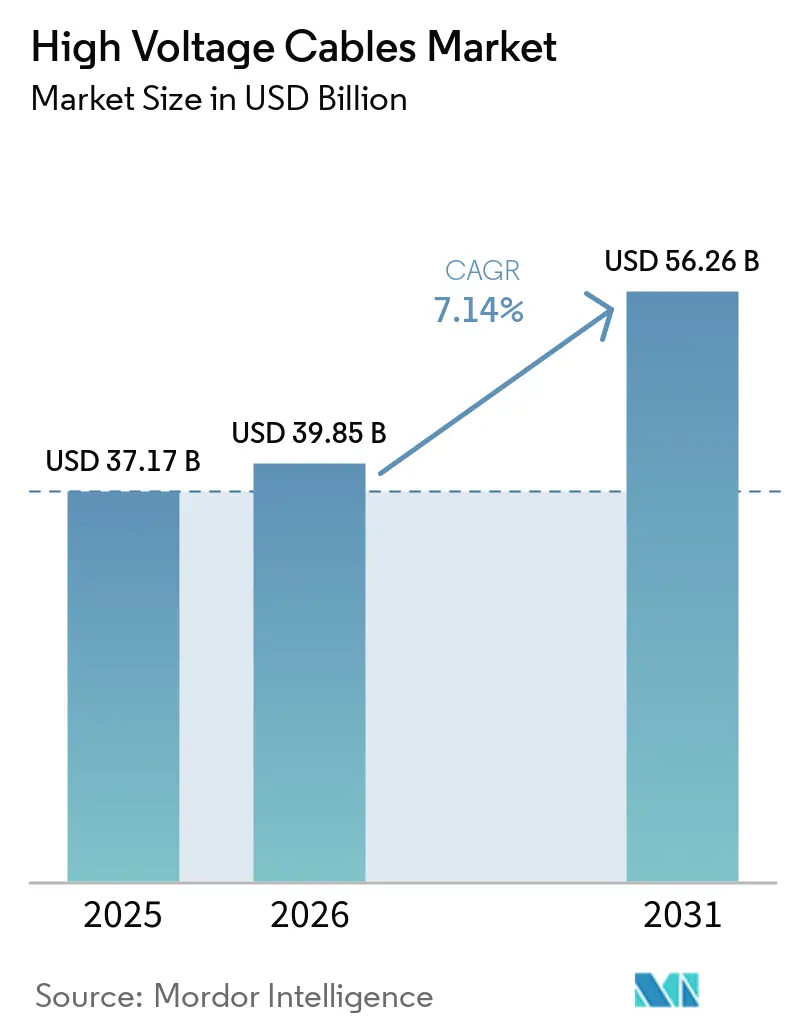
| Market Size (2026) | USD 39.85 Billion |
| Market Size (2031) | USD 56.26 Billion |
| Growth Rate (2026 - 2031) | 7.14% CAGR |
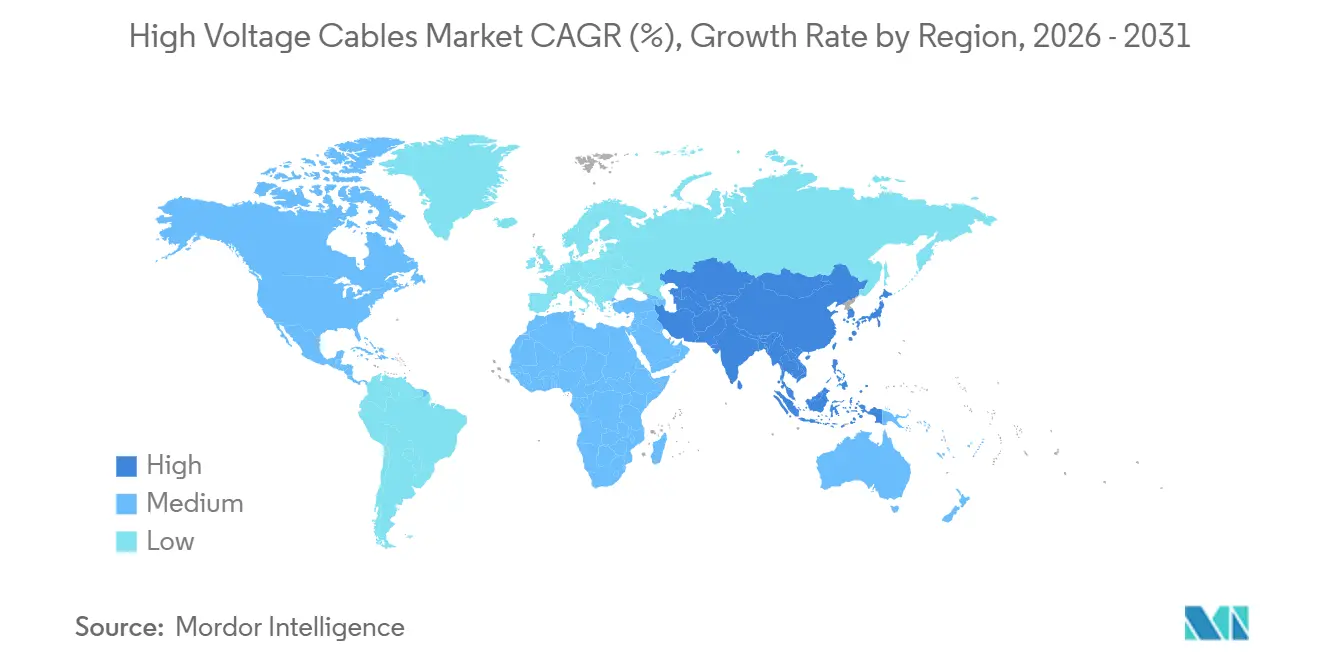
| Fastest Growing Market | Asia Pacific |
| Largest Market | Asia Pacific |
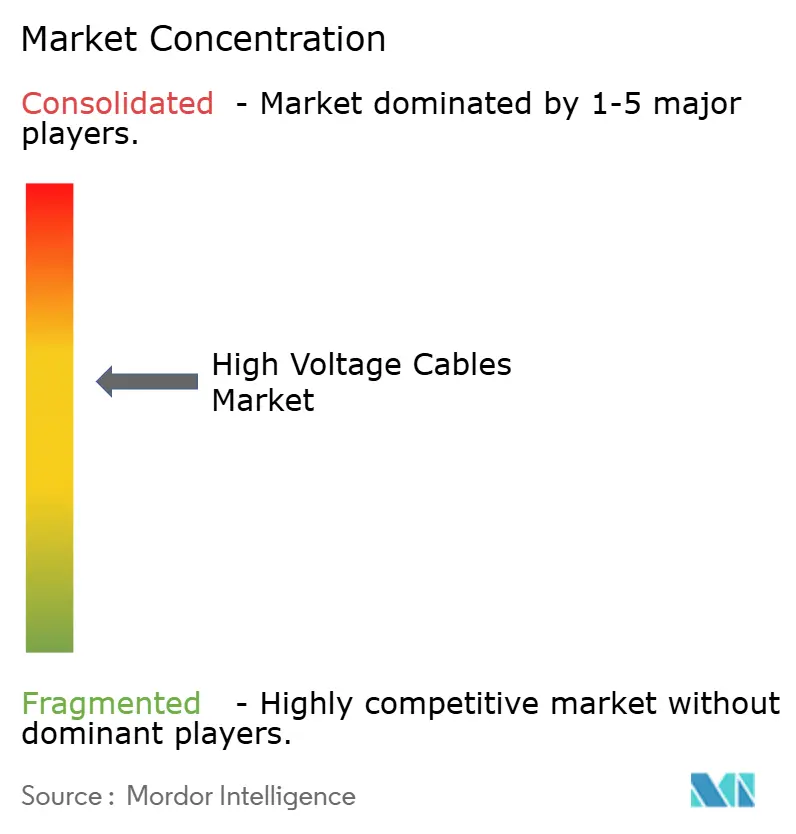
| Market Concentration | Medium |
Major Players *Disclaimer: Major Players sorted in no particular order Image © Mordor Intelligence. Reuse requires attribution under CC BY 4.0. | |
High Voltage Cables Market Analysis by Mordor Intelligence
The high voltage cables market reached USD 39.85 billion in 2026 and is projected to achieve USD 56.26 billion by 2031, reflecting a 7.14% CAGR during the forecast period, underscoring a decisive reorientation of power-grid spending toward decarbonization and resilience. Lead times for high-voltage orders now run two to three years, prompting project sponsors to secure long-term supply agreements early and tolerate price premiums that have nearly doubled since 2019. Utilities in Asia-Pacific, Europe, and North America are prioritizing underground and submarine corridors to navigate land-use constraints, integrate offshore wind, and harden networks against climate-related disruption. The surge in extra-high-voltage direct current (HVDC) projects above 400 km demonstrates a strategic pivot toward bulk power transfers with lower resistive losses, while a deficit of certified jointing technicians threatens project schedules and budgets. Growing interest in hydrogen-ready transmission corridors and data-center feeder upgrades broadens the high voltage cables market opportunity set, inviting new entrants yet exposing legacy suppliers to margin pressure.
Key Report Takeaways
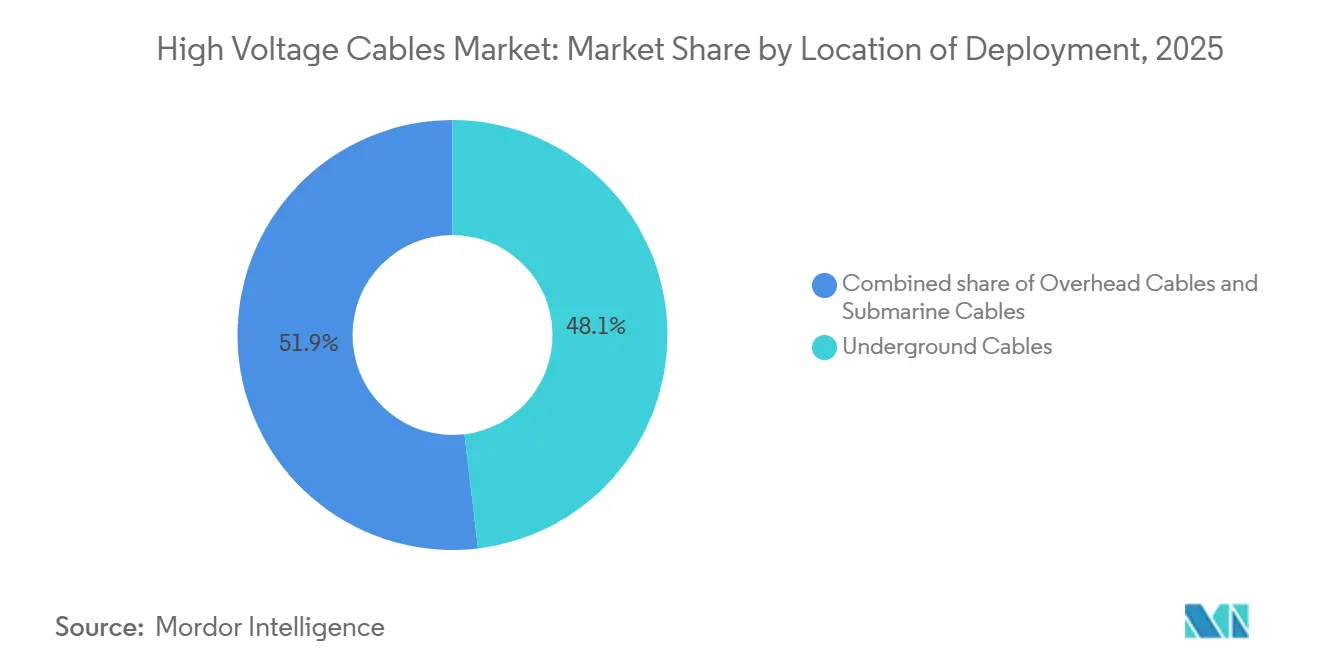
- By location of deployment, underground cables led with a 48.1% share of the high voltage cables market in 2025, while submarine lines are forecast to grow at a 10.3% CAGR through 2031.
- By type of transmission, HVAC maintained 70.9% of the high voltage cables market share in 2025; HVDC is projected to record the fastest 8.1% CAGR to 2031.
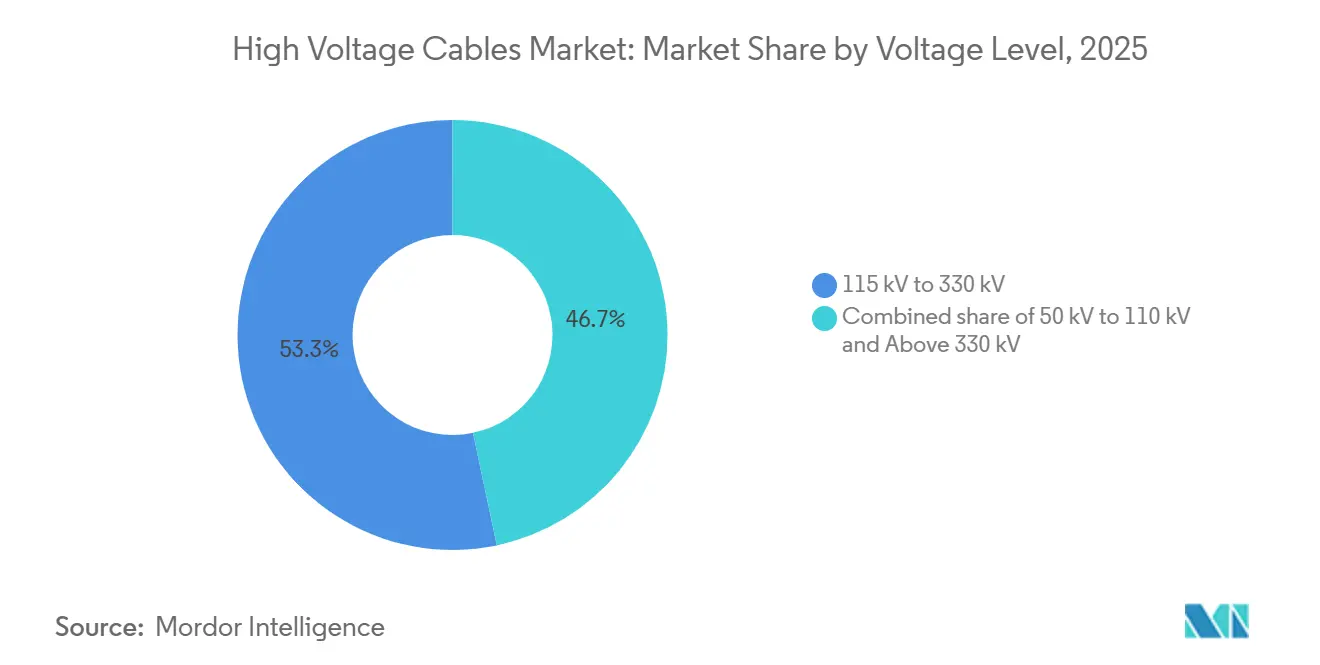
- By voltage level, the 115 kV – 330 kV band accounted for 53.3% of the high voltage cables market size in 2025, whereas circuits above 330 kV are set to expand at 8.8% CAGR between 2026 and 2031.
- By geography, Asia-Pacific captured 40.0% of the high voltage cables market share in 2025 and is advancing at a 9.6% CAGR to 2031.
Note: Market size and forecast figures in this report are generated using Mordor Intelligence’s proprietary estimation framework, updated with the latest available data and insights as of January 2026.
Global High Voltage Cables Market Trends and Insights
Drivers Impact Analysis*
| Driver | ( ~ ) % Impact on CAGR Forecast | Geographic Relevance | Impact Timeline |
|---|---|---|---|
| Integration of renewable energy build-out | +2.1% | Global, with APAC and Europe leading solar and wind additions | Medium term (2-4 years) |
| Rapid grid modernization & interconnection projects | +1.8% | Europe, North America, ASEAN, Middle East | Long term (≥4 years) |
| Expanding offshore wind farm installations | +1.5% | Europe (North Sea), APAC (Taiwan, Japan, South Korea), North America (Atlantic coast) | Medium term (2-4 years) |
| Data-center campus power-density surge | +0.9% | North America, Europe, select APAC hubs (Singapore, Tokyo) | Short term (≤2 years) |
| Urbanization & industrial load growth in emerging economies | +1.2% | APAC core (India tier-2 cities, Southeast Asia industrial corridors), Middle East & Africa (GCC mega-cities, South Africa), South America (Brazil urban expansion) | Long term (≥4 years) |
| Hydrogen economy-ready transmission corridors | +0.4% | Europe (Germany, Netherlands hydrogen backbone), Australia (export-oriented green hydrogen), Middle East (Saudi Arabia, UAE electrolyzer clusters) | Long term (≥4 years) |
| Source: Mordor Intelligence | |||
Integration of renewable energy build-out
Curtailment risk is escalating as solar and wind additions outpace grid reinforcements, compelling governments to mandate new high-capacity corridors, such as the EU goal of 40,000 circuit-km by 2030.[1]European Commission, “TEN-E Regulation Impact Assessment,” ec.europa.eu India cleared 8,000 km of 400 kV and 765 kV lines in 2025 to connect Rajasthan and Gujarat renewables, while China commissioned 3,200 km of ± 800 kV HVDC to move western power eastward. Storage co-location offers only four-hour coverage, leaving the high voltage cables market central to seasonal balancing strategies.
Rapid Grid Modernization & Interconnection Projects
Legacy circuits installed in the 1960s now show rising failure rates, and the U.S. Department of Energy committed USD 2.5 billion in 2025 to stimulate large interregional links.[2]U.S. Department of Energy, “Transmission Facilitation Program Awards 2025,” energy.gov ASEAN’s USD 800 billion Power Grid blueprint envisions synchronous exchanges across Thailand, Malaysia, Singapore, and Indonesia, while the 2 GW EuroAsia Interconnector will deploy 525 kV subsea cables to marry Mediterranean and European demand centers. These builds reinforce the long-run growth of the high-voltage cables market.
Expanding Offshore Wind Farm Installations
Utility-scale arrays 50–150 km offshore need 220 kV–525 kV submarine export cables to control losses. Contracts such as NKT’s EUR 650 million Bornholm Energy Island order underscore the capital intensity of this niche.[3]NKT A/S, “Bornholm Energy Island Contract,” nkt.com National Grid’s Sea Link and the U.S. Bureau of Ocean Energy Management lease auctions further underpin the segment, yet installation vessel scarcity lengthens project lead times to more than 36 months.
Data-Center Campus Power-Density Surge
Hyperscale facilities demanding 100–300 MW loads now require direct 115 kV–345 kV feeds. Microsoft’s plan for 50 GW of renewable contracts and Google’s Ohio 345 kV tie-in signal a durable pull-through for the high voltage cables market.[4]Google LLC, “Infrastructure Update Ohio Data Center,” google.com Utilities in Virginia, Texas, and Singapore are fast-tracking substation upgrades, driving regional pricing premiums.
Restraints Impact Analysis*
| Restraint | ( ~ ) % Impact on CAGR Forecast | Geographic Relevance | Impact Timeline |
|---|---|---|---|
| High upfront CAPEX of HV cable projects | -1.2% | Global, particularly acute in emerging markets with limited access to project finance | Long term (≥4 years) |
| Lengthy permitting & environmental clearances | -0.8% | Europe, North America, select APAC markets with stringent environmental frameworks | Medium term (2-4 years) |
| Commodity-price volatility (Cu, Al, polymers) | -0.6% | Global, with heightened exposure in regions dependent on imported raw materials (Europe, Japan, South Korea); partial mitigation in copper-producing nations (Chile, Peru, Zambia) | Short term (≤2 years) |
| Shortage of certified HV jointing technicians | -0.5% | Europe (aging workforce, limited vocational training), North America (competition from other infrastructure sectors), APAC (rapid capacity expansion outpacing skill development in India, Vietnam) | Medium term (2-4 years) |
| Source: Mordor Intelligence | |||
High Upfront CAPEX of HV Cable Projects
Submarine and underground routes cost up to five times more per km than overhead lines, with the Celtic Interconnector priced at EUR 1.6 million per km, straining debt-service metrics in developing countries. Rising interest rates in 2024–2025 pushed Prysmian’s inquiry-to-order conversion down 30% as financiers balked at unhedged cost exposure.
Lengthy Permitting & Environmental Clearances
Marine spatial planning, environmental impact assessments, and multi-agency consultations extend timelines by up to 36 months in the United Kingdom and the United States. These delays raise holding costs and amplify commodity-price risk, stalling some high-voltage cables market commitments.
*Our forecasts treat driver/restraint impacts as directional, not additive. The impact forecasts reflect baseline growth, mix effects, and variable interactions.
Segment Analysis
By Location of Deployment: Submarine Cables Ride Offshore Wind Wave
Submarine lines are projected to grow 10.3% between 2026 and 2031, the fastest among deployment modes, catalyzed by offshore arrays in the North Sea, Taiwan Strait, and the U.S. Atlantic. Underground routes retained 48.1% of the high voltage cables market size in 2025, driven by dense urban centers that restrict overhead construction. Overhead circuits still dominate sparsely populated corridors in North America and Africa, leveraging easier rights-of-way and lower CAPEX. Vessel shortages mean developers must pre-book installation ships years ahead, an operational hurdle that shapes bid strategies.
Urban planners in Tokyo, Seoul, and Singapore favor underground feeder loops to address visual impact concerns. Conversely, the Celtic and Bornholm projects show how submarine architecture can aggregate multi-gigawatt wind hubs. The IEC 62067 standard for extruded insulation underpins procurement uniformity, while insurance costs escalate due to fishing-gear strike risks. These dynamics ensure the high voltage cables market continues reallocating capital from overhead to submarine corridors.


By Type of Transmission: HVDC Cables Gain on Long-Haul Economics
HVDC installations are forecast to advance at 8.1% through 2031, outpacing HVAC, which still commanded 70.9% of the high voltage cables market share in 2025. Siemens Energy’s converters have trimmed the break-even distance for HVDC submarine runs to 400 km, spurring uptake for offshore-wind export and cross-border projects. The 2,250 MW Western HVDC Link avoided reactive-power penalties over 420 km by choosing 600 kV DC conductors.
HVAC remains the economical default for radial lines under 200 km thanks to simpler station hardware. However, modular multilevel converters now deliver black-start capability, strengthening HVDC’s value proposition in meshed networks. Extruded-XLPE insulation up to 525 kV reduces weight versus mass-impregnated designs, lowering laying costs. Collectively, these innovations keep the high voltage cables market on a trajectory that gradually tilts capacity additions toward direct current.
By Voltage Level: Ultra-High Voltage Leads Growth Trajectory
Circuits above 330 kV are set to expand at 8.8% CAGR from 2026–2031, fueled by 400 kV, 500 kV, and 525 kV additions that evacuate large-scale renewables. The 115 kV–330 kV band contributed 53.3% of the high voltage cables market size in 2025, providing regional backbone connectivity. India’s 765 kV network compresses rights-of-way, whereas China’s ± 1,100 kV HVDC corridors transmit 10–12 GW over 3,000 km.
Lower bands, such as 66 kV–110 kV, are relegated to sub-transmission upgrades in sub-Saharan Africa and Southeast Asia. Regional voltage preferences, 115 kV, 230 kV, 345 kV in North America, 110 kV, 220 kV, 400 kV in Europe, create engineering complexity for cross-border links. Economic imperatives to minimize line counts and land use will keep utilities migrating toward ultra-high-voltage builds, reinforcing demand momentum across the high-voltage cables market.
Geography Analysis
Asia-Pacific dominated the high voltage cables market with 40.0% share in 2025 and is rising at a 9.6% CAGR through 2031. China energized 3,200 km of ± 800 kV HVDC in 2025 to funnel western renewables eastward, while India approved 8,000 km of 400 kV and 765 kV corridors to connect solar zones. ASEAN’s USD 800 billion grid program and Japan’s 2 GW Akita-Noshiro offshore complex anchor further regional growth.
Europe ranks second, buoyed by offshore wind and cross-border HVDC pledges under the TEN-E framework. The North Sea Wind Power Hub’s 70 GW plan requires 525 kV cables in meshed configurations; Germany’s SuedLink alone spans 2,000 km of ± 525 kV underground route. Public resistance to overhead lines pushes utilities to pricier underground options, sustaining high voltage cables market value despite flat volume growth.
North America focuses on renewables integration and resilience. The TransWest Express ± 600 kV project broke ground in 2025, connecting Wyoming wind to Nevada and California over 730 miles, while Quebec’s hydro exports demand 320 kV HVDC upgrades. The Middle East leverages surplus solar to plan the 3 GW Saudi-Greece interconnector, and South Africa accelerates 400 kV builds to stabilize Eskom’s grid. South America advances 500 kV HVAC corridors across Brazil and Argentina, benefitting regional suppliers. These developments collectively amplify global appetite for high-voltage cables market solutions.

Competitive Landscape
Prysmian Group led with roughly 25% revenue in 2025, Nexans held 12%, and NKT, Siemens Energy, and ABB chased turnkey packages that combine cable, installation, and lifecycle services. Prysmian’s General Cable buyout widened its U.S. footprint, while Nexans divested low-value units to zero in on high-voltage and subsea. Offshore installation vessels have become a tactical differentiator; owning a specialized fleet ensures schedule control and pricing premiums during narrow weather windows.
Regional challengers such as LS Cable & System, Elsewedy Electric, and Jiangsu Zhongtian Technology exploit lower labor costs and proximity to growth hubs, pressuring incumbents to localize manufacturing. Patent filings covering XLPE formulation and fiber-optic sensing reached 47 in 2025, up 47% from 2023, signaling a technology race. Real-time health monitoring and IEC 61850 plug-and-play standards tilt procurement toward suppliers that can bundle hardware with analytics, reshaping competitive dynamics across the high voltage cables market.
White-space opportunities abound in tier-2 Asian and African cities upgrading from 66 kV to 132 kV feeds, and in hydrogen-ready corridors in Germany and Australia. Smaller entrants like Taihan and KEI Industries pursue integrated EPC offerings priced 15–20% below incumbents. Such cost-centric strategies attract capital-constrained developers but could spark margin erosion industry-wide if volumes fail to scale.
High Voltage Cables Industry Leaders
Prysmian Group
Nexans SA
NKT A/S
LS Cable & System
Sumitomo Electric
- *Disclaimer: Major Players sorted in no particular order

Recent Industry Developments
- January 2026: Nexans, a French cable manufacturer, successfully installed a high-voltage subsea cable for Italy's Tyrrhenian Link project. Setting a world record, the company achieved an installation depth of 2,150 meters for a 500 kV HVDC subsea cable, linking Sicily, Sardinia, and mainland Italy.
- July 2025: In a significant move towards sustainability, RTE and Nexans have unveiled France's inaugural closed-loop aluminum cable recycling system. Their ambitious goal is to recycle 600 tonnes of aluminum each year, thereby reducing emissions and enhancing circularity in the nation's electricity transmission networks.
- April 2025: At Middle East Energy 2025 in Dubai, Ducab Group unveiled the GCC region's inaugural high-voltage fiber optic cable. This marks a significant technological advancement for the region's HV infrastructure, enhancing high-speed monitoring and communication within power cable systems.
- March 2025: Prysmian Group has unveiled a pioneering 245 kV HVAC cable system, specifically engineered for floating offshore wind projects. This marks the industry's inaugural portfolio spanning from 72.5 kV to 245 kV, all tailored for dynamic offshore environments.


Global High Voltage Cables Market Report Scope
High-voltage cables are specialized electrical cables designed to transmit electricity at high voltage levels. They play a crucial role in transmitting and distributing electrical power over long distances and are essential components of modern power infrastructure. High-voltage cables connect power plants to substations, interconnect different parts of a power grid, and transport electricity from generation sources to consumption centers.
The high voltage cables market is segmented by location of deployment, type of transmission, voltage level, and geography. By location of deployment, the market is segmented into overhead, underground, and submarine cables. By type of transmission, the market is segmented into high-voltage direct current (HVDC) and high-voltage alternating current (HVAC). By voltage level, the market is segmented into 66 kV–110 kV, 115 kV–330 kV, and above 330 kV. The report also covers the market sizes and forecasts for the high voltage cables market across major countries within these regions. For each segment, market sizing and forecasts are provided on the basis of value (USD).
| Overhead Cables |
| Underground Cables |
| Submarine Cables |
| HVDC |
| HVAC |
| 66 kV to 110 kV |
| 115 kV to 330 kV |
| Above 330 kV |
| North America | United States |
| Canada | |
| Mexico | |
| Europe | Germany |
| United Kingdom | |
| France | |
| Italy | |
| Russia | |
| Rest of Europe | |
| Asia Pacific | China |
| India | |
| Japan | |
| South Korea | |
| ASEAN Countries | |
| Rest of Asia Pacific | |
| South America | Brazil |
| Argentina | |
| Rest of South America | |
| Middle East and Africa | Saudi Arabia |
| United Arab Emirates | |
| South Africa | |
| Egypt | |
| Rest of Middle East and Africa |
| By Location of Deployment | Overhead Cables | |
| Underground Cables | ||
| Submarine Cables | ||
| By Type of Transmission | HVDC | |
| HVAC | ||
| By Voltage Level | 66 kV to 110 kV | |
| 115 kV to 330 kV | ||
| Above 330 kV | ||
| By Geography | North America | United States |
| Canada | ||
| Mexico | ||
| Europe | Germany | |
| United Kingdom | ||
| France | ||
| Italy | ||
| Russia | ||
| Rest of Europe | ||
| Asia Pacific | China | |
| India | ||
| Japan | ||
| South Korea | ||
| ASEAN Countries | ||
| Rest of Asia Pacific | ||
| South America | Brazil | |
| Argentina | ||
| Rest of South America | ||
| Middle East and Africa | Saudi Arabia | |
| United Arab Emirates | ||
| South Africa | ||
| Egypt | ||
| Rest of Middle East and Africa | ||


Key Questions Answered in the Report
What is the current value of the high voltage cables market?
The high voltage cables market was valued at USD 39.85 billion in 2026 and is forecast to reach USD 56.26 billion by 2031.
Which region leads demand growth for high-voltage cables?
Asia-Pacific leads, holding 40.0% share in 2025 and growing at a projected 9.6% CAGR on the back of Chinese, Indian, and ASEAN transmission expansions.
Are HVDC cables overtaking HVAC in new projects?
HVDC lines remain a minority by installed base but are projected to expand at 8.1% CAGR through 2031, faster than HVAC, driven by offshore wind exports and intercontinental interconnectors.
What is the biggest challenge to timely project delivery?
Lengthy permitting and a shortage of certified jointing technicians extend lead times, inflating holding costs and risking schedule slippage, especially in Europe and North America.
Which company holds the largest market share?
Prysmian Group leads with an estimated 25% global revenue share, supported by vertical integration and a strong subsea installation fleet.
Page last updated on:


