
Medium Voltage Switchgear Market Size and Share
Market Overview
| Study Period | 2021 - 2031 |
|---|---|
| Market Size (2026) | USD 43.47 Billion |
| Market Size (2031) | USD 55.08 Billion |
| Growth Rate (2026 - 2031) | 4.85 % |
| Fastest Growing Market | Asia-Pacific |
| Largest Market | Asia Pacific |
| Market Concentration | Medium |
Major Players *Disclaimer: Major Players sorted in no particular order Image © Mordor Intelligence. Reuse requires attribution under CC BY 4.0. | |
Medium Voltage Switchgear Market Analysis by Mordor Intelligence
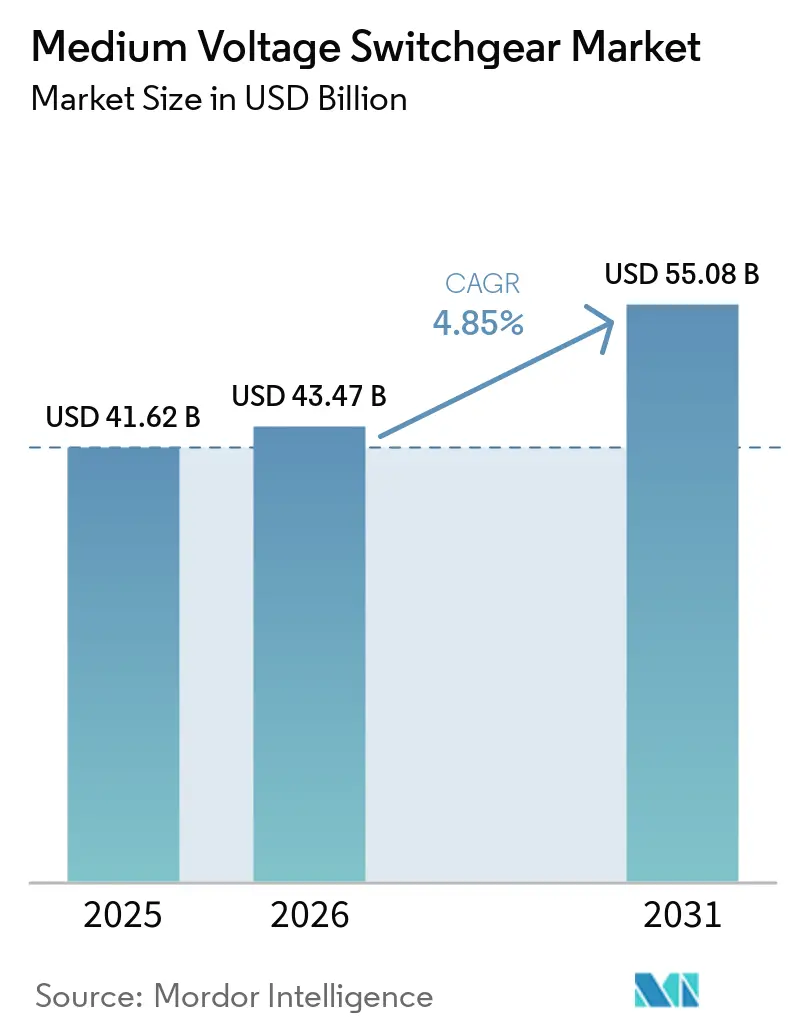
The Medium Voltage Switchgear Market size is expected to grow from USD 41.62 billion in 2025 to USD 43.47 billion in 2026 and is forecast to reach USD 55.08 billion by 2031 at 4.85% CAGR over 2026-2031.
Transmission and distribution modernization programs, mandates to integrate renewable generation, and the rapid uptake of compact gas-insulated equipment in space-constrained assets such as data centers and urban micro-substations are shaping demand. Although air-insulated designs retained a 43.1% medium-voltage switchgear market share in 2025, the strongest growth is shifting toward solid-dielectric, vacuum, and fluoronitrile-based “clean-air” systems as the European Union phases out SF₆ in stages. Direct-current architectures are also gaining traction, especially in hyperscale computing facilities moving to 48 VDC and 380 VDC distribution. Asia-Pacific remains pivotal, accounting for 40.3% of 2025 revenue and benefiting from multi-billion-dollar grid investments across China, India, and the ASEAN bloc. Indoor installations led with 61.5% of deployments thanks to urban land pressures, while the residential segment is the fastest-growing end-user as rooftop solar, home storage, and neighborhood microgrids proliferate.
Key Report Takeaways
- By insulation, air-insulated switchgear held 43.1% of 2025 revenue; SF₆-free alternatives are forecast to advance at a 10.5% CAGR through 2031.
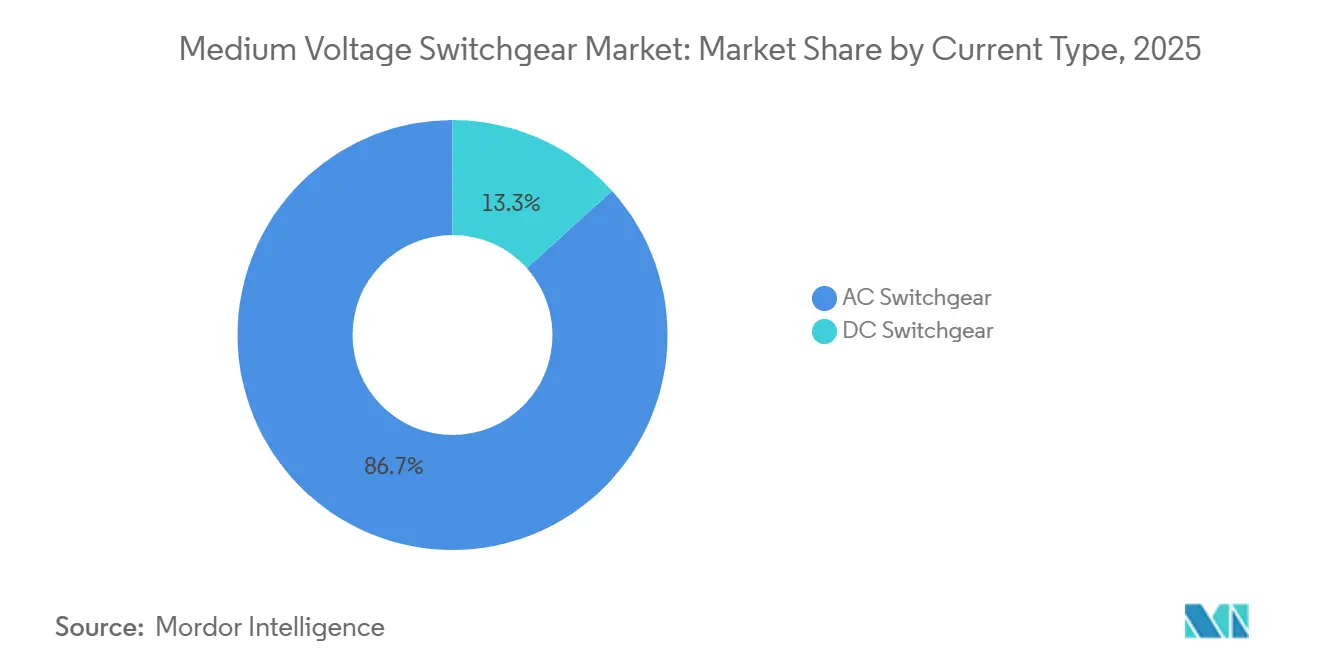
- By current type, AC equipment captured 86.7% of the 2025 medium-voltage switchgear market size, while DC variants are rising at a 6.3% CAGR to 2031.
- By installation, indoor configurations represented 61.5% of 2025 revenue and are set to expand at a 5.7% CAGR over the forecast period.
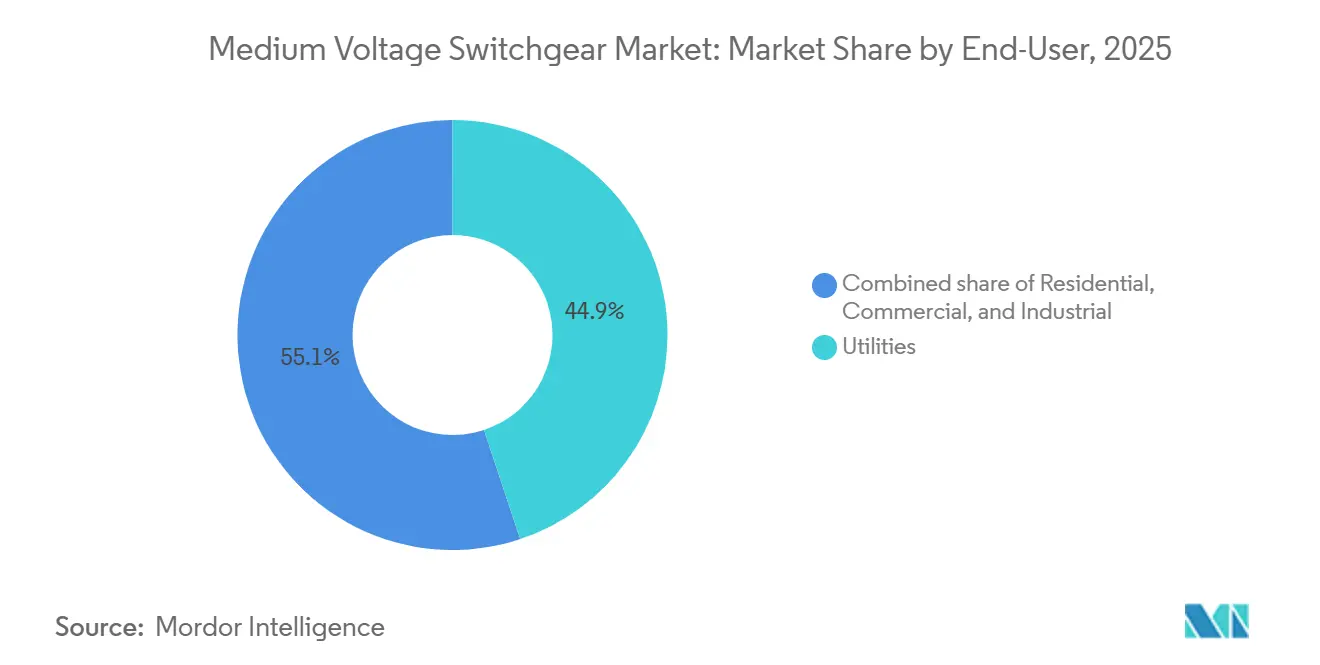
- By end-user, utilities controlled 44.9% of 2025 spending; the residential segment is accelerating at a 7.2% CAGR on the back of distributed energy resources.
- By geography, Asia-Pacific generated 40.3% of global revenue in 2025 and is projected to grow at a 6.8% CAGR through 2031.
Note: Market size and forecast figures in this report are generated using Mordor Intelligence’s proprietary estimation framework, updated with the latest available data and insights as of January 2026.
Market Trends and Insights
Drivers Impact Analysis of Medium Voltage Switchgear Market*
| Driver | (~) % Impact on CAGR Forecast | Geographic Relevance | Impact Timeline |
|---|---|---|---|
| T&D infrastructure investments | +1.2% | North America, Asia-Pacific, Middle East | Medium term (2-4 years) |
| Renewable-integration upgrade cycle | +1.0% | Asia-Pacific, Europe, South America | Long term (≥ 4 years) |
| Urban reliability & micro-substation build-out | +0.6% | North America, Europe, Asia-Pacific urban centers | Medium term (2-4 years) |
| Smart-grid & digital substation roll-outs | +0.5% | North America, Europe, early adoption in South Korea, Japan | Medium term (2-4 years) |
| Data-center-led demand for compact GIS | +0.4% | North America, Europe, Singapore, Hong Kong | Short term (≤ 2 years) |
| Undergrounding projects in dense cities | +0.3% | Europe, North America, select Asia-Pacific metros | Long term (≥ 4 years) |
| Source: Mordor Intelligence | |||
T&D Infrastructure Investments
Utilities are ramping up capital outlays to replace aging assets and ease capacity bottlenecks. The U.S. spent USD 50.9 billion on distribution assets in 2023, with substation equipment absorbing USD 6.1 billion.[1]U.S. Energy Information Administration, “Electric Power Annual 2023,” eia.gov Washington followed with USD 10 billion for grid hardening and another USD 12.7 billion across GRIP and transmission facilitation programs in 2024. ASEAN members have earmarked USD 290 billion for cross-border interconnections through 2035.[2]ASEAN Centre for Energy, “ASEAN Energy Infrastructure Outlook,” aseanenergy.org Because each new substation typically installs 4-12 medium-voltage bays, these allocations funnel directly into the medium-voltage switchgear market. Modular factory-built yards are shortening construction schedules by 20-30%, allowing owners to energize capacity sooner and cut overrun risk.
Renewable-Integration Upgrade Cycle
Variable renewables now compel grid operators to handle bidirectional power and quicker fault clearing. India’s cumulative renewable base hit 203 GW in 2024, and meeting its 500 GW 2030 target requires INR 5.75 trillion (USD 69 billion) of grid upgrades. China installed 300 GW of new renewables in 2024 and budgeted USD 546 billion for network expansion.[3]State Grid Corporation of China, “Annual Report 2024,” sgcc.com.cn IEEE-2800 is pushing for IEC 61850-ready protection schemes, while Europe’s 111 GW offshore wind fleet requires marine-rated gear. The International Energy Agency foresees 1,200 GW of variable renewables on grids by 2030, translating into a 40% rise in medium-voltage switchgear at collection points.[4]International Energy Agency, “Renewable Energy Market Update 2024,” iea.org
Urban Reliability & Micro-Substation Build-Out
Dense cities are installing micro-substations to curb outages and hide equipment. Con Edison’s USD 5 billion plan in New York deploys 27 kV and 13.8 kV compact yards inside buildings. London has invested GBP 3 billion (USD 3.8 billion) in underground cables and secondary substations. Singapore mandates 24 kV and 36 kV GIS in land-scarce zones. Seismic-resilient underground stations in Tokyo further highlight urban demand. Each micro-facility usually needs only a handful of bays, but the high number of sites aggregates to meaningful volumes in the medium-voltage switchgear market.
Smart-Grid & Digital Substation Roll-Outs
IEC 61850 process-bus architectures cut commissioning time by up to 40% and enable predictive maintenance that reduces unplanned outages by 20-30%. The United States has earmarked USD 96 billion over five years for smart-grid deployments. Siemens Energy’s Blue GIS embeds sensors that watch gas density, temperature, and partial discharge in real time. Schneider Electric links switchgear to cloud analytics to detect failure patterns months in advance. South Korea has already digitized 40% of its distribution network, trimming outage duration by 25%. Cyber-secure communication per IEC 62351 now adds roughly 8% to system cost but is rapidly becoming mandatory for critical infrastructure.
Restraints Impact Analysis of Medium Voltage Switchgear Market*
| Restraint | (~) % Impact on CAGR Forecast | Geographic Relevance | Impact Timeline |
|---|---|---|---|
| SF₆ environmental restrictions | -0.8% | Europe (immediate), North America & Asia-Pacific (phased) | Short term (≤ 2 years) |
| High capex of GIS vs AIS | -0.5% | Global, acute in price-sensitive emerging markets | Medium term (2-4 years) |
| Supply-chain lead-time spikes post-2023 | -0.3% | Global, lingering in North America and Europe | Short term (≤ 2 years) |
| Solid-state protection cannibalizing MV bays | -0.2% | North America and Europe | Long term (≥ 4 years) |
| Source: Mordor Intelligence | |||
SF₆ Environmental Restrictions
The EU bans SF₆ in ≤24 kV gear from January 2026 and in 24-52 kV equipment by 2030. ABB’s AirPlus and Siemens Energy’s Blue GIS reduce global-warming potential 99% but add 8-12% to cost. Vacuum interrupters, dominant in Japan, remove gas altogether yet top out at 40.5 kV. The United States still relies on voluntary SF₆ curbs, letting OEMs ship legacy designs to unregulated regions.
High Capex of GIS vs AIS
A 24 kV GIS bay costs USD 80,000-120,000 versus USD 50,000-70,000 for AIS, curbing uptake in price-sensitive grids. However, lifecycle studies show GIS can be 15-20% cheaper in dense cities once land and downtime are priced in. Rural electrification in India and sub-Saharan Africa still favors AIS despite larger footprints.
*Our forecasts treat driver/restraint impacts as directional, not additive. The impact forecasts reflect baseline growth, mix effects, and variable interactions.
Medium Voltage Switchgear Market Segment Analysis
By Insulation:
SF₆-Free Alternatives Reshape Competitive DynamicsAlternative insulation platforms are expanding at a 10.5% CAGR, far faster than the mature gas-insulated and the cost-oriented air-insulated lines. The European SF₆ prohibition for ≤24 kV gear from 2026 and for up to 52 kV by 2030 is the primary catalyst. Solid-dielectric and vacuum technologies eliminate gas leakage and double maintenance intervals to every 10 years. Vacuum circuit breakers already command 70% of Japan’s medium-voltage market.
Air-insulated gear keeps its cost edge, especially in rural or industrial lots where footprint is secondary. Gas-insulated lines remain the choice for data centers, offshore installations, and dense cities because they occupy up to 40% less floor space. Clean-air GIS, launched by Hitachi Energy in 2024, secured its first 145 kV order in Germany. The premium for SF₆-free designs is shrinking as economies of scale build, but capital-tight utilities in developing regions still rely on AIS. Even so, the ongoing substitution means the medium-voltage switchgear market will see rapid share shifts toward clean alternatives over the forecast horizon.
By Current Type:
DC Architectures Gain Traction in Data Centers and RenewablesAC equipment retained 86.7% share of the 2025 medium-voltage switchgear market size, reflecting its entrenched role in long-distance transmission. Yet DC switchgear is rising 6.3% annually as hyperscale cloud firms adopt 380 VDC buses to eliminate conversion losses. The U.S. NEVI program’s 500,000 fast chargers also require medium-voltage DC interface gear.
Solar-plus-storage developers are coupling PV arrays with batteries on a shared DC bus, improving round-trip efficiency 3-5 percentage points. India’s 15 GW of DC-coupled solar-storage illustrates the opportunity. Though DC bays cost 15-20% more than AC, efficiency savings and smaller footprints offset the premium in data centers, EV charging hubs, and renewables. Eaton’s 1,500 VDC portfolio with 2-millisecond solid-state interruption lowers a past technical barrier.



By Installation:
Indoor Configurations Dominate Urbanization and DigitalizationIndoor switchgear represented 61.5% of 2025 revenue and is on track for a 5.7% CAGR through 2031. Compact GIS saves up to 40% of floor space, critical where land costs top USD 500 per m². Singapore’s regulator requires indoor substations for new urban developments, pushing 24 kV and 36 kV GIS as de facto standards.
Outdoor AIS, still cheaper upfront, holds sway in rural electrification drives. India’s village program continues to specify outdoor line-ups at USD 50,000-70,000 per bay. Nevertheless, urban planners prefer indoor yards because IEC 61850 servers, fiber gateways, and cybersecurity hardware need climate-controlled environments. Schneider Electric’s edge devices now ship IP54-rated enclosures bundled with switchgear, reinforcing the indoor pivot.
By End-User:
Residential Segment Leads Growth Amid Electrification WaveUtilities commanded 44.9% of 2025 spending, but residential demand is advancing 7.2% annually, the fastest among segments. U.S. households added 6.8 GW of rooftop solar and 10.6 GWh of battery storage in 2024, a 55% increase year-on-year. Community microgrids that aggregate dozens of homes behind a shared medium-voltage lineup are multiplying.
Commercial campuses adopt onsite solar and storage to cut demand charges, while mines in Australia, Chile, and South Africa electrify heavy equipment, boosting orders for robust 11 kV and 33 kV switchgear. Codelco’s USD 1.5 billion electrification drive illustrates mining’s pull. The distributed trend shifts capex from central substations toward neighborhood and facility-level switchgear, underpinning medium-voltage switchgear market growth despite emerging volume-reduction technologies.
Geography Analysis
APAC Medium Voltage Switchgear Market
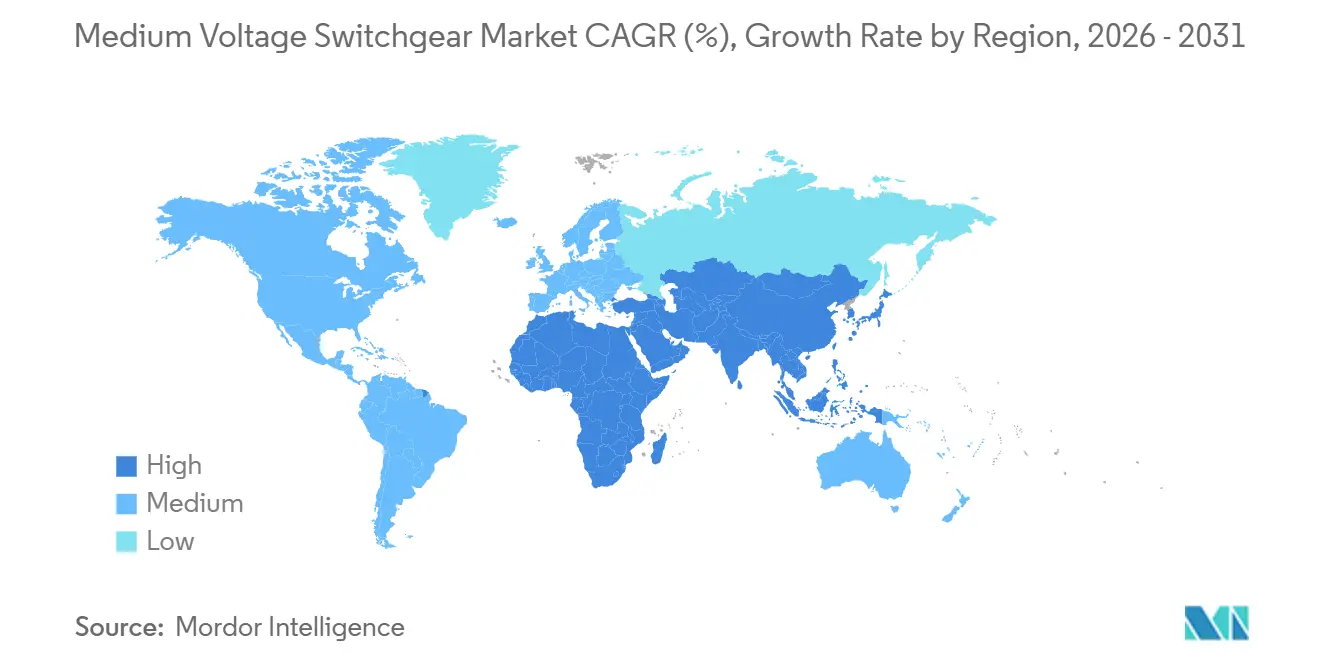
Asia-Pacific generated 40.3% of 2025 revenue and is forecast to grow at a 6.8% CAGR through 2031. China’s USD 546 billion grid plan covers everything from ultra-high-voltage lines to district-level automation. India is channeling INR 5.75 trillion (USD 69 billion) into evacuation corridors for its 500 GW renewable ambition. ASEAN is investing USD 290 billion to stitch together a regional supergrid.
North America and Europe Medium Voltage Switchgear Market
Washington’s USD 13 billion modernization package, plus Canada’s net-zero-electricity goal by 2035, gives the region strong forward visibility. Data-center clustering in Northern Virginia and the Pacific Northwest adds a concentrated pocket of demand for SF₆-free GIS. Europe’s roadmap revolves around integrating 300 GW of offshore wind by 2050 and decarbonizing distribution networks per the Green Deal. Germany alone earmarked EUR 20 billion for north-south corridors, while the United Kingdom plans GBP 58 billion in network upgrades.
MEA, South America and Oceania Medium Voltage Switchgear Market
The Middle East and Africa are smaller but are accelerating. Saudi Arabia’s USD 500 billion NEOM project and the UAE’s USD 163 billion grid program prioritize compact, digital gear for smart-city campuses. South America benefits from Brazil’s 7,000 km transmission expansion and Chile’s mining electrification initiatives, while Australia integrates 5 GW of new renewables annually and scales battery storage to balance its high variable-renewable system.
Mordor Intelligence provides coverage of the medium voltage switchgear market across other key regional markets, including Europe, Middle East and Africa, North America, and Asia, each with their regulatory frameworks and demand patterns.

Regulatory Landscape
Regulatory frameworks increasingly shape medium-voltage switchgear design and procurement. The European Union F-gas Regulation (EU 2024/573) sets deadlines for SF6 phase-down, banning SF6 in new MV switchgear below 24 kV from January 1, 2026, and restricting 24-52 kV equipment from January 1, 2030. This timing is pushing buyers toward SF6-free and low-GWP alternatives across the 1-52 kV class.
Product qualification and grid acceptance remain tied to international standards. IEC 62271-200 governs AC metal-enclosed switchgear above 1 kV up to 52 kV, while IEEE C37.20.2-2025 covers metal-clad switchgear from 4.76 kV to 48.3 kV. Jurisdictional RoHS and REACH compliance further shapes specifications for materials, documentation, and supplier qualification.
Competitive Landscape
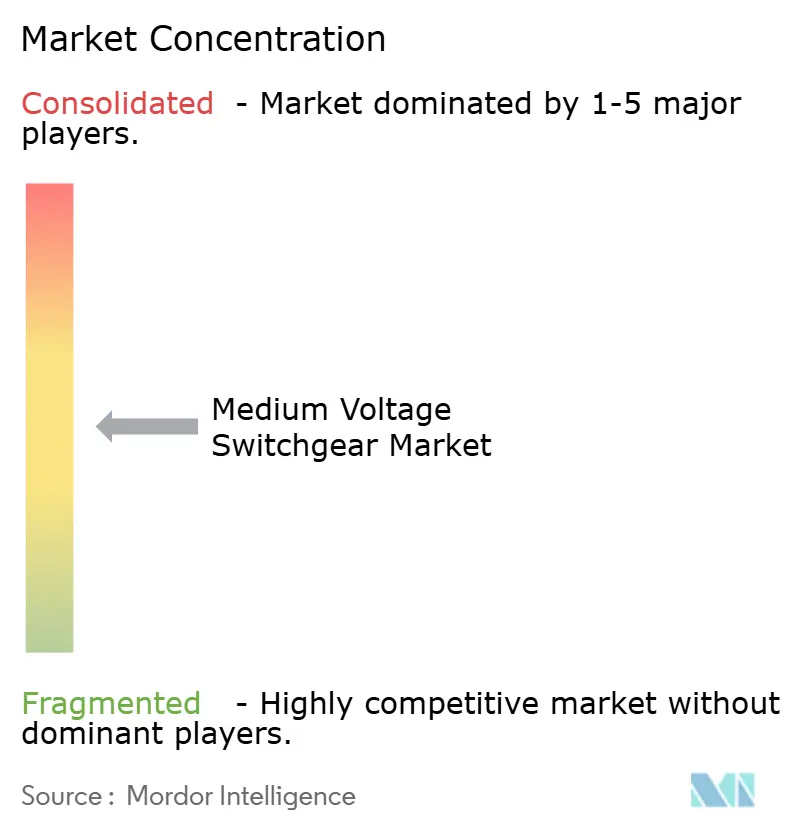
The five largest suppliers, Siemens Energy, Schneider Electric, Hitachi Energy, ABB, and Eaton, control about half of global revenue, with regional challengers such as CHINT, Hyosung, and CG Power adding another 15-20%. The strategic battleground spans SF₆-free technology, digital substations, and emerging DC platforms. Siemens Energy’s Blue GIS, certified to IEC 62271-1, posted more than 50 European installs by late-2024. ABB lifted Electrification revenue 16% year-on-year in Q3 2024 on data-center and renewable orders. Schneider Electric’s cloud-linked monitoring reduces unplanned downtime by up to 30% and has become a key differentiator.
Eaton’s xEnergy 1,500 VDC gear is among the first utility-grade DC offerings, landing contracts with hyperscale operators. NOJA Power is finding success with reclosers for rural fault isolation, while Ormazabal tailors compact stations for Latin America at a cost of 15-20% below European imports. IEC 62351 cybersecurity compliance raises R&D hurdles, favoring incumbents with deeper engineering benches and certification pipelines.
Medium Voltage Switchgear Industry Leaders
Schneider Electric SE
Siemens AG
Hitachi ABB Power Grids Ltd
General Electric Company
- *Disclaimer: Major Players sorted in no particular order
Medium Voltage Switchgear Market Companies Covered in this Report
- Hitachi Energy
- Siemens Energy
- Schneider Electric
- Eaton Corp plc
- General Electric
- Mitsubishi Electric
- Toshiba Corp.
- CHINT Group
- Hyosung Heavy Industries
- BHEL
- Powell Industries
- Lucy Group
- Fuji Electric
- Efacec Power Solutions
- CG Power & Industrial Solutions
- NOJA Power
- Ormazabal
- Hyundai Electric
- Meidensha Corp.
- Legrand SA
- Schweitzer Engineering Labs (SEL)

Market Opportunities and Future Outlook
SF6-free, clean-air, and vacuum insulation platforms are gaining traction as regulatory restrictions tighten and utilities look to reduce environmental footprints. In France, Enedis procurement frameworks point to fluorine-free technology deployment across 12-36 kV classes, which shows how SF6-free insulation is translating into utility purchasing decisions.
Manufacturers are also adding manufacturing capacity and localizing production to keep pace with grid modernization, data center growth, and urban micro-substation build-outs. The evidence in the record includes ABB's 2026 European investment to expand air-insulated and SF6-free MV switchgear capacity in Europe, Eaton's Nebraska facility to serve AI data center demand, and Efacec's ENEDIS framework agreements for fluorine-free MV switchgear in France.
Recent Industry Developments in Medium Voltage Switchgear Market
- May 2026: ABB invested $200 million across Europe to accelerate grid transformation, including $100 million in Dalmine, Italy, to expand production capacity for air-insulated and SF6-free medium-voltage switchgear. The expansion supports SF6-free deployment and strengthens the European manufacturing footprint for grid modernization demand.
- May 2026: Efacec secured multi-year framework agreements with Enedis to supply medium-voltage switchgear for grid modernization in France, featuring fluorine-free technology. The arrangement supports a SF6-free transition and expands the use of fluorine-free technology in key EU utility projects.
- April 2026: Eaton announced a $30 million investment in a new 370,000-square-foot manufacturing facility in Bellevue, Nebraska, to increase medium-voltage switchgear production for AI data center demand. The expansion adds regional capacity to support AI data center growth and related grid modernization needs.


Medium Voltage Switchgear Market Report Scope and Research Methodology
Market Definition and Coverage
This market covers revenues earned from medium-voltage switchgear used to control, protect, and isolate electrical circuits in power distribution networks across key end users and geographies.
Scope exclusions: Low-voltage switchgear, high-voltage switchgear, and related services like long-term maintenance contracts are excluded from this sizing.
Segments Covered in This Report
- By Insulation
- Gas Insulated Switchgear (GIS)
- Air Insulated Switchgear (AIS)
- Others
- By Current Type
- AC Switchgear
- DC Switchgear
- By Installation
- Indoor
- Outdoor
- By End-User
- Utilities
- Residential
- Commercial
- Industrial
- By Geography
- North America
- United States
- Canada
- Mexico
- Europe
- Germany
- United Kingdom
- France
- Italy
- Spain
- Russia
- Rest of Europe
- Asia-Pacific
- China
- India
- Japan
- South Korea
- Australia and New Zealand
- Rest of Asia-Pacific
- South America
- Brazil
- Argentina
- Chile
- Rest of South America
- Middle East and Africa
- Saudi Arabia
- United Arab Emirates
- South Africa
- Egypt
- Rest of Middle East and Africa
- North America
Data Sources, Market Sizing, and Validation
Desk Research
Desk research was used to build the fact base for demand triggers and to keep terminology consistent across countries, where voltage classes and naming can differ. We relied on public power and grid data, plus standards language, to align the model with real-world equipment needs and replacement cycles.
Sources included non-paywalled references such as the International Energy Agency (electricity generation) and grid investment context, the World Bank for macro and electrification indicators, UN Comtrade for trade signals on electrical apparatus, and government energy agencies and grid operators for transmission and distribution plans. We also reviewed standards and technical publications from IEC and IEEE, plus annual reports, investor presentations, and reputable press coverage. Select paid databases were used only for company financials, patent tracking, and shipment-level trade checks when public data lacked consistency. This list is illustrative, and many other sources were also reviewed for data collection, validation, and clarification.
Primary Interviews and Surveys
Primary work was used to pressure-test the desk assumptions and translate project and policy signals into realistic ordering patterns. Interviews included manufacturers, distributors, EPC and panel partners, utilities, and large industrial buyers across major regions, so pricing, lead times, and technology mix (AIS versus GIS, and SF6-free transitions) could be reflected consistently. These discussions also helped resolve gaps such as typical replacement timing, indoor versus outdoor preferences, and the share of AC versus DC use cases.
Distribution of primary research fieldwork respondents
| Company type | Respondent position | Region |
|---|---|---|
| Top tier: 34% | CXOs: 12% | APAC: 49% |
| Mid tier: 45% | Functional/Unit leaders: 38% | EMEA: 30% |
| Smaller Players: 21% | Managers: 50% | Americas: 21% |
Market-Sizing & Forecasting
Sizing started with a top-down build where power-sector capex signals and grid expansion programs were translated into a switchgear demand pool, and then split by technology and use setting using observed adoption patterns. Once that total was formed, it was cross-checked with selective bottom-up approximations, such as rolling up sampled supplier revenues, validating channel price bands, and sanity-checking implied volumes using typical unit pricing by insulation type and installation.
The model was guided by market fingerprints that tend to move switchgear demand in a visible way, including electricity demand growth, transmission and distribution spending plans, renewable capacity additions that drive new substations, urban construction and industrial output trends, and the pace of substation refurbishment. Inputs also reflected the technology shift away from SF6 in certain applications, which tends to affect average selling prices and product mix more than headline unit counts. For forecasting, we used scenario analysis with a base case tied to public grid and generation pipelines, then adjusted the slope using expert consensus on lead times, pricing progression, and project execution risks. Where bottom-up inputs were missing for smaller countries, proxies were used from trade and grid investment ratios, and then normalized during regional review.
Data Validation & Update Cycle
Outputs were validated through triangulation across independent signals, such as implied switchgear intensity versus grid capex, regional trade flows, and the direction of technology mix reported by practitioners. Outliers were investigated at the country and segment level, and then the assumptions were re-checked with follow-up outreach when the variance was not explainable by known events.
A multi-step analyst review is used before sign-off so math checks, unit consistency, and currency conversions are verified, followed by a final logic review that compares results with observed project momentum. Reports are refreshed annually, and interim updates are made when material events occur, such as regulatory moves on insulating gases or sharp shifts in grid spending. Before delivery, a fresh pass is completed so clients receive the latest updated view.
Mordor Intelligence's Medium Voltage Switchgear Market Size Versus Other Published Estimates
Published market values for medium voltage switchgear can look far apart because the scope line is not the same across sources, and because pricing and mix assumptions are handled differently. Differences also come from the time window used for currency conversion, and from how quickly newer trends like SF6-free adoption are reflected in average selling prices.
Low-voltage and high-voltage switchgear sit outside Mordor Intelligence's scope, which is a common reason some totals appear larger when adjacent voltage classes are bundled together. Another gap driver is whether estimates include services, retrofits, and long-term maintenance, which can inflate the revenue base if counted alongside equipment sales. Finally, some publishers assume faster price expansion for GIS or apply aggressive project execution rates, while others use conservative rollout timing for utilities and industrial upgrades.
Benchmark comparison
| Source | Market Size | Gaps in Research Methodology |
|---|---|---|
| Mordor Intelligence | USD 43.47 B (2026) | |
| Global Consultancy A | USD 42.87 B (2023) | Uses an earlier base year and may apply a different price-mix split across AIS and GIS, which can shift the revenue level even if unit demand is similar. |
| Trade Journal B | USD 37.00 B (2022) | Reported as a rounded revenue figure and appears to use a broader voltage definition range (extending above typical MV cutoffs), plus older currency timing and a less explicit split by end-user and installation. |
The spread in the table is largely explained by what is included as switchgear revenue, which year is treated as the reference point, and how technology mix changes are priced over time. By keeping the scope tied to medium-voltage equipment sales and validating totals with independent demand signals and practitioner checks, the final number stays traceable to repeatable steps and clear inputs.


Key Questions Answered in the Report
What is the projected value of the medium-voltage switchgear market in 2031?
It is expected to reach USD 55.08 billion, reflecting a 4.85% CAGR from 2026 to 2031.
Which insulation technology is growing fastest?
SF₆-free options using solid dielectrics, vacuum, and fluoronitrile-based clean air are expanding at a 10.5% CAGR as regulators restrict SF₆ use.
Why is Asia-Pacific the largest regional contributor?
Massive grid investments in China and India, coupled with rapid urbanization and renewable additions, give Asia-Pacific a 40.3% revenue share and the highest growth rate.
How is the residential segment influencing demand?
Rooftop solar and battery adoption are driving a 7.2% CAGR for residential installations, shifting switchgear spending toward neighborhood microgrids.
What role does digitalization play in market growth?
IEC 61850-compliant digital substations cut commissioning time up to 40% and enable predictive maintenance, reinforcing demand for intelligent switchgear.
How are SF₆ bans shaping product development?
The EU’s phased ban compels OEMs to commercialize clean-air and fluoronitrile-based GIS, accelerating the shift to low-GWP equipment worldwide.
Page last updated on:


 Your data is secure and never sold or shared.


