
Healthcare Factoring Services Market Size and Share
Market Overview
| Study Period | 2020 - 2031 |
|---|---|
| Market Size (2026) | USD 236.10 Billion |
| Market Size (2031) | USD 304.20 Billion |
| Growth Rate (2026 - 2031) | 5.20 % |
| Fastest Growing Market | Asia-Pacific |
| Largest Market | Europe |
| Market Concentration | Low |
Major Players *Disclaimer: Major Players sorted in no particular order Image © Mordor Intelligence. Reuse requires attribution under CC BY 4.0. | |
Healthcare Factoring Services Market Analysis by Mordor Intelligence
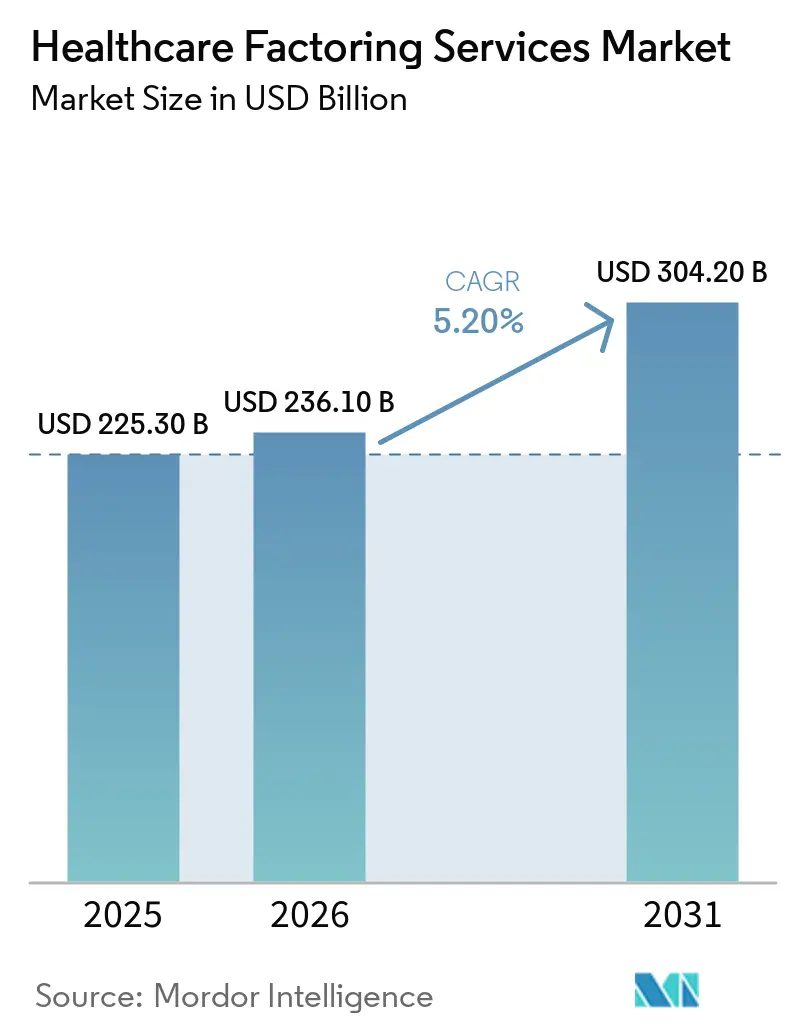
The Healthcare Factoring Services Market size is expected to grow from USD 225.30 billion in 2025 to USD 236.10 billion in 2026 and is forecast to reach USD 304.20 billion by 2031 at 5.20% CAGR over 2026-2031.
The healthcare factoring services market is supported by a persistent mismatch between care delivery costs and payer reimbursement timing. Providers often carry immediate payroll, supply, and operating costs while government and commercial payer claims take 60 to 120 days to settle. This timing gap makes receivables financing a recurring liquidity tool for hospitals, staffing businesses, and post-acute providers. Payer denials and post-payment recoveries add uncertainty to the value of receivables, which increases demand for specialist underwriting. Funding embedded in billing and revenue cycle workflows may also reduce origination costs and widen access for providers that have limited treasury resources.
Key Report Takeaways
- By receivable origin, provider-to-payer claims captured 72.3% of the healthcare factoring services market share in 2025, while healthcare-supplier business-to-business invoices are projected to grow at 6.4% CAGR through 2031.
- By client type, hospitals and health systems accounted for 38.5% of the healthcare factoring services market share in 2025, while post-acute and community care providers are forecast to expand at 6.6% CAGR through 2031.
- By recourse structure, recourse factoring held 80.4% of the healthcare factoring services market share in 2025, while non-recourse factoring is projected to grow at 5.9% CAGR through 2031.
- By distribution channel, bank and bank-owned factors held 51.1% of the healthcare factoring services market share in 2025, while specialist healthcare factors are projected to grow at 8.0% CAGR through 2031.
- By category, domestic transactions captured 92.6% of the healthcare factoring services market share in 2025, while international factoring is projected to grow at 10.2% CAGR through 2031.
- By enterprise size, large healthcare enterprises accounted for 58.8% of the healthcare factoring services market share in 2025, while small and medium-sized enterprises are forecast to grow at 6.1% CAGR through 2031.
- By geography, Europe held 39.1% of the healthcare factoring services market share in 2025, while Asia-Pacific is projected to expand at 7.0% CAGR through 2031.
Note: Market size and forecast figures in this report are generated using Mordor Intelligence’s proprietary estimation framework, updated with the latest available data and insights as of January 2026.
Global Healthcare Factoring Services Market Trends and Insights
Drivers Impact Analysis*
| Driver | (~) % Impact on CAGR Forecast | Geographic Relevance | Impact Timeline |
|---|---|---|---|
| Long Payer Reimbursement Cycles and Provider Liquidity Gaps | +1.3% | Global, most acute in North America | Short term (≤ 2 years) |
| Complex Claims and Reimbursement Processes | +0.8% | Global | Medium term (2-4 years) |
| Expansion of Home Healthcare and Staffing-Intensive Models | +1.0% | North America, Europe | Medium term (2-4 years) |
| Digitalization of Claims, Billing, and Remittance Data | +0.7% | Global, led by Asia-Pacific and North America | Medium term (2-4 years) |
| Integration with Billing and Revenue Cycle Management Platforms | +0.6% | North America and the European Union | Long term (≥ 4 years) |
| Demand for Non-Debt Working-Capital Solutions | +0.5% | Global, particularly small and medium-sized enterprises | Short term (≤ 2 years) |
| Source: Mordor Intelligence | |||
Long Healthcare Payer Reimbursement Cycles Creating Provider Working-Capital Gaps
Long reimbursement cycles are a core source of demand in the healthcare factoring services market. Government and commercial payers commonly process claims over 60 to 120 days, while staffing-focused providers meet payroll obligations weekly[1]. The timing difference can affect providers even when the expected receivables are sound. Factoring converts a portion of pending reimbursement into working capital before final settlement. Specialist factors can use payer-specific collection histories to assess the likely value of claims that are initially denied. This capability supports financing for receivable pools that general lenders may not accept.
Rising Complexity of Healthcare Claims and Payer Reimbursement Processes
Complex claim administration extends the period between service delivery and collection. Payer policies, prior authorization requirements, coding errors, and claim adjustments can delay cash receipts for providers. Kodiak Solutions reported that net revenue losses from final denials and bad debt reached USD 48 billion in 2025, compared with USD 38.6 billion in 2024[2]. Its data also showed that the median final denial rate increased from 2.5% to 2.7% over the same period. Longer resolution cycles increase the value of financing that advances cash against eligible claims. The healthcare factoring services market, therefore, benefits when provider cash flows are affected by reimbursement complexity.
Expansion of Home Healthcare and Other Staffing-Intensive Provider Models
Home healthcare and other staffing-intensive models create recurring financing needs because their payroll costs are frequent. The U.S. Bureau of Labor Statistics projects home health and personal care aide employment to rise 17% from 4.35 million in 2024 to 5.09 million in 2034. The home healthcare services sector is projected to add 325,800 jobs over the same period[3]. Home health agencies may meet weekly payroll, while reimbursement can take 75 days or longer in managed service provider arrangements. The Centers for Medicare & Medicaid Services implemented an estimated USD 220 million, or 1.3%, decrease in Medicare payments to home health agencies for calendar year 2026. These conditions make receivables financing more relevant as staffing capacity and operating costs rise.
Growing Digitalization of Claims, Billing and Remittance Data
Digital claims, billing, and remittance data can make receivable verification faster and more consistent. Automated data flows can improve the visibility of claim status, payer responses, and expected collection timing. This information can help factors evaluate advances using more current claim-level records. It can also reduce manual steps during onboarding and servicing. Differences in the quality of provider billing data may allow factors to differentiate advance rates across originators. The healthcare factoring services market can benefit as providers and financing platforms use more connected claims workflows.
Restraints Impact Analysis*
| Restraint | (~) % Impact on CAGR Forecast | Geographic Relevance | Impact Timeline |
|---|---|---|---|
| Payer Denials, Claim Adjustments, and Retroactive Recoupments | -0.6% | North America, European Union | Short term (≤ 2 years) |
| Healthcare Data Privacy and Receivables-Assignment Compliance | -0.4% | Global | Medium term (2-4 years) |
| Payer Concentration and Counterparty Exposure | -0.3% | North America | Medium term (2-4 years) |
| Limited Predictability and Standardization of Receivable Values | -0.3% | Global | Long term (≥ 4 years) |
| Source: Mordor Intelligence | |||
Payer Denials, Claim Adjustments and Retroactive Recoupments
Payer clawbacks and retroactive recoupments can reduce the reliability of financed receivables. Kodiak Solutions reported that insurer clawbacks reached 1.57% of accounts receivable in the first half of 2026, compared with 1.38% in the first half of 2025. Commercial final denial rates also rose 9.1% year over year to 2.89% in 2026. These developments can leave factors exposed when advance rates are based only on initial payer actions. Higher uncertainty may narrow the receivable pools that funders can finance at target returns. The healthcare factoring services market faces a constraint where post-payment actions become less predictable.
Healthcare Data Privacy and Receivables-Assignment Compliance Requirements
Healthcare receivables financing must meet commercial finance and protected health information requirements. A factoring company that receives patient-linked invoice data can be treated as a Business Associate under the HIPAA Privacy Rule. A Business Associate Agreement is required before protected health information is shared in the relevant arrangement. The United States Department of Health and Human Services issued a proposed rule in December 2024 to strengthen the HIPAA Security Rule. The proposal includes requirements covering encryption, multifactor authentication, and vendor records. Compliance costs and onboarding requirements can limit participation by smaller providers and constrain cross-border receivables programs.
*Our forecasts treat driver/restraint impacts as directional, not additive. The impact forecasts reflect baseline growth, mix effects, and variable interactions.
Segment Analysis
By Receivable Origin: Insurance Claims Lead While Supply Chain Invoices Grow Faster
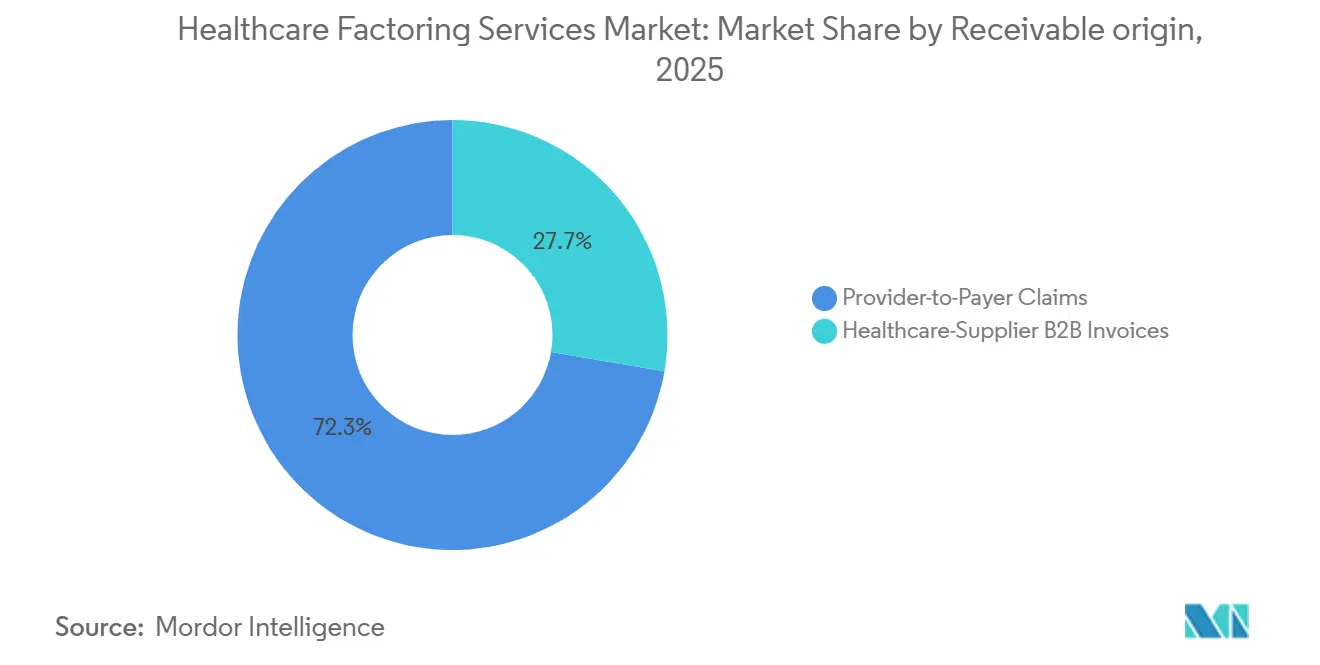
Provider-to-payer claims held 72.3% of the healthcare factoring services market volume in 2025. Insurance and government reimbursement create recurring and documented receivable flows for organized healthcare systems. Medicare, Medicaid, and commercial managed care contracts support large financing facilities because the payment process is established. Government receivables can take longer to collect, but may have lower counterparty default risk than commercial claims. This profile supports bank-owned factors that seek stable collections and controlled credit losses.
Healthcare-supplier business-to-business invoices are projected to grow at 6.4% CAGR through 2031. Medical device producers, pharmaceutical distributors, and specialist procurement firms often supply hospitals on payment terms of 60 days or more. Their receivables face the same timing challenge as clinical providers, although they may have less exposure to insurance claim denials. Beijing West Factoring extended a facility of up to RMB 200 million (USD 27.5 million) to Shouyi Medical in April 2026. The arrangement connected a healthcare procurement platform with specialist supply-chain finance. The healthcare factoring services industry can therefore extend beyond clinical claims as procurement platforms integrate funding capacity.
By Client Type: Hospitals Remain the Volume Base While Post-Acute Providers Expand
Hospitals and health systems represented 38.5% of client volume in 2025. Large and recurring receivable pools support their established relationships with bank-owned financing providers. Hospital consolidation can reduce the number of independent borrowers even as consolidated systems generate more receivables. Physician groups and clinics form a mid-tier client base that includes independent practices and specialty groups. Ancillary providers, such as laboratory operators, durable medical equipment suppliers, pharmacy chains, and ambulance companies, require payer-specific underwriting expertise.
Post-acute and community care providers are projected to grow at 6.6% CAGR through 2031. Home health agencies, skilled nursing facilities, and hospice operators can expand staffing faster than their reimbursements are received. Home-based care employment is projected to rise 17% between 2024 and 2034. Staffing companies also face weekly payroll obligations against remittance cycles of 30 to more than 75 days. The 1.3% Medicare payment decrease for home health agencies in calendar year 2026 adds pressure to provider margins. These conditions make receivables financing an operating requirement for a growing share of post-acute providers.
By Recourse Structure: Recourse Remains Predominant as Risk Transfer Gains Interest
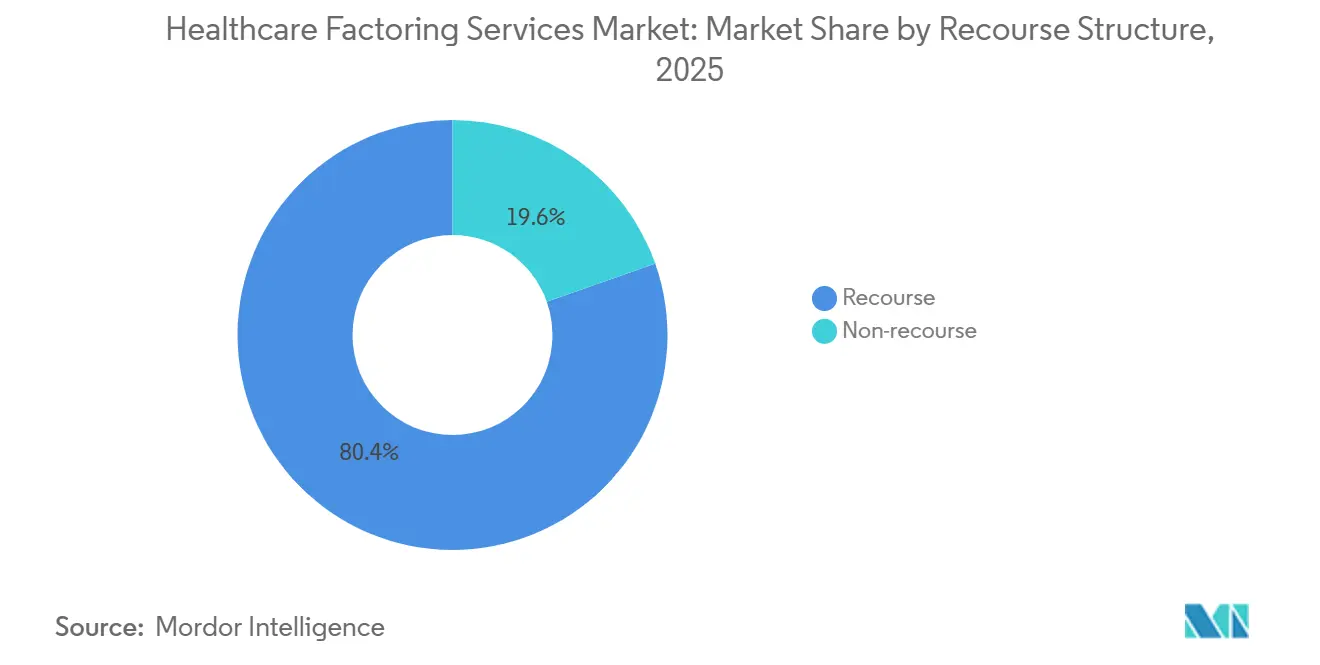
Recourse factoring accounted for 80.4% of the healthcare factoring services market volume in 2025. This structure aligns with established risk practices and can offer lower costs where providers have predictable collection histories. Hospital systems commonly use recourse structures because diversified payer mixes can make residual risk easier to price. The arrangement provides an advance secured by receivables while leaving certain collection risks with the originator. It also helps providers preserve cash without requiring a complete transfer of claim risk.
Non-recourse factoring is projected to expand at 5.9% CAGR through 2031. Rising denials and clawbacks can increase provider interest in structures that transfer more reimbursement risk to the factor. In healthcare, standard non-recourse coverage may address payer insolvency but not every billing-related denial. Thrivory stated that its model predicts reimbursement amounts, claim collectability, and payer-level denial probabilities. Products with claim-level risk assessment may be relevant for home health and post-acute providers facing changing reimbursement conditions. The healthcare factoring services market may see more selective use of non-recourse products in these settings.
By Distribution Channel: Banks Lead in Large Facilities While Specialists Differentiate on Underwriting
Bank and bank-owned factors held 51.1% of distribution channel volume in 2025. Their position reflects relationships with large health systems, lower funding costs, and the balance-sheet capacity required for large facilities. These advantages are important where payer portfolios are high volume and well-documented. Independent commercial factors serve mid-market originators that need more flexible underwriting than banks may offer. The channel structure remains shaped by both the size of the facility and the complexity of the receivables.
Specialist healthcare factors are projected to grow at 8.0% CAGR through 2031. Their underwriting can use payer-specific claim records, denial patterns, and compliant intake workflows. This approach is important for physician groups, post-acute providers, and ancillary providers where claim characteristics are more varied. Financing embedded in electronic health record and revenue cycle systems can remove traditional broker steps. Platform-connected providers may receive faster funding decisions because the factor can access structured claim data. This shift may disadvantage standalone providers that lack billing-platform integrations in the healthcare factoring services market.
By Category: Domestic Programs Lead While International Activity Builds
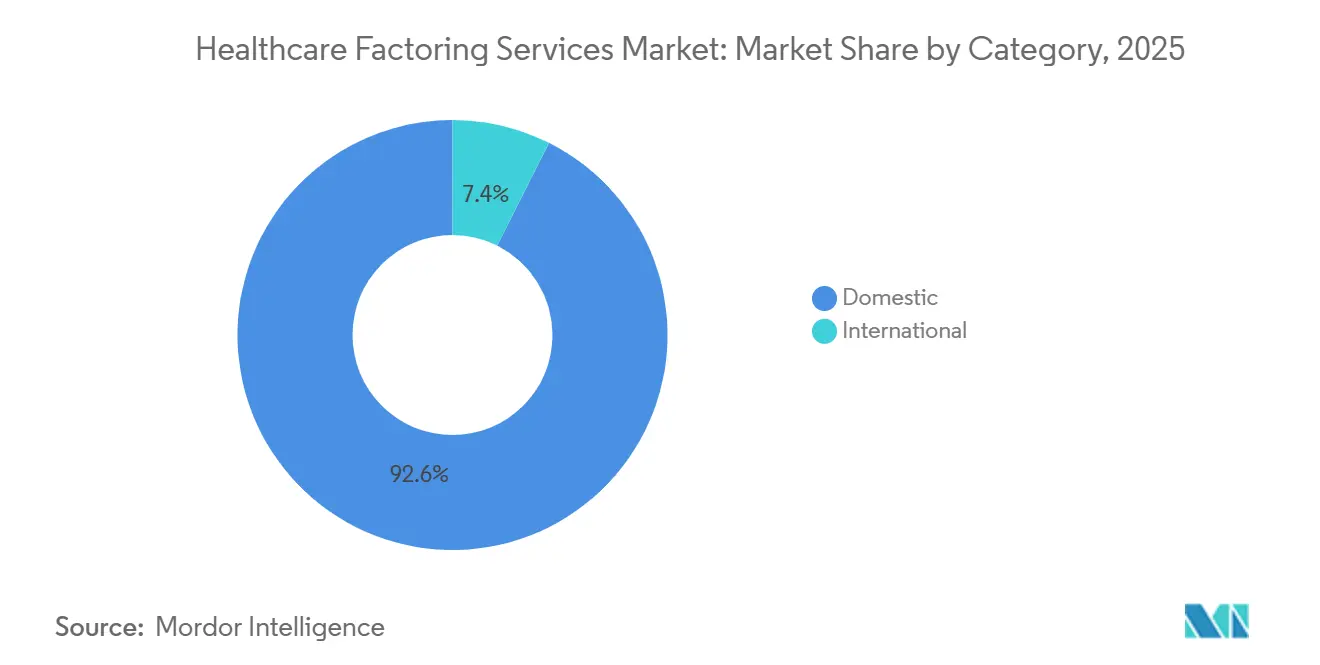
Domestic transactions held 92.6% of the healthcare factoring services market volume in 2025. North America and Europe have mature payer systems that produce high-volume, documented receivables. Healthcare underwriting also depends on payer behavior data built through experience in a specific jurisdiction. This accumulated knowledge can make entry into a new domestic market difficult for a new factor. Domestic leadership, therefore, reflects market maturity and established underwriting capability.
International factoring is projected to grow at 10.2% CAGR through 2031. Cross-border pharmaceutical and medical device supply chains create invoiced payment flows that can be financed. Medical staffing movements between Gulf Cooperation Council countries and South and Southeast Asian talent pools may also support cross-border receivables activity. FCI reported that North American factoring volume rose 35.1% in 2025. Digital invoicing and mobile healthcare workforces can make international programs operationally more feasible. The healthcare factoring services market can develop international products that are distinct from domestic claim-financing programs.
By Enterprise Size: Large Enterprises Hold More Volume While Smaller Providers Gain Access
Large healthcare enterprises accounted for 58.8% of market volume in 2025. National hospital systems, large staffing companies, and pharmaceutical distributors produce receivable pools that can support dedicated facilities. Their scale permits tailored payer-concentration controls and facility structures. Cost of funds remains important in this tier, but relationship quality and regulatory expertise also affect provider choice. Large-enterprise clients continue to be central to the healthcare factoring services market.
Small and medium-sized enterprises are projected to grow at 6.1% CAGR through 2031. Independent practices, small home health agencies, and community behavioral health providers may seek liquidity without relying on traditional credit histories. Their underlying claims can be sound even where their financial documentation is limited. Nitra is providing financing to independent medical practices and has committed USD 20 billion through 2028. Claim-based underwriting can assess the receivable directly rather than relying only on the originator’s financial history. This approach can expand factoring access among smaller providers.
Geography Analysis
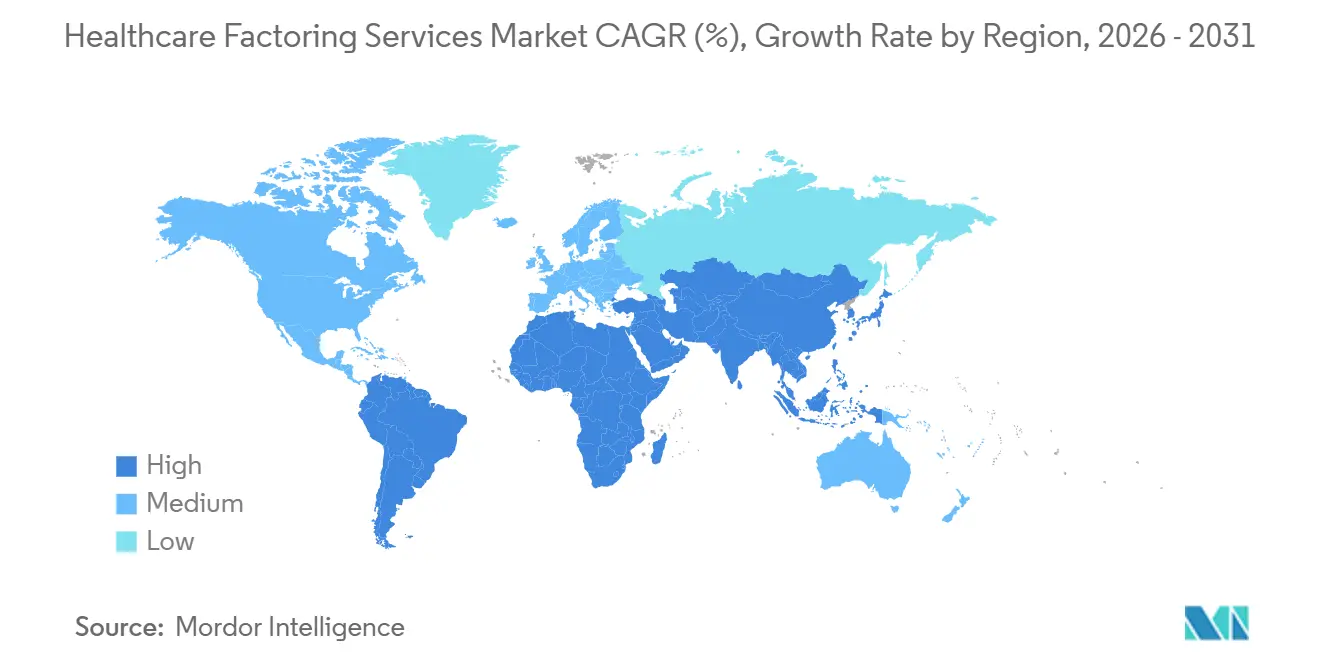
Europe held 39.1% of the healthcare factoring services market size in 2025. The region has established factoring infrastructure across the United Kingdom, Germany, France, Italy, and Spain. FCI reported European factoring turnover of EUR 2,658 billion (USD 2,871 billion) in 2025, representing 65.8% of global volume and a 2.2% increase from 2024. Germany recorded 6.3% growth in factoring volume during 2025. The European Factoring and Commercial Finance Union reported EUR 2.558 trillion (USD 2.763 trillion) in 2025 turnover for the broader European region. The regional regulatory setting combines wider digital invoicing adoption with data-protection requirements for healthcare information.
North America is the second-largest regional market, and the United States accounts for the largest individual-country factoring volume. FCI reported a 35.1% rise in North American factoring volume in 2025. United States providers lost USD 48 billion to final denials and bad debt in 2025. Commercial final denial rates rose 9.1% year over year to 2.89% in 2026. Canada contributes to cross-border activity where staffing firms support the United States clinical labor needs. Mexico and South America have developed private healthcare financing activity, although payer standardization remains limited.
Asia-Pacific is projected to grow at 7.0% CAGR through 2031, the fastest rate among the geographic segments. FCI reported regional factoring turnover of EUR 995 billion (USD 1,075 billion) in 2025. China recorded EUR 713 billion (USD 770 billion) in factoring volume in 2025, while Singapore grew 15.9% and India grew 13.9%. The Middle East and Africa recorded EUR 60.2 billion (USD 65.0 billion) in aggregate factoring volume in 2025. Saudi Arabia and the United Arab Emirates have more developed organization conditions because they import medical goods and use international clinical staffing. Healthcare infrastructure expansion can create documented receivables that support the broader healthcare factoring services market.
Competitive Landscape
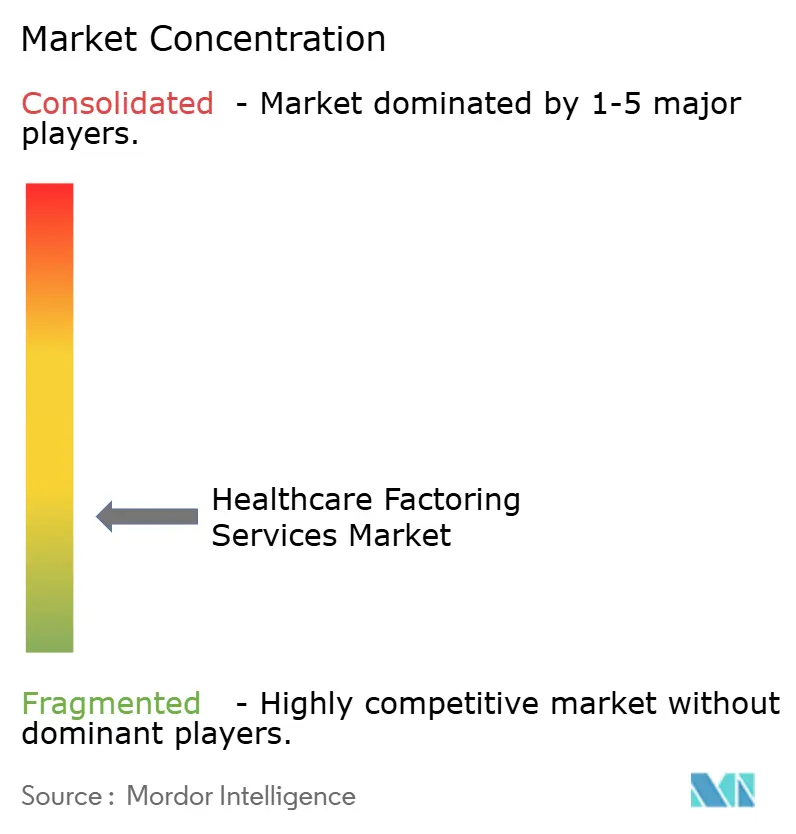
The healthcare factoring services market is fragmented. Bank-owned financing entities hold strong positions with high-volume hospital systems, while specialist healthcare factors and independent commercial factors compete for mid-market and post-acute clients. Competition is concentrated at the ends of the facility range. A small group of banks and technology-enabled specialists serves facilities above USD 30 million. Numerous niche providers serve small and medium-sized enterprise facilities below USD 5 million. Underwriting quality has become a key differentiator because factors must assess payer denials, coding risks, and recoupment exposure at the receivable level.
Technology-enabled providers are focusing on billing-platform connections and claim-level underwriting. eCapital has funded more than 44,000 clients and deployed more than USD 144 billion across 80-plus industries. In August 2026, eCapital provided a USD 30 million facility to a multi-state post-acute provider with 18 facilities. It also provided a USD 11 million healthcare receivables facility to a nationwide specialty pharmacy provider in August 2026. Thrivory launched an application programming interface that embeds same-day non-recourse claim payments into provider workflows in November 2025. These moves show that service delivery is shifting toward connected funding products.
Opportunities remain in embedded funding, behavioral health, home-based care, and community clinics that fall below bank facility thresholds. Factors can selectively finance claims with acceptable payer and denial-risk characteristics. HIPAA Business Associate Agreement obligations can create an entry barrier for firms without established compliance processes. The proposed HIPAA Security Rule could add further requirements for systems handling protected health information. Banks are likely to retain large hospital clients where scale and capital cost are decisive. Specialist providers can compete where payer complexity, claim data, and faster funding are more important within the healthcare factoring services market.
Healthcare Factoring Services Industry Leaders
-
eCapital Corp.
-
PRN Funding LLC
-
REV Capital
-
Porter Capital Corporation
-
Viva Capital Funding, LLC
- *Disclaimer: Major Players sorted in no particular order
Recent Industry Developments
- September 2026: Viva Capital Funding extended and upsized its investment-grade corporate notes to USD 35.5 million. The company has provided over USD 2.5 billion in capital to growing businesses since 1999, and the note upsize supports expanded factoring origination across healthcare and adjacent sectors.
- August 2026: eCapital provided a USD 30 million healthcare receivables financing facility to a leading multi-state post-acute care provider operating across 18 skilled nursing and post-acute care facilities. The facility is customized to the provider's reimbursement operating model and supports operations, expansion, and workforce investment in a complex payer environment.
- August 2026: eCapital extended a USD 11 million healthcare receivables financing facility to a nationwide specialty pharmacy provider serving patients with complex treatment needs. The facility addresses working-capital needs arising from multifaceted reimbursement structures in specialty pharmacy, a segment where payer mix complexity limits conventional bank access.
- April 2026: Capital Industrial Financial Services Group, through its associate Beijing West Factoring, extended a credit facility of up to RMB 200 million (USD 27.5 million) to Shouyi Medical for healthcare supply chain financing. The partnership connects Shouyi Medical's procurement platform with Beijing West Factoring's specialty supply-chain capabilities, deepening medical factoring penetration in China.
Global Healthcare Factoring Services Market Report Scope
| Provider-To-Payer Claims |
| Healthcare-Supplier B2B Invoices |
| Hospitals and Health Systems |
| Physician Groups and Clinics |
| Post-Acute and Community Care |
| Ancillary Providers (Lab, Imaging, DME, Pharmacy, Ambulance) |
| Healthcare Suppliers and Staffing |
| Recourse |
| Non-Recourse |
| Specialist Healthcare Factors |
| Bank and Bank-Owned Factors |
| Independent Commercial Factors |
| Domestic |
| International |
| Small and Medium-Sized Healthcare Businesses |
| Large Healthcare Enterprises |
| North America | United States |
| Canada | |
| Mexico | |
| South America | Brazil |
| Argentina | |
| Rest of South America | |
| Europe | United Kingdom |
| Germany | |
| France | |
| Italy | |
| Spain | |
| Rest of Europe | |
| Asia-Pacific | China |
| Japan | |
| India | |
| South Korea | |
| Australia | |
| Indonesia | |
| Thailand | |
| Malaysia | |
| Singapore | |
| Vietnam | |
| Rest of Asia-Pacific | |
| Middle East and Africa | Saudi Arabia |
| United Arab Emirates | |
| Turkey | |
| South Africa | |
| Egypt | |
| Rest of Middle East and Africa |
| By Receivable Origin | Provider-To-Payer Claims | |
| Healthcare-Supplier B2B Invoices | ||
| By Client Type | Hospitals and Health Systems | |
| Physician Groups and Clinics | ||
| Post-Acute and Community Care | ||
| Ancillary Providers (Lab, Imaging, DME, Pharmacy, Ambulance) | ||
| Healthcare Suppliers and Staffing | ||
| By Recourse Structure | Recourse | |
| Non-Recourse | ||
| By Distribution Channel | Specialist Healthcare Factors | |
| Bank and Bank-Owned Factors | ||
| Independent Commercial Factors | ||
| By Category | Domestic | |
| International | ||
| By Enterprise Size | Small and Medium-Sized Healthcare Businesses | |
| Large Healthcare Enterprises | ||
| By Geography | North America | United States |
| Canada | ||
| Mexico | ||
| South America | Brazil | |
| Argentina | ||
| Rest of South America | ||
| Europe | United Kingdom | |
| Germany | ||
| France | ||
| Italy | ||
| Spain | ||
| Rest of Europe | ||
| Asia-Pacific | China | |
| Japan | ||
| India | ||
| South Korea | ||
| Australia | ||
| Indonesia | ||
| Thailand | ||
| Malaysia | ||
| Singapore | ||
| Vietnam | ||
| Rest of Asia-Pacific | ||
| Middle East and Africa | Saudi Arabia | |
| United Arab Emirates | ||
| Turkey | ||
| South Africa | ||
| Egypt | ||
| Rest of Middle East and Africa | ||
Key Questions Answered in the Report
What is the projected value of healthcare factoring services by 2031?
The healthcare factoring services market is projected to reach USD 304.2 billion by 2031, growing at 5.2% CAGR from 2026.
Why do healthcare providers use receivables factoring?
Providers use factoring to address the gap between immediate operating costs and payer reimbursement cycles that often extend from 60 to 120 days.
Which receivable type accounts for the largest volume?
Provider-to-payer claims accounted for 72.3% of volume in 2025 because insurance and government reimbursement create recurring documented receivables.
Which client group is growing the fastest?
Post-acute and community care providers are projected to grow at 6.6% CAGR through 2031 as staffing needs expand faster than reimbursement cycles.
Which region leads healthcare receivables financing?
Europe held the leading 39.1% share in 2025, supported by established factoring infrastructure in the United Kingdom, Germany, France, Italy, and Spain.
What is the fastest-growing category in this field?
International factoring is projected to grow at 10.2% CAGR through 2031, supported by cross-border medical supply chains and healthcare staffing flows.