
Hazardous Waste Logistics Market Size and Share
Market Overview
| Study Period | 2020 - 2031 |
|---|---|
| Market Size (2026) | USD 15.45 Billion |
| Market Size (2031) | USD 21.09 Billion |
| Growth Rate (2026 - 2031) | 6.42 % |
| Fastest Growing Market | South America |
| Largest Market | Asia-Pacific |
| Market Concentration | Medium |
Major Players *Disclaimer: Major Players sorted in no particular order Image © Mordor Intelligence. Reuse requires attribution under CC BY 4.0. | |
Hazardous Waste Logistics Market Analysis by Mordor Intelligence
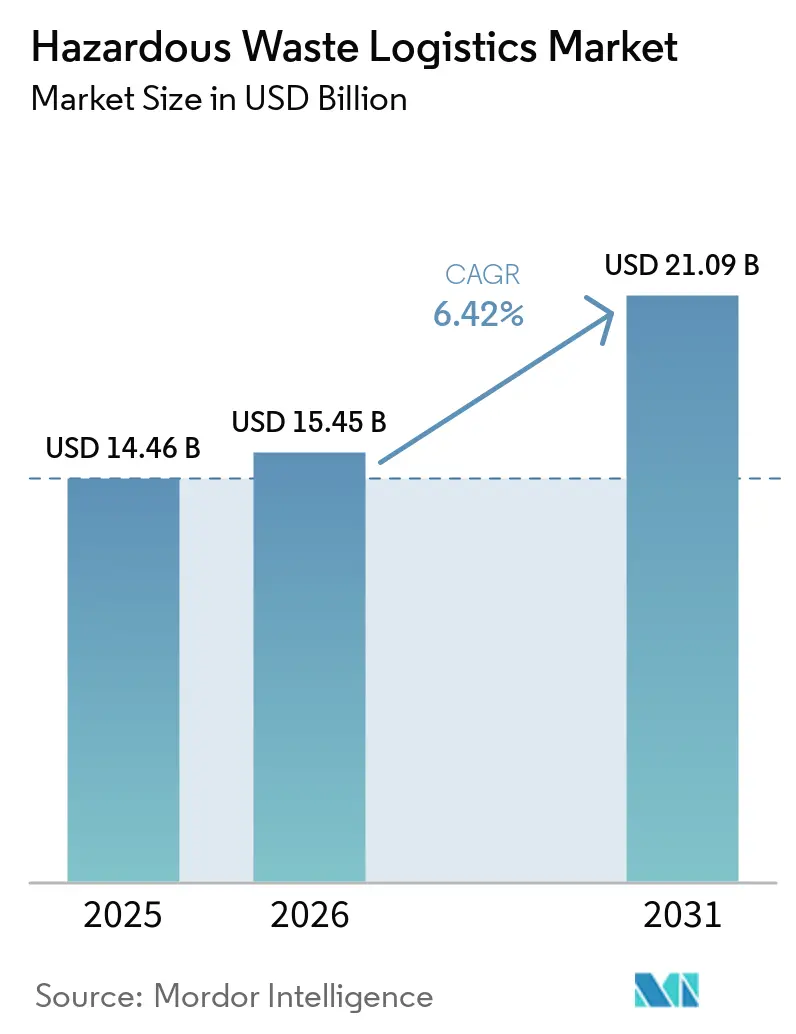
The hazardous waste logistics market size was valued at USD 14.46 billion in 2025 and is estimated to grow from USD 15.45 billion in 2026 to reach USD 21.09 billion by 2031, at a CAGR of 6.42% during the forecast period (2026-2031).
The hazardous waste logistics market is expanding as regulators bring more waste streams into formal tracking and treatment systems. Contracted compliance specialists are becoming more important as generators manage tighter classification, reporting, and shipment rules. Growth in energy-transition materials and pharmaceutical waste is increasing demand for specialized collection, packaging, transport, and treatment placement. Digital manifests, GPS tracking, and auditable records are raising the minimum operating standard for carriers and service providers. The hazardous waste logistics market also favors operators with permitted treatment, storage, and disposal networks because facility access remains difficult to replicate.
Key Report Takeaways
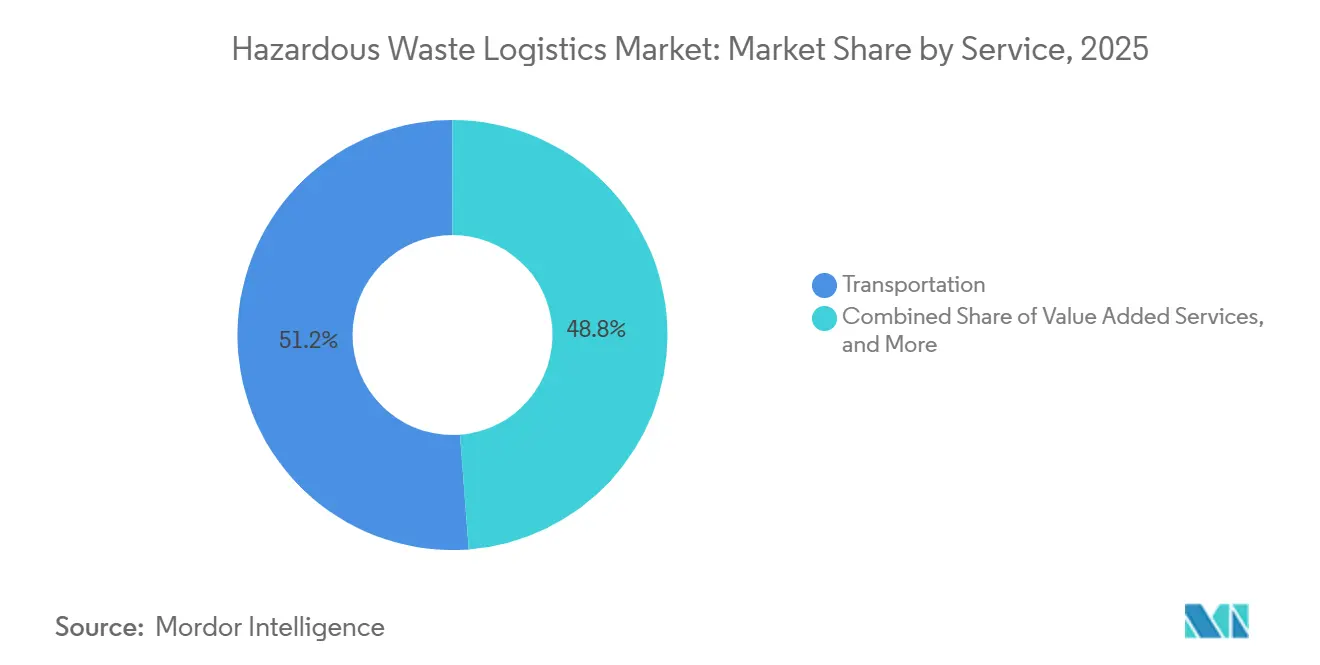
- By service, transportation held 51.20% of the hazardous waste logistics market share in 2025, while value-added services are projected to grow at an 8.05% CAGR through 2031.
- By waste type, chemical waste held 38.70% of the hazardous waste logistics market size in 2025, while e-waste is forecast to grow at an 8.30% CAGR through 2031.
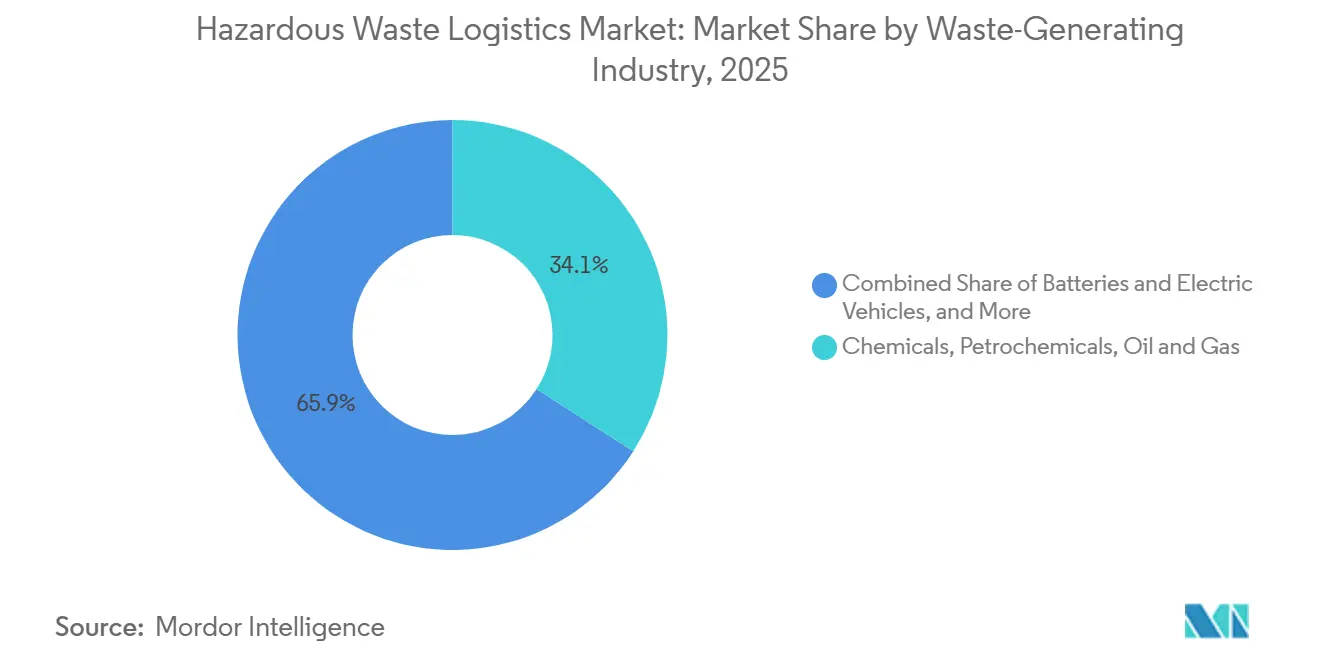
- By waste-generating industry, chemicals, petrochemicals, oil, and gas generated 34.15% of revenue in 2025, while batteries and electric vehicles are forecast to grow at an 8.22% CAGR through 2031.
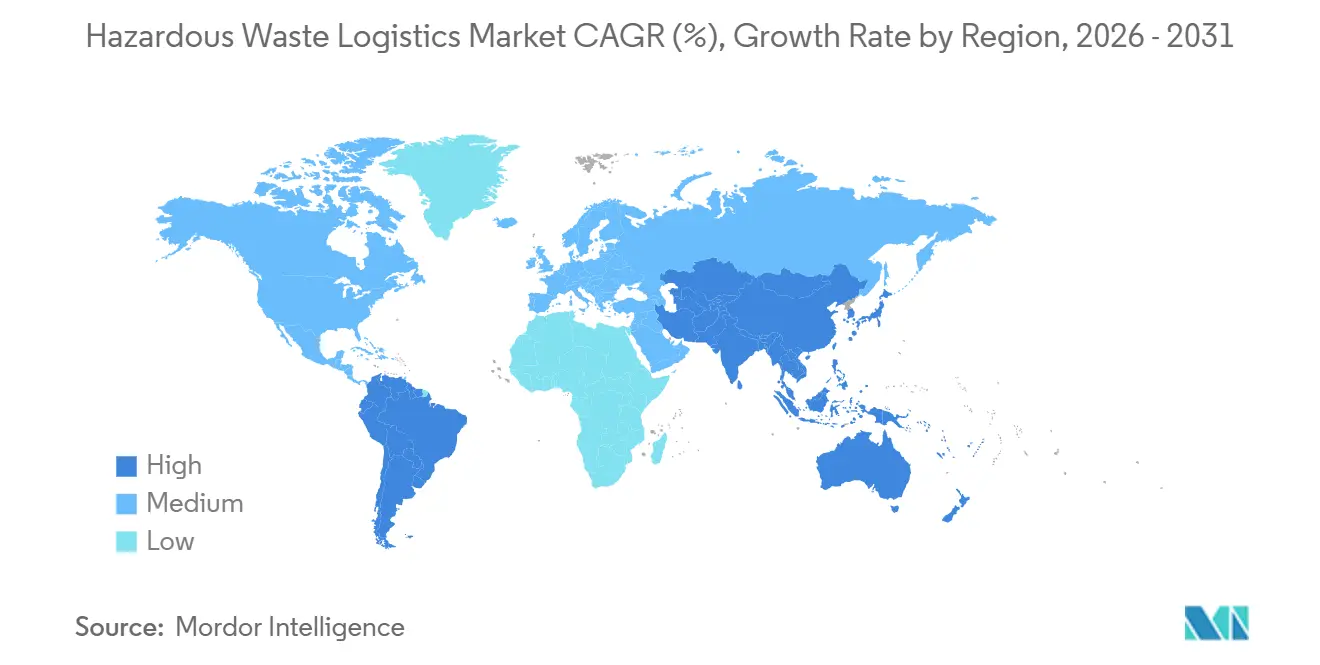
- By geography, Asia-Pacific held 31.15% of revenue in 2025, while South America is forecast to grow at a 7.96% CAGR through 2031.
Note: Market size and forecast figures in this report are generated using Mordor Intelligence’s proprietary estimation framework, updated with the latest available data and insights as of January 2026.
Global Hazardous Waste Logistics Market Trends and Insights
Drivers Impact Analysis*
| Driver | (~) % Impact on CAGR Forecast | Geographic Relevance | Impact Timeline |
|---|---|---|---|
| Industrial and Pharmaceutical Waste Generation Growth | +1.8% | Global, concentrated in North America, Europe, and the Asia-Pacific | Medium term (2-4 years) |
| Tightening Hazardous Waste Classification and Shipment Controls | +1.6% | Global, with the highest regulatory intensity in North America and Europe | Short term (≤ 2 years) |
| Expansion of Battery, E-Waste, and Critical-Mineral Recycling Logistics | +1.5% | Asia-Pacific core, with spillover to North America and Europe | Medium term (2-4 years) |
| Digital Manifesting, GPS Tracking, and Audit-Ready Chain of Custody | +1.1% | North America and Europe, with early adoption in the Asia-Pacific | Short term (≤ 2 years) |
| Outsourcing of Generator Compliance and Multi-Site Waste Programs | +0.9% | North America, Europe, and the Asia-Pacific | Medium term (2-4 years) |
| PFAS and Emerging-Contaminant Characterization Creating Premium Logistics Demand | +0.7% | North America and Europe | Long term (≥ 4 years) |
| Source: Mordor Intelligence | |||
Industrial and Pharmaceutical Waste Generation Growth
Industrial output and the formalization of pharmaceutical waste management support recurring demand throughout the hazardous waste logistics market. The World Health Organization states that 15% of healthcare waste is hazardous, including infectious, toxic, carcinogenic, flammable, and radioactive material. High-income countries generated as much as 0.5 kg of hazardous waste per hospital bed each day. Michigan adopted EPA Subpart P pharmaceutical waste requirements in May 2025, strengthening controls over chemotherapy agents, controlled substances, and returned drug stock. Pharmaceutical providers need chemistry-qualified personnel, controlled-substance permissions, and electronic tracking, which makes this work more specialized than standard transport. PHMSA oversees more than 1 million daily hazardous-material shipments under Title 49 CFR, which supports a broad compliance-driven service base.
Tightening Hazardous Waste Classification and Shipment Controls
The hazardous waste logistics market is gaining volume as classification rules widen the material covered by permitted handling. Beginning January 2025, Basel Convention controls applied Prior Informed Consent procedures to international shipments coded A1181 and Y49. These procedures covered hazardous and non-hazardous e-waste, creating new consent and documentation work for cross-border electronic scrap shipments.[1] EPA launched the Hazardous Waste Information Platform in September 2025, with geospatial search, real-time visualization, and improved access to compliance data. Domestic exporters also began submitting export manifests electronically in December 2025. These changes create work for certified operators while making it harder for less-capitalized carriers to compete on documented routes.
Expansion of Battery, E-Waste, and Critical-Mineral Recycling Logistics
Battery, e-waste, and critical-mineral recovery require transport systems that can manage fire, toxicity, containment, and documentation risks. EPA reported in May 2026 that a 2025 survey across 39 states ranked batteries as the most difficult material to manage among 21 waste categories.[2] The survey cited fire risk, high operating cost, and infrastructure gaps, which increased demand for HAZMAT-endorsed carriers and specialized containment. Global battery recycling pretreatment and material-recovery capacity increased 50% year-over-year, with China accounting for 80% of both measures. Fewer than 80 of 193 countries assessed by the IEA had e-waste regulations in place by mid-2025.[3] As regulations formalize, the hazardous waste logistics market is positioned to direct more material toward permitted providers that can absorb the related documentation burden.
Digital Manifesting, GPS Tracking, and Audit-Ready Chain of Custody
Digital records are changing how generators evaluate logistics providers. EPA published a proposed rule in March 2026 to phase out paper manifests and move to a fully electronic e-Manifest system. A 2025 GSA evaluation of 4,484,661 hazardous waste manifests found that electronic records required corrections less often than paper records, at 6.0% compared with 7.7%. EPA’s e-Manifest system processed 11.6 million manifests from 2018 through September 2024 and collected more than USD 101 million in user fees. Electronic export manifest requirements have already extended the system to international flows. Providers with integrated submissions, fleet telemetry, and electronic signatures can serve large generators that require reliable audit trails in the hazardous waste logistics market.
Restraints Impact Analysis*
| Restraint | (~) % Impact on CAGR Forecast | Geographic Relevance | Impact Timeline |
|---|---|---|---|
| High Insurance, Liability, and Specialized Fleet Costs | -0.8% | Global, most acute in North America and Europe | Short term (≤ 2 years) |
| Cross-Jurisdiction Classification and Permit Complexity | -0.6% | Global, with the highest friction in the cross-border Asia-Pacific and South America | Medium term (2-4 years) |
| Qualified Driver, Chemist, and Dangerous-Goods Specialist Shortages | -0.5% | North America and Europe | Medium term (2-4 years) |
| Treatment-Facility Acceptance Risk for Battery, PFAS, and Unknown Chemical Loads | -0.3% | North America, with early signals in Europe | Long term (≥ 4 years) |
| Source: Mordor Intelligence | |||
Cross-Jurisdiction Classification and Permit Complexity
Cross-border and multi-state requirements limit network efficiency and increase compliance costs. The Basel Convention requires notification, written consent, physical movement, and disposal confirmation for each regulated shipment. National definitions of hazardous waste differ across 190 Parties, and exporters are directed to confirm requirements with authorities in destination and transit countries. EPA’s January 2025 capacity assessment reported annual commercial landfill receipt limits of 600,000 tons in Alabama and 425,000 tons in New York. These limits can force rerouting and extend haul distances across the hazardous waste logistics market. The hazardous waste logistics market must also operate across RCRA rules and state-authorized programs that can differ from federal standards.
Qualified Driver, Chemist, and Dangerous-Goods Specialist Shortages
Skilled labor shortages constrain service capacity on regulated routes. PHMSA requires function-specific hazardous-material training that covers awareness, safety, security, and material-specific handling.[4] This requirement creates a qualification threshold beyond a standard commercial driver’s license. A March 2025 bill cited a shortage of 78,800 qualified truck drivers and proposed tax credits of up to USD 7,500 for current HAZMAT-eligible drivers and USD 10,000 for new apprentices. United States Department of Transportation policy changes may remove 200,000 drivers over the following 2 years. Driver groups also petitioned federal officials in June 2025 to enforce classification rules after incidents involving undisclosed dangerous loads.
*Our forecasts treat driver/restraint impacts as directional, not additive. The impact forecasts reflect baseline growth, mix effects, and variable interactions.
Segment Analysis
By Service: Integrated Compliance Platforms Reshape Transport’s Position
Transportation held 51.20% of the hazardous waste logistics market share in 2025. Road, rail, air, and sea networks link waste generators with RCRA-permitted treatment, storage, and disposal facilities. Road transport supports time-sensitive and small-batch industrial and pharmaceutical shipments. Rail serves large-volume bulk chemical generators because it can move higher payloads efficiently. Warehousing and storage services command higher unit pricing because they require RCRA Part B permissions. These facilities need secondary containment, temperature control, and separation of incompatible chemicals.
Value-added services are projected to expand at an 8.05% CAGR through 2031. Waste profiling, laboratory analysis, reporting, and electronic manifest preparation are becoming central vendor-selection criteria. Michigan’s adoption of pharmaceutical waste rules in May 2025 increased documentation work within these services. Electronic export manifest requirements that began in December 2025 also strengthened the need for compliance support. The hazardous waste logistics industry is rewarding providers that combine software, certified chemistry expertise, and permit management. These capabilities help providers earn more on multi-stream contracts than single-mode carriers in the hazardous waste logistics market.
By Waste Type: Chemical Waste Anchors Volume While E-Waste Changes Growth
Chemical waste held 38.70% of the hazardous waste logistics market size in 2025. Solvent recovery, reactive and corrosive liquid transport, and delivery to permitted incinerators support this position. EPA identified 11 commercial incineration facilities with an aggregate annual capacity of 890,000 tons in the United States in January 2025. This limited treatment base sustains transport demand for chemical waste across the hazardous waste logistics market. Industrial process and radioactive waste remain permit-intensive categories with durable incumbent positions. Biomedical and clinical waste provides recurring premium revenue as healthcare waste requires controlled handling.
E-waste is forecast to grow at an 8.30% CAGR through 2031. Basel controls that took effect in January 2025 added consent and manifest workflows for international e-waste movements. The IEA reported that e-waste metals held a large chunk of the waste category, while less than one-third was recovered. Weak upstream collection and logistics systems contribute to that recovery gap. Pharmaceutical and hazardous drug waste is also growing as Subpart P adoption expands across the United States. Oncology procedures generate chemotherapy waste that requires high-temperature incineration logistics.
By Waste-Generating Industry: Energy Transition Streams Redefine Demand
Chemicals, petrochemicals, oil, and gas generated 34.15% of hazardous waste logistics revenue in 2025. These operations create continuous reactive, flammable, and toxic waste that requires permitted transport. Pharmaceutical, healthcare, and laboratory clients generate chemotherapy waste, controlled-substance returns, and laboratory chemical streams. Manufacturing and automotive operations add paint waste, solvents, and heavy-metal sludge. Mining and metals produce tailings and acid process waste that often requires multimodal movement. Agriculture and fertilizer production in South America also create pesticide residue streams needing segregated, temperature-controlled transport.
Batteries and electric vehicles are forecast to advance at an 8.22% CAGR through 2031. Retiring electric vehicle fleets, lithium-ion battery fire risk, and collection mandates are increasing specialized logistics demand within the hazardous waste logistics market. EPA reported in May 2026 that battery collection programs were operated across the United States. The 2025 state survey found that ranked batteries were the most difficult material to manage, highlighting the premium required for safe specialist transport. Semiconductor process chemicals and heavy-metal sludge from Asian fabrication centers add another growing stream. Government and defense work includes radioactive materials and specialized chemicals that move through uniquely permitted corridors.
Geography Analysis
Asia-Pacific held 31.15% of the hazardous waste logistics market share in 2025. China’s industrial waste output and its concentration of semiconductor, battery, and petrochemical production underpin regional logistics demand. Co-processing programs direct hazardous residues to permitted cement kilns, supporting collection and transport while reducing tipping fees. These programs do not address PFAS, battery, or pharmaceutical materials that require conventional treatment. India expanded formal electronics dismantling and logistics infrastructure in 2025 through its Battery Waste Management Rules. Japan and South Korea support premium services linked to electronics and automotive manufacturing in the hazardous waste logistics market.
North America is the second-largest geography, supported by RCRA, PHMSA regulations, and the e-Manifest platform. The platform processed 11.6 million manifests between 2018 and September 2024. Canada and Mexico support cross-border waste flows under bilateral arrangements with the United States. Europe operates under the EU Waste Framework Directive and the Basel Convention regime. The amended directive entered into force in October 2025, shaping documentation expectations for the hazardous waste logistics market. Germany, France, and the United Kingdom generate substantial industrial waste volumes, while the Nordic countries sustain premium compliance services.
South America is forecast to grow at a 7.96% CAGR through 2031. Brazil’s producer-responsibility requirements for batteries and electronics underpin regional demand in the hazardous waste logistics market. Chile and Peru generate mining-related process chemical and tailings waste that is increasingly subject to environmental enforcement. Argentina adds hazardous volumes through petrochemical and agribusiness activity. Saudi Arabia, the United Arab Emirates, and Qatar support hydrocarbon-related logistics under high-enforcement regulatory settings. South Africa and Nigeria remain early-stage formalization locations where certified operators serve a premium niche alongside wider informal waste systems.
Competitive Landscape
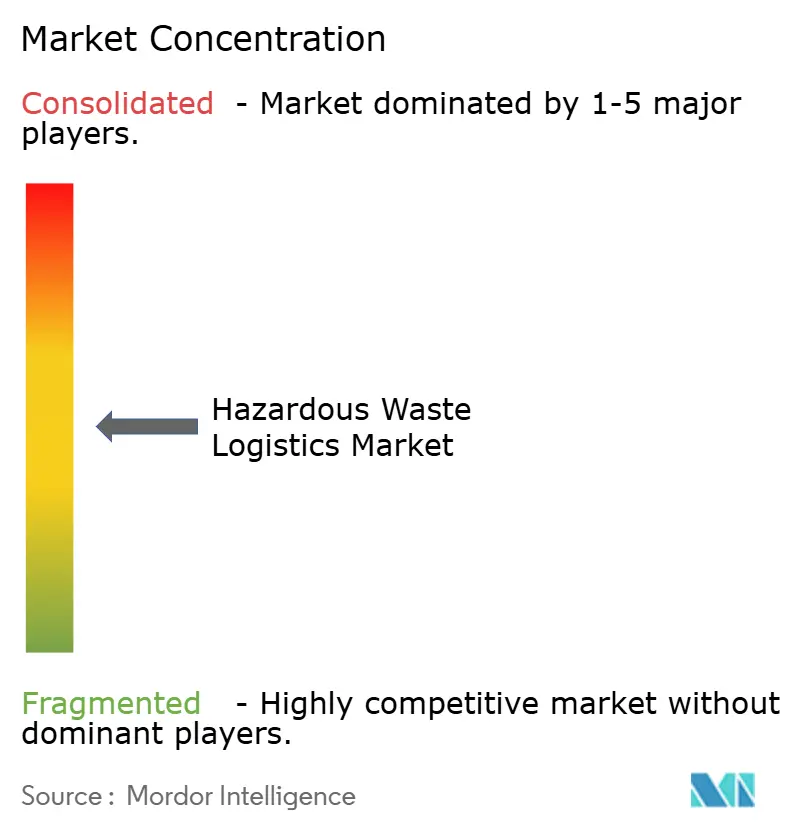
The hazardous waste logistics market is moderately consolidated at the upper tier. Large operators have permitted treatment, storage, and disposal networks, multimodal fleets, and chemistry expertise that smaller providers cannot quickly replicate. RCRA Part B permitting and capital-intensive compliance requirements reinforce those advantages. Veolia announced the acquisition of Clean Earth for USD 3.04 billion in November 2025. The transaction was completed in 2026 and doubled Veolia’s United States hazardous waste footprint.
Clean Harbors signed an agreement in August 2026 to acquire EnviroServe for USD 470 million. EnviroServe serves 2,500 customers through 40 locations and holds permits in 48 states. Clean Harbors also agreed to acquire the environmental businesses of Depot Connect International for USD 130 million in February 2026. Veolia plans to bring 285,000 tons of incineration and solvent-recovery capacity online by 2027 after completing five tuck-in acquisitions in the first half of 2025. These moves show that network density and treatment placement are central competitive priorities in the hazardous waste logistics market.
Technology is another important differentiator in the hazardous waste logistics market. Integrated manifest systems, GPS fleet tracking, and waste-characterization tools support lower error rates and better chain-of-custody records. Triumvirate Environmental began expanding its Casa Grande, Arizona, facility in April 2026 with an RCRA Part B treatment, storage, and disposal facility. The project addresses infrastructure gaps in the Southwest’s semiconductor, defense, and battery manufacturing corridor. VLS Environmental Solutions acquired IDR Environmental Services in March 2026 and Environmental & Chemical Consulting in July 2026 to strengthen its West Coast coverage. PFAS logistics remain underserved where high-concentration waste needs characterization, containment, and Subtitle C landfill placement.
Hazardous Waste Logistics Industry Leaders
-
Veolia Environnement S.A.
-
Clean Harbors, Inc.
-
Waste Management, Inc.
-
SUEZ S.A.
-
Republic Services, Inc.
- *Disclaimer: Major Players sorted in no particular order
Recent Industry Developments
- August 2026: Clean Harbors, Inc. signed a definitive agreement to acquire EnviroServe for USD 470 million in cash. The target serves 2,500 customers through 40 locations with permits in 48 states, adding rail services, remediation, industrial cleaning, and hazardous waste transport capacity to Clean Harbors’ North American network.
- July 2026: VLS Environmental Solutions acquired Environmental & Chemical Consulting, a Los Angeles-based hazardous and non-hazardous waste provider, extending its 10-day logistics network into Northern California and strengthening cross-border processing capabilities across California, Arizona, Texas, and Tijuana.
- May 2026: EPA submitted the Battery Collection Best Practices: Report to Congress, identifying logistics gaps in battery waste management across 39 states and recommending expanded producer-responsibility frameworks with safe transportation and handling standards.
- April 2026: Triumvirate Environmental commenced expansion of its Casa Grande, Arizona, facility with a RCRA Part B hazardous waste treatment, storage, and disposal facility. The project addresses infrastructure gaps in the Southwest’s semiconductor, defense, and battery manufacturing corridor.
Global Hazardous Waste Logistics Market Report Scope
| Transportation | Road |
| Rail | |
| Air | |
| Sea and Inland Waterway | |
| Warehousing and Storage | |
| Value Added Services |
| Chemical Waste |
| Industrial Process Waste |
| E-waste |
| Radioactive and Nuclear-Related Waste |
| Biomedical and Clinical Waste |
| Pharmaceutical and Hazardous Drug Waste |
| Other Waste Types |
| Agriculture and Fertilizers |
| Batteries and Electric Vehicles |
| Chemicals, Petrochemicals, Oil & Gas |
| Construction, Infrastructure, and Remediation |
| Hi-Tech Industry |
| Energy and Utilities |
| Government and Defense |
| Pharmaceuticals, Healthcare & Laboratories |
| Manufacturing and Automotive |
| Mining and Metals |
| Others |
| North America | United States |
| Canada | |
| Mexico | |
| South America | Brazil |
| Argentina | |
| Peru | |
| Chile | |
| Rest of South America | |
| Europe | Germany |
| United Kingdom | |
| France | |
| Italy | |
| Spain | |
| Russia | |
| Nordics (Denmark, Finland, Iceland, Norway, and Sweden) | |
| Rest of Europe | |
| Asia-Pacific | China |
| India | |
| Japan | |
| South Korea | |
| Australia | |
| Southeast Asia (ASEAN) | |
| Rest of Asia-Pacific | |
| Middle East and Africa | Saudi Arabia |
| United Arab Emirates | |
| Qatar | |
| South Africa | |
| Nigeria | |
| Egypt | |
| Rest of Middle East and Africa |
| By Service | Transportation | Road |
| Rail | ||
| Air | ||
| Sea and Inland Waterway | ||
| Warehousing and Storage | ||
| Value Added Services | ||
| By Waste Type | Chemical Waste | |
| Industrial Process Waste | ||
| E-waste | ||
| Radioactive and Nuclear-Related Waste | ||
| Biomedical and Clinical Waste | ||
| Pharmaceutical and Hazardous Drug Waste | ||
| Other Waste Types | ||
| By Waste-Generating Industry | Agriculture and Fertilizers | |
| Batteries and Electric Vehicles | ||
| Chemicals, Petrochemicals, Oil & Gas | ||
| Construction, Infrastructure, and Remediation | ||
| Hi-Tech Industry | ||
| Energy and Utilities | ||
| Government and Defense | ||
| Pharmaceuticals, Healthcare & Laboratories | ||
| Manufacturing and Automotive | ||
| Mining and Metals | ||
| Others | ||
| By Geography | North America | United States |
| Canada | ||
| Mexico | ||
| South America | Brazil | |
| Argentina | ||
| Peru | ||
| Chile | ||
| Rest of South America | ||
| Europe | Germany | |
| United Kingdom | ||
| France | ||
| Italy | ||
| Spain | ||
| Russia | ||
| Nordics (Denmark, Finland, Iceland, Norway, and Sweden) | ||
| Rest of Europe | ||
| Asia-Pacific | China | |
| India | ||
| Japan | ||
| South Korea | ||
| Australia | ||
| Southeast Asia (ASEAN) | ||
| Rest of Asia-Pacific | ||
| Middle East and Africa | Saudi Arabia | |
| United Arab Emirates | ||
| Qatar | ||
| South Africa | ||
| Nigeria | ||
| Egypt | ||
| Rest of Middle East and Africa | ||
Key Questions Answered in the Report
What is the forecast growth rate for hazardous waste logistics?
The sector is forecast to grow at a 6.42% CAGR from 2026 to 2031, reaching USD 21.09 billion by 2031. Regulatory classification, digital documentation, and specialized treatment access are key reasons the hazardous waste logistics market is growing.
Which service is the largest in hazardous waste handling?
Transportation held 51.20% of revenue in 2025 because permitted road, rail, air, and sea networks connect generators with treatment facilities. The hazardous waste logistics market relies on these networks to move materials safely to authorized sites.
Why are battery shipments becoming more specialized?
A 2025 survey across 39 states ranked batteries as the most difficult waste material to manage because of fire risk, cost, and infrastructure gaps. Those risks are increasing the need for specialist services in the hazardous waste logistics market.
Which waste stream is growing fastest?
E-waste is forecast to grow at an 8.30% CAGR through 2031 as cross-border controls expand consent and documentation requirements. This stream adds formal handling work for the hazardous waste logistics market.
Which region is expected to grow fastest?
South America is projected to grow at a 7.96% CAGR through 2031, supported by battery and electronics rules and mining-related waste flows. Formal collection and compliance requirements can expand the hazardous waste logistics market in the region.
What capabilities do large generators seek from providers?
Large generators increasingly require electronic manifests, GPS tracking, certified chemistry expertise, and reliable chain-of-custody records. Those requirements favor integrated providers in the hazardous waste logistics market.