Guar Market Analysis by Mordor Intelligence
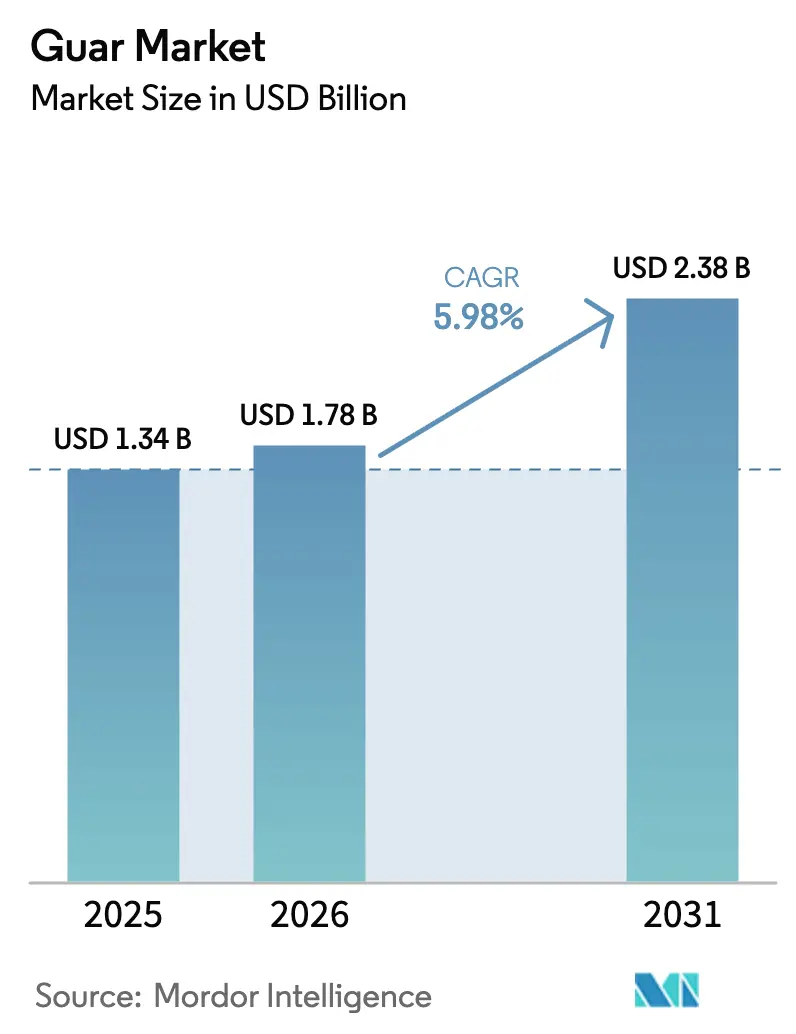
The guar market size is projected to grow from USD 1.34 billion in 2025 to USD 1.78 billion in 2026 and is forecast to reach USD 2.38 billion by 2031 at a 5.98% CAGR over 2026-2031. Robust demand for guar gum as a clean-label thickener in food and beverages and as a fast-hydrating polymer in hydraulic fracturing supports this expansion, even as drilling cycles in North America introduce periodic volatility[1]Source: Agricultural and Processed Food Products Export Development Authority, “Fresh Fruits and Vegetables,” APEDA.GOV.IN. India supplied 70-80% of global output in 2024, and Rajasthan alone accounted for more than 70% of the country’s production, making the global value chain sensitive to monsoon variability and infrastructure bottlenecks [2]Source: Business Standard, “Guar Seed Prices Fall Rs 100, Guar Gum Down Rs 300 on Weak Export Demand,” BUSINESS-STANDARD.COM. The Asia-Pacific region dominates global guar demand, followed by North America, with Europe representing the next major consumption market. South America, the Middle East, and Africa collectively account for a smaller but steadily growing share. Long-term growth opportunities are driven by clean-label reformulation in packaged foods, the use of digital agriculture tools to improve guar productivity, and policy support for drought-resilient crops. However, market growth is constrained by the availability of synthetic substitutes, increasing compliance costs due to pesticide-residue regulations, and price volatility influenced by monsoon variability[3]Source: NITI Aayog, “Agriculture Roadmap 2047,” NITI.GOV.IN.
Key Report Takeaways
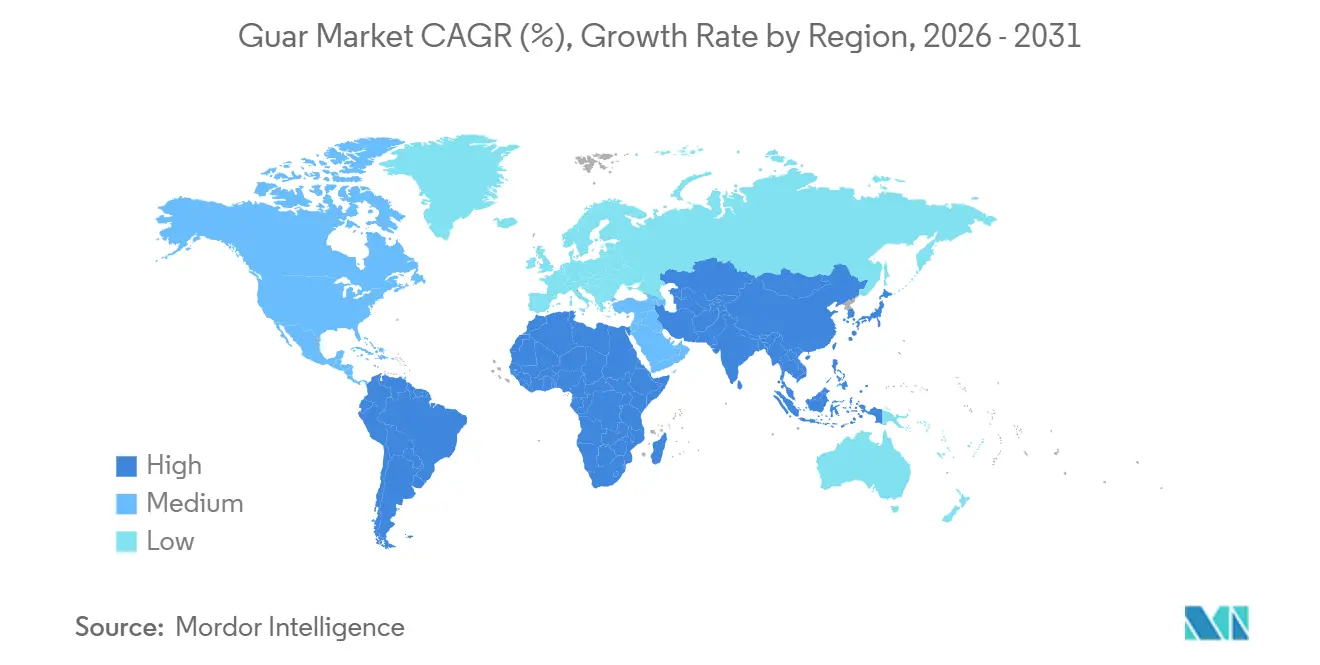
- By geography, Asia-Pacific led with 44% guar market share in 2025, and South America is forecast to expand at a 6.6% CAGR through 2031.
Note: Market size and forecast figures in this report are generated using Mordor Intelligence’s proprietary estimation framework, updated with the latest available data and insights as of January 2026.
Global Guar Market Trends and Insights
Drivers Impact Analysis*
| Driver | (~) % Impact on CAGR Forecast | Geographic Relevance | Impact Timeline |
|---|---|---|---|
| Growing demand for natural thickening agents in food and beverages | +1.20% | Global, with focus on North America, Europe, and Asia-Pacific urban centers | Medium term (2 – 4 years) |
| Expansion of hydraulic fracturing fluids consumption in oil and gas | +1.50% | North America (Permian Basin, Eagle Ford), Middle East, and South America (Vaca Muerta) | Short term (≤ 2 years) |
| Substitution of synthetic drilling polymers by plant-based guar gum | +0.80% | North America and Middle East, extended to Asia-Pacific offshore drilling | Medium term (2 – 4 years) |
| Premiumization in pet-food formulations using clean-label hydrocolloids | +0.50% | North America, Europe, and Asia-Pacific premium segments | Long term (≥ 4 years) |
| Government incentives for drought-resilient crops in arid regions | +0.90% | India, Pakistan, Iran, Sudan, and Nigeria | Long term (≥ 4 years) |
| AI-enabled yield forecasting and contract-farming adoption | +0.60% | India, China, pilot sites in Africa and South America | Medium term (2 – 4 years) |
| Source: Mordor Intelligence | |||
Growing Demand for Natural Thickening Agents in Food and Beverages
Clean-label preferences are fueling guar market growth as manufacturers replace modified starches and synthetic emulsifiers with plant-based alternatives across dairy, bakery, and beverage lines. Guar gum delivers high viscosity at dosages of 0.2 to 0.5% by weight, which keeps formulation costs in check relative to xanthan or locust bean gum. Revised European labeling rules under the Food Information to Consumers Regulation strengthen guar’s appeal because its E412 designation offers regulatory clarity absent in many synthetics [4]Source: United States Department of Agriculture Foreign Agricultural Service, “Maximum Residue Limits Database,” FAS.USDA.GOV. North American brands pair guar with carrageenan or pectin to trim overall hydrocolloid load, while Asia-Pacific’s expanding middle class lifts demand for premium ice cream, gluten-free bread, and ready-to-eat meals that all benefit from guar’s moisture retention and freeze–thaw stability.
Expansion of Hydraulic Fracturing Fluids Consumption in Oil and Gas
Horizontal-well completions rely on guar’s ability to suspend proppants at high temperature and pressure. The Permian Basin absorbs 60-70% of North America’s guar imports when crude prices are above USD 70 per barrel. Argentina’s Vaca Muerta, delivering 140,000 barrels per day in 2025, mirrors that model and triggers fresh demand. Middle-East offshore programs tap guar derivatives with superior thermal resilience for high-salinity reservoirs. However, a shift toward slickwater designs and synthetic friction reducers moderates absolute volume growth, illustrating that guar demand remains cyclical with drilling activity.
Substitution of Synthetic Drilling Polymers by Plant-Based Guar Gum
Environmental, social, and governance mandates are driving operators to switch from polyacrylamide to biodegradable guar systems. Regulators in the European Union and several United States states scrutinize acrylamide contamination, making Guar’s rapid biodegradation 80 to 90% within 28 days under aerobic conditions an attractive compliance lever. Oilfield-service majors have commercialized cross-linked guar gels optimized for high-temperature wells, allowing operators to meet sustainability targets without sacrificing proppant transport efficiency. When environmental fees are factored in, the cost gap between guar and synthetics narrows, bolstering guar’s competitiveness.
Government Incentives for Drought-Resilient Crops in Arid Regions
Minimum support prices and subsidized inputs encourage Indian farmers to plant guar on marginal land, while Pakistan offers acreage-linked subsidies and crop insurance. Iran’s Sistan and Baluchestan province funds guar pilots who use 40-50% less irrigation than cotton. These programs diversify global supply, tempering price volatility linked to India’s monsoon. They also improve farmers' economics because guar fixes atmospheric nitrogen, reducing fertilizer costs for subsequent crops.
Restraints Impact Analysis*
| Restraint | (~) % Impact on CAGR Forecast | Geographic Relevance | Impact Timeline |
|---|---|---|---|
| Monsoon-driven price volatility in major producing belts | -1.00% | India and Pakistan, with global spillover | Short term (≤ 2 years) |
| Availability of low-cost synthetic substitutes such as polyacrylamide | -0.70% | North America, Middle East, and offshore projects worldwide | Medium term (2 – 4 years) |
| Stricter pesticide-residue limits in key importing countries | -0.50% | Europe, North America, and Japan | Medium term (2 – 4 years) |
| Logistics bottlenecks in remote producing regions | -0.40% | Rajasthan and Gujarat in India, Punjab in Pakistan, and Sudan | Short term (≤ 2 years) |
| Source: Mordor Intelligence | |||
Availability of Low-Cost Synthetic Substitutes Such as Polyacrylamide
When guar exceeds USD 1.50 per kg, many North American shale operators default to polyacrylamide friction reducers that deliver consistent viscosity at lower dosage rates. Slickwater fracturing further reduces guar intensity per well by 20-30%. In foods, xanthan and carboxymethyl cellulose compete effectively in gluten-free baking and dairy stabilization because they offer superior freeze–thaw stability and pH tolerance, even at higher per-kilogram prices.
Stricter Pesticide-Residue Limits in Key Importing Countries
The European Union enforces a default limit of 0.01 milligram per kilogram for pesticides without specific Maximum Residue Limits (MRLs), and guar beans fall under code 0260010-006. Compliance requirements force exporters to fund lab tests and traceability, adding USD 10-15 per 100 kgs to landed costs [5]Source: United States Department of Agriculture Foreign Agricultural Service, “Maximum Residue Limits Database,” FAS.USDA.GOV. Similar standards in Japan and the United States raise the barrier for smallholders who lack training in approved agrochemicals and application timing.
*Our forecasts treat driver/restraint impacts as directional, not additive. The impact forecasts reflect baseline growth, mix effects, and variable interactions.
Geography Analysis
In 2025, the Asia-Pacific region accounted for 44% of the guar market share, driven by India's significant role in cultivation, processing, and exports. Guar production in this region is concentrated in arid and semi-arid areas and is supported by a fragmented processing base catering to food, pharmaceutical, textile, and industrial applications. Domestic consumption within Asia-Pacific has steadily increased, reflecting the growing use of guar gum in packaged foods, healthcare products, and value-added industrial applications. This trend has gradually reduced the region's reliance on exports.
South America is the fastest-growing guar market, with a compound annual growth rate (CAGR) of 6.6%. This growth is fueled by demand from the energy sector in Argentina and clean-label reformulation trends in Brazil's food industry. In Argentina, shale development drives the need for guar-based drilling fluids, while Brazilian dairy and bakery manufacturers increasingly use guar gum as a replacement for synthetic stabilizers. Although the region's reliance on imports makes it vulnerable to currency fluctuations, demand remains robust across strong end-use sectors.
North America and Europe are mature guar markets with stable consumption patterns, supported by applications in food processing, pharmaceuticals, pet food, and industrial sectors. The United States and major European economies rely heavily on imports and face increasingly stringent compliance requirements for pesticide residues and sustainability standards. In contrast, the Middle East and Africa represent smaller but developing markets. Growth in these regions is supported by oil and gas applications, mining, food processing, and interest in guar as a drought-resistant crop. However, infrastructure and local processing limitations continue to constrain short-term expansion.


Competitive Landscape
Guar cultivation is characterized by its highly fragmented nature, with production distributed among millions of smallholder farmers. In contrast, the processing segment is more consolidated, dominated by a limited number of organized players. Companies such as Hindustan Gum have established strong positions through vertically integrated operations encompassing farmer sourcing, milling, and logistics, ensuring consistent quality and a reliable supply. Other key processors, including Vikas WSP, Jai Bharat Gum, Neelkanth Polymers, and Sunita Hydrocolloids, significantly contribute to the processing landscape, collectively bolstering the organized segment despite the fragmented upstream structure.
Competition in the guar processing industry is increasingly shaped by factors such as quality assurance, compliance, and procurement efficiency rather than scale alone. Global specialty-ingredient companies like Ingredion and Corbion have implemented stricter supplier audit requirements, encouraging Indian guar processors to adopt advanced quality-testing technologies, digital traceability systems, and improved environmental management practices. At the sourcing level, agtech platforms are facilitating direct procurement from farmers, reducing dependence on commission agents and lowering transaction costs. However, the adoption of technology remains uneven. Leading processors are utilizing automated grading systems and in-line viscosity monitoring, while smaller mills continue to rely on manual inspection methods.
End-market exposure plays a critical role in differentiating processors. While oilfield applications provide volume stability, they often exert pressure on margins, prompting companies to diversify into higher-value segments such as food, pharmaceuticals, and cosmetics. Processors like Hindustan Gum, Vikas WSP, and Neelkanth Polymers are increasingly focusing on value-added guar derivatives to mitigate commodity price risks and enhance profitability. Concurrently, research collaborations, often involving universities, are driving the development of advanced guar chemistries. These innovations are expanding application possibilities and strengthening the competitive position of innovation-driven players in the guar market.
Recent Industry Developments
- October 2024: In India, export data from the Agricultural and Processed Food Products Export Development Authority (APEDA) and the Directorate General of Commercial Intelligence and Statistics (DGCI&S) for FY24 indicated a decline in guar export value despite stable volumes. This trend reflects weak oilfield prices, prompting processors to shift focus toward food- and pharmaceutical-grade guar.
- November 2024: Tate & Lyle PLC completed its USD 1.8 billion acquisition of CP Kelco from J.M. Huber Corporation, combining Tate & Lyle's sweetening and mouthfeel platforms with CP Kelco's pectin and speciality gums portfolio, including guar, to create a global speciality food and beverage solutions business.
- March 2024: In the European Union-India guar trade during 2024, the enforcement of the default Maximum Residue Level (MRL) of 0.01 mg/kg heightened compliance requirements. Indian exporters enhanced traceability and testing systems, benefiting organized processors and driving consolidation within the guar processing market.


Global Guar Market Report Scope
The Guar Market Report is Segmented by Geography (North America, Europe, Asia-Pacific, South America, and More). The Report Includes Production Analysis (Volume), Consumption Analysis (Value and Volume), Export Analysis (Value and Volume), Import Analysis (Value and Volume), Wholesale Price Trend Analysis and Forecast, List of Key Players, Regulatory Framework, Logistics and Infrastructure, and Seasonality Analysis. The Market Forecasts are Provided in Terms of Value (USD) and Volume (Metric Tons).
By Geography
| North America | United States | Production Analysis (Area Harvested, Yield, and Production Volume) |
| Consumption Analysis (Consumption Value and Volume) | ||
| Import Market Analysis (Import Value, Volume, and Key Supplying Markets) | ||
| Export Market Analysis (Export Value, Volume, and Key Destination Markets) | ||
| Wholesale Price Trend Analysis and Forecast | ||
| Regulatory Framework | ||
| List of Key Players | ||
| Logistics and Infrastructure | ||
| Seasonality Analysis | ||
| Mexico | Production Analysis (Area Harvested, Yield, and Production Volume) | |
| Consumption Analysis (Consumption Value and Volume) | ||
| Import Market Analysis (Import Value, Volume, and Key Supplying Markets) | ||
| Export Market Analysis (Export Value, Volume, and Key Destination Markets) | ||
| Wholesale Price Trend Analysis and Forecast | ||
| Regulatory Framework | ||
| List of Key Players | ||
| Logistics and Infrastructure | ||
| Seasonality Analysis | ||
| Europe | Russia | Production Analysis (Area Harvested, Yield, and Production Volume) |
| Consumption Analysis (Consumption Value and Volume) | ||
| Import Market Analysis (Import Value, Volume, and Key Supplying Markets) | ||
| Export Market Analysis (Export Value, Volume, and Key Destination Markets) | ||
| Wholesale Price Trend Analysis and Forecast | ||
| Regulatory Framework | ||
| List of Key Players | ||
| Logistics and Infrastructure | ||
| Seasonality Analysis | ||
| Italy | Production Analysis (Area Harvested, Yield, and Production Volume) | |
| Consumption Analysis (Consumption Value and Volume) | ||
| Import Market Analysis (Import Value, Volume, and Key Supplying Markets) | ||
| Export Market Analysis (Export Value, Volume, and Key Destination Markets) | ||
| Wholesale Price Trend Analysis and Forecast | ||
| Regulatory Framework | ||
| List of Key Players | ||
| Logistics and Infrastructure | ||
| Seasonality Analysis | ||
| France | Production Analysis (Area Harvested, Yield, and Production Volume) | |
| Consumption Analysis (Consumption Value and Volume) | ||
| Import Market Analysis (Import Value, Volume, and Key Supplying Markets) | ||
| Export Market Analysis (Export Value, Volume, and Key Destination Markets) | ||
| Wholesale Price Trend Analysis and Forecast | ||
| Regulatory Framework | ||
| List of Key Players | ||
| Logistics and Infrastructure | ||
| Seasonality Analysis | ||
| Germany | Production Analysis (Area Harvested, Yield, and Production Volume) | |
| Consumption Analysis (Consumption Value and Volume) | ||
| Import Market Analysis (Import Value, Volume, and Key Supplying Markets) | ||
| Export Market Analysis (Export Value, Volume, and Key Destination Markets) | ||
| Wholesale Price Trend Analysis and Forecast | ||
| Regulatory Framework | ||
| List of Key Players | ||
| Logistics and Infrastructure | ||
| Seasonality Analysis | ||
| Asia-Pacific | China | Production Analysis (Area Harvested, Yield, and Production Volume) |
| Consumption Analysis (Consumption Value and Volume) | ||
| Import Market Analysis (Import Value, Volume, and Key Supplying Markets) | ||
| Export Market Analysis (Export Value, Volume, and Key Destination Markets) | ||
| Wholesale Price Trend Analysis and Forecast | ||
| Regulatory Framework | ||
| List of Key Players | ||
| Logistics and Infrastructure | ||
| Seasonality Analysis | ||
| India | Production Analysis (Area Harvested, Yield, and Production Volume) | |
| Consumption Analysis (Consumption Value and Volume) | ||
| Import Market Analysis (Import Value, Volume, and Key Supplying Markets) | ||
| Export Market Analysis (Export Value, Volume, and Key Destination Markets) | ||
| Wholesale Price Trend Analysis and Forecast | ||
| Regulatory Framework | ||
| List of Key Players | ||
| Logistics and Infrastructure | ||
| Seasonality Analysis | ||
| Japan | Production Analysis (Area Harvested, Yield, and Production Volume) | |
| Consumption Analysis (Consumption Value and Volume) | ||
| Import Market Analysis (Import Value, Volume, and Key Supplying Markets) | ||
| Export Market Analysis (Export Value, Volume, and Key Destination Markets) | ||
| Wholesale Price Trend Analysis and Forecast | ||
| Regulatory Framework | ||
| List of Key Players | ||
| Logistics and Infrastructure | ||
| Seasonality Analysis | ||
| Australia | Production Analysis (Area Harvested, Yield, and Production Volume) | |
| Consumption Analysis (Consumption Value and Volume) | ||
| Import Market Analysis (Import Value, Volume, and Key Supplying Markets) | ||
| Export Market Analysis (Export Value, Volume, and Key Destination Markets) | ||
| Wholesale Price Trend Analysis and Forecast | ||
| Regulatory Framework | ||
| List of Key Players | ||
| Logistics and Infrastructure | ||
| Seasonality Analysis | ||
| South America | Brazil | Production Analysis (Area Harvested, Yield, and Production Volume) |
| Consumption Analysis (Consumption Value and Volume) | ||
| Import Market Analysis (Import Value, Volume, and Key Supplying Markets) | ||
| Export Market Analysis (Export Value, Volume, and Key Destination Markets) | ||
| Wholesale Price Trend Analysis and Forecast | ||
| Regulatory Framework | ||
| List of Key Players | ||
| Logistics and Infrastructure | ||
| Seasonality Analysis | ||
| Argentina | Production Analysis (Area Harvested, Yield, and Production Volume) | |
| Consumption Analysis (Consumption Value and Volume) | ||
| Import Market Analysis (Import Value, Volume, and Key Supplying Markets) | ||
| Export Market Analysis (Export Value, Volume, and Key Destination Markets) | ||
| Wholesale Price Trend Analysis and Forecast | ||
| Regulatory Framework | ||
| List of Key Players | ||
| Logistics and Infrastructure | ||
| Seasonality Analysis | ||
| Middle East | Turkey | Production Analysis (Area Harvested, Yield, and Production Volume) |
| Consumption Analysis (Consumption Value and Volume) | ||
| Import Market Analysis (Import Value, Volume, and Key Supplying Markets) | ||
| Export Market Analysis (Export Value, Volume, and Key Destination Markets) | ||
| Wholesale Price Trend Analysis and Forecast | ||
| Regulatory Framework | ||
| List of Key Players | ||
| Logistics and Infrastructure | ||
| Seasonality Analysis | ||
| Iran | Production Analysis (Area Harvested, Yield, and Production Volume) | |
| Consumption Analysis (Consumption Value and Volume) | ||
| Import Market Analysis (Import Value, Volume, and Key Supplying Markets) | ||
| Export Market Analysis (Export Value, Volume, and Key Destination Markets) | ||
| Wholesale Price Trend Analysis and Forecast | ||
| Regulatory Framework | ||
| List of Key Players | ||
| Logistics and Infrastructure | ||
| Seasonality Analysis | ||
| Africa | Nigeria | Production Analysis (Area Harvested, Yield, and Production Volume) |
| Consumption Analysis (Consumption Value and Volume) | ||
| Import Market Analysis (Import Value, Volume, and Key Supplying Markets) | ||
| Export Market Analysis (Export Value, Volume, and Key Destination Markets) | ||
| Wholesale Price Trend Analysis and Forecast | ||
| Regulatory Framework | ||
| List of Key Players | ||
| Logistics and Infrastructure | ||
| Seasonality Analysis | ||
| Egypt | Production Analysis (Area Harvested, Yield, and Production Volume) | |
| Consumption Analysis (Consumption Value and Volume) | ||
| Import Market Analysis (Import Value, Volume, and Key Supplying Markets) | ||
| Export Market Analysis (Export Value, Volume, and Key Destination Markets) | ||
| Wholesale Price Trend Analysis and Forecast | ||
| Regulatory Framework | ||
| List of Key Players | ||
| Logistics and Infrastructure | ||
| Seasonality Analysis | ||
| South Africa | Production Analysis (Area Harvested, Yield, and Production Volume) | |
| Consumption Analysis (Consumption Value and Volume) | ||
| Import Market Analysis (Import Value, Volume, and Key Supplying Markets) | ||
| Export Market Analysis (Export Value, Volume, and Key Destination Markets) | ||
| Wholesale Price Trend Analysis and Forecast | ||
| Regulatory Framework | ||
| List of Key Players | ||
| Logistics and Infrastructure | ||
| Seasonality Analysis | ||
| By Geography | North America | United States | Production Analysis (Area Harvested, Yield, and Production Volume) |
| Consumption Analysis (Consumption Value and Volume) | |||
| Import Market Analysis (Import Value, Volume, and Key Supplying Markets) | |||
| Export Market Analysis (Export Value, Volume, and Key Destination Markets) | |||
| Wholesale Price Trend Analysis and Forecast | |||
| Regulatory Framework | |||
| List of Key Players | |||
| Logistics and Infrastructure | |||
| Seasonality Analysis | |||
| Mexico | Production Analysis (Area Harvested, Yield, and Production Volume) | ||
| Consumption Analysis (Consumption Value and Volume) | |||
| Import Market Analysis (Import Value, Volume, and Key Supplying Markets) | |||
| Export Market Analysis (Export Value, Volume, and Key Destination Markets) | |||
| Wholesale Price Trend Analysis and Forecast | |||
| Regulatory Framework | |||
| List of Key Players | |||
| Logistics and Infrastructure | |||
| Seasonality Analysis | |||
| Europe | Russia | Production Analysis (Area Harvested, Yield, and Production Volume) | |
| Consumption Analysis (Consumption Value and Volume) | |||
| Import Market Analysis (Import Value, Volume, and Key Supplying Markets) | |||
| Export Market Analysis (Export Value, Volume, and Key Destination Markets) | |||
| Wholesale Price Trend Analysis and Forecast | |||
| Regulatory Framework | |||
| List of Key Players | |||
| Logistics and Infrastructure | |||
| Seasonality Analysis | |||
| Italy | Production Analysis (Area Harvested, Yield, and Production Volume) | ||
| Consumption Analysis (Consumption Value and Volume) | |||
| Import Market Analysis (Import Value, Volume, and Key Supplying Markets) | |||
| Export Market Analysis (Export Value, Volume, and Key Destination Markets) | |||
| Wholesale Price Trend Analysis and Forecast | |||
| Regulatory Framework | |||
| List of Key Players | |||
| Logistics and Infrastructure | |||
| Seasonality Analysis | |||
| France | Production Analysis (Area Harvested, Yield, and Production Volume) | ||
| Consumption Analysis (Consumption Value and Volume) | |||
| Import Market Analysis (Import Value, Volume, and Key Supplying Markets) | |||
| Export Market Analysis (Export Value, Volume, and Key Destination Markets) | |||
| Wholesale Price Trend Analysis and Forecast | |||
| Regulatory Framework | |||
| List of Key Players | |||
| Logistics and Infrastructure | |||
| Seasonality Analysis | |||
| Germany | Production Analysis (Area Harvested, Yield, and Production Volume) | ||
| Consumption Analysis (Consumption Value and Volume) | |||
| Import Market Analysis (Import Value, Volume, and Key Supplying Markets) | |||
| Export Market Analysis (Export Value, Volume, and Key Destination Markets) | |||
| Wholesale Price Trend Analysis and Forecast | |||
| Regulatory Framework | |||
| List of Key Players | |||
| Logistics and Infrastructure | |||
| Seasonality Analysis | |||
| Asia-Pacific | China | Production Analysis (Area Harvested, Yield, and Production Volume) | |
| Consumption Analysis (Consumption Value and Volume) | |||
| Import Market Analysis (Import Value, Volume, and Key Supplying Markets) | |||
| Export Market Analysis (Export Value, Volume, and Key Destination Markets) | |||
| Wholesale Price Trend Analysis and Forecast | |||
| Regulatory Framework | |||
| List of Key Players | |||
| Logistics and Infrastructure | |||
| Seasonality Analysis | |||
| India | Production Analysis (Area Harvested, Yield, and Production Volume) | ||
| Consumption Analysis (Consumption Value and Volume) | |||
| Import Market Analysis (Import Value, Volume, and Key Supplying Markets) | |||
| Export Market Analysis (Export Value, Volume, and Key Destination Markets) | |||
| Wholesale Price Trend Analysis and Forecast | |||
| Regulatory Framework | |||
| List of Key Players | |||
| Logistics and Infrastructure | |||
| Seasonality Analysis | |||
| Japan | Production Analysis (Area Harvested, Yield, and Production Volume) | ||
| Consumption Analysis (Consumption Value and Volume) | |||
| Import Market Analysis (Import Value, Volume, and Key Supplying Markets) | |||
| Export Market Analysis (Export Value, Volume, and Key Destination Markets) | |||
| Wholesale Price Trend Analysis and Forecast | |||
| Regulatory Framework | |||
| List of Key Players | |||
| Logistics and Infrastructure | |||
| Seasonality Analysis | |||
| Australia | Production Analysis (Area Harvested, Yield, and Production Volume) | ||
| Consumption Analysis (Consumption Value and Volume) | |||
| Import Market Analysis (Import Value, Volume, and Key Supplying Markets) | |||
| Export Market Analysis (Export Value, Volume, and Key Destination Markets) | |||
| Wholesale Price Trend Analysis and Forecast | |||
| Regulatory Framework | |||
| List of Key Players | |||
| Logistics and Infrastructure | |||
| Seasonality Analysis | |||
| South America | Brazil | Production Analysis (Area Harvested, Yield, and Production Volume) | |
| Consumption Analysis (Consumption Value and Volume) | |||
| Import Market Analysis (Import Value, Volume, and Key Supplying Markets) | |||
| Export Market Analysis (Export Value, Volume, and Key Destination Markets) | |||
| Wholesale Price Trend Analysis and Forecast | |||
| Regulatory Framework | |||
| List of Key Players | |||
| Logistics and Infrastructure | |||
| Seasonality Analysis | |||
| Argentina | Production Analysis (Area Harvested, Yield, and Production Volume) | ||
| Consumption Analysis (Consumption Value and Volume) | |||
| Import Market Analysis (Import Value, Volume, and Key Supplying Markets) | |||
| Export Market Analysis (Export Value, Volume, and Key Destination Markets) | |||
| Wholesale Price Trend Analysis and Forecast | |||
| Regulatory Framework | |||
| List of Key Players | |||
| Logistics and Infrastructure | |||
| Seasonality Analysis | |||
| Middle East | Turkey | Production Analysis (Area Harvested, Yield, and Production Volume) | |
| Consumption Analysis (Consumption Value and Volume) | |||
| Import Market Analysis (Import Value, Volume, and Key Supplying Markets) | |||
| Export Market Analysis (Export Value, Volume, and Key Destination Markets) | |||
| Wholesale Price Trend Analysis and Forecast | |||
| Regulatory Framework | |||
| List of Key Players | |||
| Logistics and Infrastructure | |||
| Seasonality Analysis | |||
| Iran | Production Analysis (Area Harvested, Yield, and Production Volume) | ||
| Consumption Analysis (Consumption Value and Volume) | |||
| Import Market Analysis (Import Value, Volume, and Key Supplying Markets) | |||
| Export Market Analysis (Export Value, Volume, and Key Destination Markets) | |||
| Wholesale Price Trend Analysis and Forecast | |||
| Regulatory Framework | |||
| List of Key Players | |||
| Logistics and Infrastructure | |||
| Seasonality Analysis | |||
| Africa | Nigeria | Production Analysis (Area Harvested, Yield, and Production Volume) | |
| Consumption Analysis (Consumption Value and Volume) | |||
| Import Market Analysis (Import Value, Volume, and Key Supplying Markets) | |||
| Export Market Analysis (Export Value, Volume, and Key Destination Markets) | |||
| Wholesale Price Trend Analysis and Forecast | |||
| Regulatory Framework | |||
| List of Key Players | |||
| Logistics and Infrastructure | |||
| Seasonality Analysis | |||
| Egypt | Production Analysis (Area Harvested, Yield, and Production Volume) | ||
| Consumption Analysis (Consumption Value and Volume) | |||
| Import Market Analysis (Import Value, Volume, and Key Supplying Markets) | |||
| Export Market Analysis (Export Value, Volume, and Key Destination Markets) | |||
| Wholesale Price Trend Analysis and Forecast | |||
| Regulatory Framework | |||
| List of Key Players | |||
| Logistics and Infrastructure | |||
| Seasonality Analysis | |||
| South Africa | Production Analysis (Area Harvested, Yield, and Production Volume) | ||
| Consumption Analysis (Consumption Value and Volume) | |||
| Import Market Analysis (Import Value, Volume, and Key Supplying Markets) | |||
| Export Market Analysis (Export Value, Volume, and Key Destination Markets) | |||
| Wholesale Price Trend Analysis and Forecast | |||
| Regulatory Framework | |||
| List of Key Players | |||
| Logistics and Infrastructure | |||
| Seasonality Analysis | |||


Key Questions Answered in the Report
What is the projected guar market size in 2031?
The guar market size is forecast to reach USD 2.38 billion in 2031 based on a 5.98% CAGR from 2026.
Which region leads global demand for guar gum?
Asia-Pacific leads with 44% share, anchored by India’s production and processing infrastructure.
Why are pesticide-residue limits a challenge for exporters?
The European Union and other high-compliance markets impose a 0.01 mg/kg default MRL for guar beans, adding USD 10 to USD 15 per 100 Kgs in testing and traceability costs.
How does AI improve guar farming?
AI-enabled advisory platforms optimize planting windows and inputs, lifting yields significantly in Rajasthan pilots.
Page last updated on:


